
Natural Resources
Conservation Service
-
Search


Major Land Resource Area or ecological site by name and/or ID.
PreviousSectionsNextGeneral information
Provisional. A provisional ecological site description has undergone quality control and quality assurance review. It contains a working state and transition model and enough information to identify the ecological site.
MLRA notes
Major Land Resource Area (MLRA): 133B–Western Coastal Plain
Major Land Resource Area (MLRA) 133B, Western Coastal Plain is in eastern Texas, western Louisiana, and the southwest corner of Arkansas. Locally termed the Pineywoods, the area is dominated by coniferous forest covering 45,450 square miles (117,770 square kilometers or 29,088,000 acres). The region is a hugely diverse transition zone between the eastern deciduous forests and the central grasslands to the west.
Classification relationships
NatureServe, 2002.
- CEGL007499 – West Gulf Coastal Plan Shortleaf Pine – Post Oak Forest
USDA-Natural Resources Conservation Service, 2006.
-Major Land Resource Area (MLRA) 133B
Soil Survey Staff, 2011.
- Woodland Suitability Group 2o7 and 2w8
Van Kley et. Al., 2007.
- 231.Ea.8.1.30 Shortleaf-southern red oak/Callicarpa-Chasmanthium Loamy Dry-Mesic Uplands
- 231.Ea.9.1.30 Shortleaf-southern red oak/Callicarpa-Chasmanthium Loamy Dry-Mesic Uplands
- 231.Ea.10.1.30 Shortleaf-post oak/Callicarpa-Chasmanthium Loamy Dry-Mesic Uplands
- 231.Ea.11.1.30 Shortleaf-post oak/Callicarpa-Chasmanthium Loamy Dry-Mesic UplandsEcological site concept
The Loamy Uplands have very deep loamy soils greater than 80 inches. The ecological sites produce high amounts of plant biomass because of the loamy growing medium with nonrestrictive soil textures through the soil profiles with adequate water-holding capacity. The sites generally have the most robust plant communities of any adjacent sites.
Associated sites
F133BY001TX Depression
Sites are lower in the landscape, have poor drainage patterns, and wetter associated plant species.
F133BY002TX Seasonally Wet Upland
Sites have poor drainage patterns and wetter associated plant species.
F133BY003TX Loamy Over Clayey Upland
Sites have clay textured soils instead of loamy textures.
F133BY004TX Loamy Claypan Upland
Sites have an abrupt textural change from loam to clay and are sometimes shallow to bedrock.
F133BY006TX Northern Sandy Loam Upland
Sites have deeper soil horizons of sandy and loamy textures. These sites are not as dense in biomass and have lessened accumulations of nutrients due to their sandier nature.
F133BY007TX Southern Sandy Loam Upland
Sites have deeper soil horizons of sandy and loamy textures. These sites are not as dense in biomass and have lessened accumulations of nutrients due to their sandier nature.
F133BY012TX Wet Terrace
Sites are located on terraces and are overall wetter with poor drainage and associated plant species.
F133BY013TX Terrace
Sites are located on the terrace landform.
Similar sites
F133BY006TX Northern Sandy Loam Upland
Sites have deeper soil horizons of sandy and loamy textures. These sites are not as dense in biomass and have lessened accumulations of nutrients due to their sandier nature.
F133BY004TX Loamy Claypan Upland
Soils have an abrupt textural change from loamy to clayey and are sometimes shallow to bedrock.
F133BY007TX Southern Sandy Loam Upland
Sites have deeper soil horizons of sandy and loamy textures. These sites are not as dense in biomass and have lessened accumulations of nutrients due to their sandier nature.
F133BY003TX Loamy Over Clayey Upland
Soils have clayey textures throughout their profiles.
Table 1. Dominant plant species
Tree (1) Pinus echinata
(2) Quercus falcataShrub (1) Callicarpa americana
Herbaceous (1) Dichanthelium acuminatum
Physiographic features
The ecological site is on broad flats to moderately sloping uplands. Slopes are predominantly 0 to 8 percent, but can range to 25 percent. Elevations range from 150 to 650 feet. The topography of the area includes summits and side slopes.
Table 2. Representative physiographic features
Landforms (1) Coastal plain > Interfluve
Runoff class Very low to medium Flooding frequency None Ponding frequency None Elevation 150 – 650 ft Slope 0 – 8 % Aspect Aspect is not a significant factor Table 3. Representative physiographic features (actual ranges)
Runoff class Not specified Flooding frequency Not specified Ponding frequency Not specified Elevation 0 ft Slope 0 – 25 % Climatic features
The climate of the Western Coastal Plain (MLRA 133B) is humid subtropical with hot summers and mild winters. Canadian air masses that move southward across Texas and Louisiana over the Gulf of Mexico in winter produce cool, cloudy, rainy weather with only rare cold waves that moderate in one or two days. Precipitation is distributed fairly even throughout the year and is most often in the form of slow and gentle rains.
Spring weather can be variable. March is relatively dry while thunderstorm activities increase in April and May. Occasional slow-moving thunderstorms or other weather disturbances may dump excessive amounts of precipitation on the area. Fall has moderate temperatures. Fall experiences an increase of precipitation and frequently has periods of mild, dry, sunny weather. Heavy rain may occur early in the fall because of tropical disturbances, which move westward from the gulf. Tropical storms are a threat to the area in the summer and fall but severe storms are rare. Prolonged droughts and snowfall are rare.
The total annual precipitation ranges from 39 inches in the western part of the region to 60 inches in the eastern part of the region. Approximately 50 percent of the rainfall occurs between April and September, which includes the growing season for most crops. Thunderstorms occur on about 50 days each year and most occur during the summer.
The average relative humidity in mid-afternoon is about 60 percent. Humidity is higher at night and the average at dawn is about 90 percent. The sun shines 70 percent of the time in summer and 50 percent in winter. The prevailing wind is from the south-southeast. Average wind-speed is highest at 11 miles per hour in spring.Table 4 Representative climatic features
Frost-free period (average) 220 days Freeze-free period (average) 250 days Precipitation total (average) 60 in BarLineFigure 1. Monthly precipitation range
BarLineFigure 2. Monthly average minimum and maximum temperature
Figure 3. Annual precipitation pattern
Figure 4 Annual average temperature pattern
Climate stations used
-
(1) CALHOUN RSCH STN [USC00161411], Calhoun, LA
-
(2) JENA 4 WSW [USC00164696], Trout, LA
-
(3) DEKALB [USC00412352], Simms, TX
-
(4) HUNTSVILLE [USC00414382], Huntsville, TX
-
(5) MAGNOLIA [USC00034548], Magnolia, AR
-
(6) SHERIDAN [USC00036562], Sheridan, AR
-
(7) CALION L&D [USC00031140], El Dorado, AR
-
(8) CARTHAGE [USC00411500], Carthage, TX
-
(9) GILMER 4 WNW [USC00413546], Gilmer, TX
-
(10) RUSK [USC00417841], Rusk, TX
-
(11) TOLEDO BEND DAM [USC00419068], Anacoco, TX
-
(12) MINDEN [USC00166244], Minden, LA
">Influencing water features
Due to the well-drained nature of the soils, water is typically not a factor to the sites.
Wetland description
Wetlands are not generally associated with the sites.
Soil features
The soils of this site are deep and characterized by loams throughout the soil profile, measured to 80 inches. The soils belong to the alfisol and ultisol orders and have well developed horizons. The Bowie series is a representative soil and consists of very deep, well drained, moderately slowly permeable soils that formed in loamy residuum from Southern Coastal Plain marine deposits. The series is classified as a fine-loamy, siliceous, semiactive, thermic Plinthic Paleudult. Not all soils within the ecological site will have the same taxonomic classification, but produce similar vegetative communities. Other soils are included within the ecological site and all are defined by deep fine-loamy and fine-silty control sections. The soils included are well drained or moderately well drained. Soils that are moderately well drained have a general increase in clay in the lower horizons. Besides the Bowie series, the Alto, Beauregard, Blevins, Diboll, Elrose, Eylau, Fuller, Gunter, Keatchie, Keithville, Kullit, Latex, Oakwood, Olla, Penning, Rigolette, Rogan, Ruston, Saffell, Sailes, Sawlit, Sawtown, Sawyer, Scottsville, Smithdale, Ulto, and Warnock are correlated to the Loamy Uplands.
Table 5. Representative soil features
Parent material (1) Marine deposits – sandstone and shale
Surface texture (1) Fine sandy loam
(2) Loam
Family particle size (1) Loamy
Drainage class Well drained to moderately well drained Permeability class Moderate to moderately slow Soil depth 80 in Surface fragment cover <=3" Not specified Surface fragment cover >3" Not specified Available water capacity
(0-40in)5.3 – 7.1 in Calcium carbonate equivalent
(0-40in)Not specified Electrical conductivity
(0-40in)0 – 2 mmhos/cm Sodium adsorption ratio
(0-40in)Not specified Soil reaction (1:1 water)
(0-40in)4.5 – 6.5 Subsurface fragment volume <=3"
(Depth not specified)0 – 10 % Subsurface fragment volume >3"
(Depth not specified)Not specified Ecological dynamics
The information in this ecological site description (ESD), including the state-and-transition model (STM), was developed using archeological and historical data, professional experience, and scientific studies. The information is representative of a complex set of plant communities. Not all scenarios or plants are included. Key indicator plants, animals, and ecological processes are described to inform land management decisions.
Introduction – Southern Arkansas, western Louisiana, and eastern Texas have been deemed the Pineywoods because of the vast expanse of pine trees. The region represents the western edge of the southern coniferous belt. Historically, the area was covered by pines with mixed hardwoods, sparse shrubs, and a diverse understory of grasses and forbs. Fire played a significant role in reducing the woody competition that generally out-competes the herbaceous understory layer. Fire suppression and land conversion have reduced the amount of historical communities in existence today.
Background – Prior to settlement by the Europeans, the reference state for the Loamy Uplands was a Shortleaf Pine/Red Oak (Pinus echinata/Quercus falcata) Woodland. Remnants of this presumed historic plant community still exist where natural conditions are replicated through conservation management techniques. Evidence of the reference state is found in accounts of early historic explorers to the area, historic forest and biological survey teams, as well as recent ecological studies in the last 30 years. The age of this woodland community varies, and has a diverse understory of grasses and forbs.
Settlement Management – As human settlement increased throughout the area, so did the increase in logging and grazing by domestic livestock. The logging became so extensive that by the 1930’s most of the region had been cut-over. Replanting trees to historic communities was not common and early foresters began planting loblolly pine (Pinus taeda) for its quick growth. As more people colonized they began suppressing fire, which allowed dense thickets of shrubs to replace the herbaceous understory.
Current Management and State – Today much of the remnant forest is gone, replaced by pine plantations, crops, and pastures. The areas that were not converted have been fire-suppressed so long that loblolly pine and fire intolerant hardwoods populate the overstory structure. Currently, U.S. Forest Service properties are the best place to view the remnant sites. Some private individuals have begun restoring communities through selective tree planting and retention of communities that remain. Other restoration efforts include mimicking natural-disturbance regimes through gap-phase regeneration on plantation sites.
Fire Regimes – Fire was a natural and important disturbance throughout the Western Gulf Plain. Fire occurred naturally from lightning strikes and by Native Americans for game movement. The reference community developed with a frequency of fire every 3 to 5 years. Fires usually occurred in early spring, removing senescent vegetation, recycling nutrients and minerals, and spurring new plant growth. Late summer fires occurred as well, but with a different community effect. Summer fires burned hotter and with more intensity, greatly suppressing the shrub canopy layer. The summer fires also shifted the ecological site transitional state by decreasing grass densities and increasing forb densities. The topography, fuel loads, and other conditions caused patchy burns throughout the region resulting in mosaic patterns of plant communities and a heterogeneous landscape.
Disturbance Regimes – Extreme weather events occur occasionally throughout the region. Tornados uproot trees and open canopies in the spring months. In the late summer and early fall, hurricanes or tropical depressions often make landfall, dumping excessive amounts of rain and toppling trees with high winds. Another cause of large canopy openings is the effects of the southern pine beetle (Dendroctonus frontalis). Starting in the late 1950’s, beetle outbreaks have occurred every 6 to 9 years (although a major attack has not occurred in some time), usually when the trees are stressed due to multiple environmental factors.
Plant Community Interactions – The deep loamy soils provide an excellent growing medium with very little restrictions. No special plant adaptions are necessary to persist in these soils, as compared to plants adapted to overly saturated (wetlands) or overly droughty (deep sands) conditions. Because of the high desirability for plants to grow on the ecological site, great competition exists between plants as they try and occupy space, rapidly taking advantage of sunlight. High amounts of biomass are produced and, left unchecked through management or natural frequencies of fire, the understory is quickly occupied by shrubs and understory saplings. Little bare ground exists in natural conditions and high amounts of litter accumulate. The sites typically support a basal area of trees from 80 to 120 square feet result in 65 to 85 percent canopy cover. Mature stands of pines will attain heights over 100 feet. The sites are characterized by high productivity of all plant types.State and transition model
More interactive model formats are also available. View Interactive Models
Click on state and transition labels to scroll to the respective textStates 1, 5 and 2 (additional transitions)
T1A - Fire suppression, no management T1B - Clearcut, site preparation, tree planting T1C - Clearcut, grass/crop planting R2A - Selective timber harvest, prescribed burns T2A - Fire suppression, no management T2B - Clearcut, site preparation, tree planting T2C - Clearcut, grass/crop planting R3A - Selective timber harvest, mid-story shrub control, prescribed burns T3A - Clearcut, site preparation, tree planting T3B - Clearcut, grass/crop planting R4A - Gap-phase regeneration or clearcut with tree planting T4A - Fire suppression, no management T4B - Clearcut, grass/crop planting R5A - Tree planting, mid-story shrub control, prescribed burns T5A - Clearcut, site preparation, tree planting State 1 submodel, plant communities
1.1A - Natural development between fire 1.2A - Fire (3-5 year interval) State 2 submodel, plant communities
State 3 submodel, plant communities
3.1A - Fire suppression, no management 3.2A - Clearcut or natural disturbance State 4 submodel, plant communities
State 5 submodel, plant communities
State 1
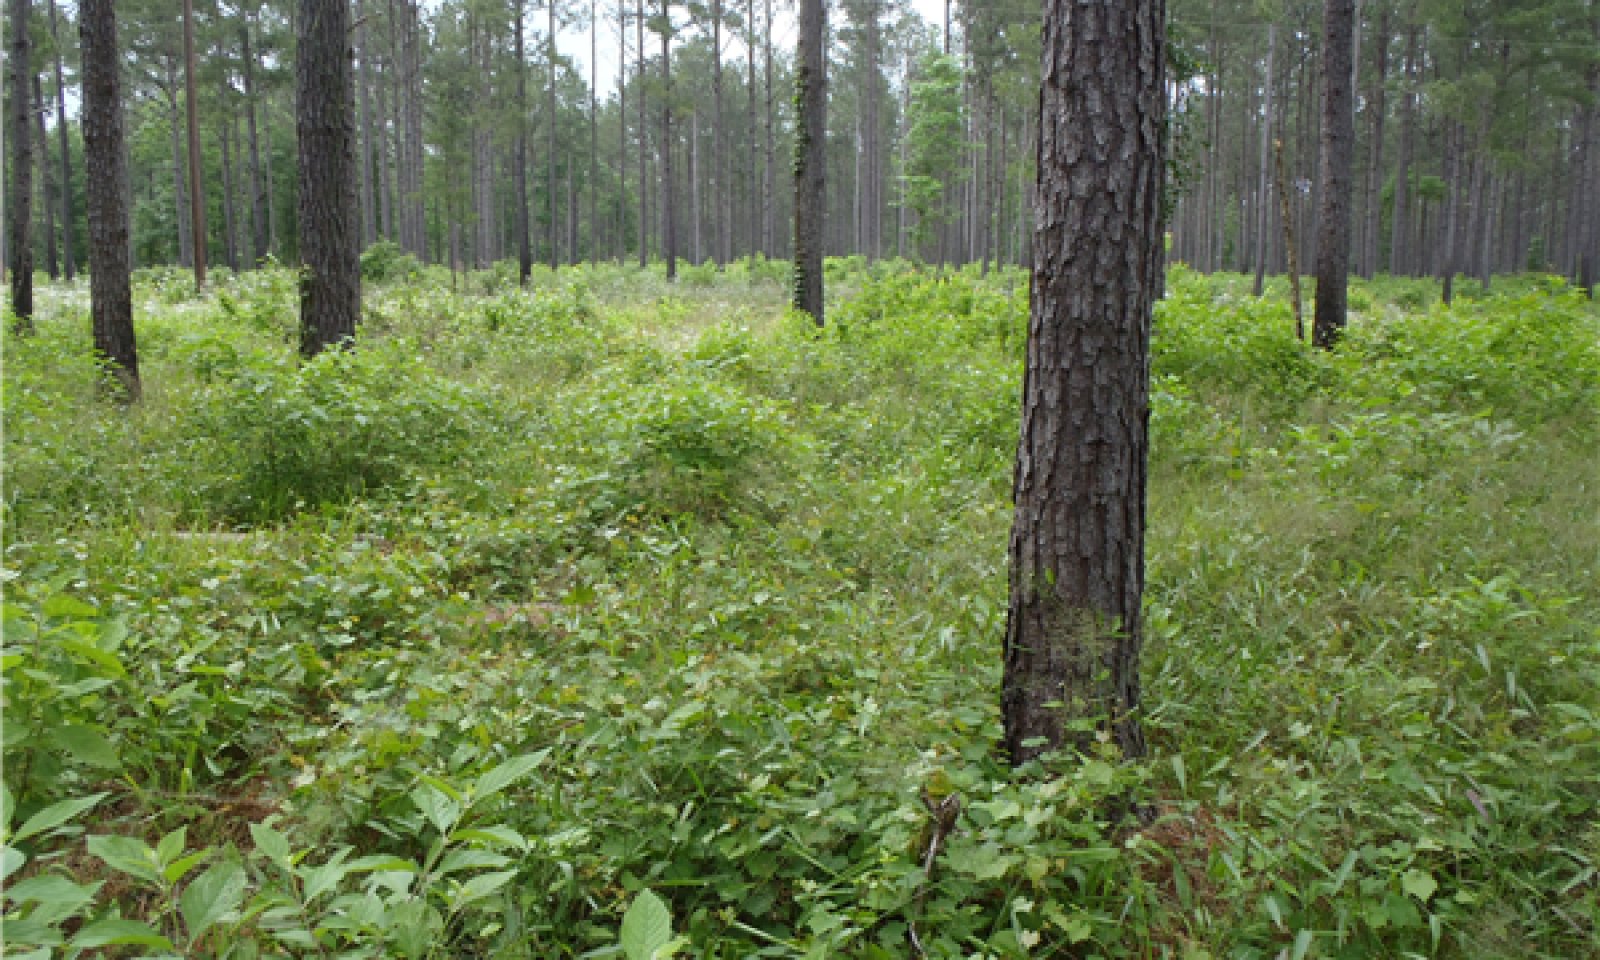
WoodlandThere are two communities in the Woodland State: Shortleaf Pine/Red Oak Woodland Community (1.1) and the Fire-primed Understory Community (1.2). State 1 has a moderate overstory cover (65 to 85 percent) of primarily shortleaf pine and red oak. The understory is heavily vegetated with grasses, forbs, and shrubs. In large part to the overall productivity of the site, high levels of biomass exist and very little bare ground. Plants grow quickly and search to colonize every useable space.
Natural disturbances of fires, lightning strikes, hurricanes (wind throw), ice events (rare), and beetle infestations aid in maintaining the uneven-age structure. Understory saplings are constantly growing and trying to occupy space, but the natural canopy spacing is kept intact by periodic fires ranging from 3 to 5 years. Representative basal areas range from 80 to 120 square feet per acre. The basal area and canopy cover generally increase at a parallel rate.
Community 1.1
Shortleaf Pine/Red Oak Woodland
The Shortleaf Pine/Red Oak Woodland (1.1) is the first community in State 1. Litter accumulation is moderate and understory vegetation is naturally dense. The overstory canopy is dominated by shortleaf pine and red oaks, and are usually in higher densities (total basal area) than the adjacently surrounding upland sites. The overstory canopy can also be interspersed with post oak (Quercus stellata), blackjack oak (Quercus marilandica), white oak (Quercus alba), and black hickory (Carya texana). The sites can be dominated by shortleaf pines, 100 percent canopy cover, but range as low as 60 percent with the oak and hickories comprising the rest of the overstory. Given time to mature, the sites produce tall, straight overstory pines which can reach heights above 100 feet.
This community is characterized by a dense ground layer with relatively no bare ground (less than 5 percent). Needleleaf rosette grass (Dichanthelium aciculare) is a highly abundant grass throughout the herbaceous understory. Other grasses seen, though not as dominant are longleaf woodoats (Chasmanthium sessiliflorum), variable panicgrass (Dichanthelium commutatum), and little bluestem (Schizachyrium scoparium). Forbs occupying the site include flowering spurge (Euphorbia corollata), hairy small-leaf ticktrefoil (Desmodium ciliare), and downy milkpea (Galactia volubilis). The shrub layer of the community is very conspicuous, containing numerous American beautyberry (Callicarpa americana) and yaupon (Ilex vomitoria).Table 6. Ground cover
Tree foliar cover 0-20% Shrub/vine/liana foliar cover 10-30% Grass/grasslike foliar cover 50-80% Forb foliar cover 10-30% Non-vascular plants 0% Biological crusts 0% Litter 20-50% Surface fragments >0.25" and <=3" 0% Surface fragments >3" 0% Bedrock 0% Water 0% Bare ground 0-10% Table 7. Canopy structure (% cover)
Height Above Ground (ft) Tree Shrub/Vine Grass/
GrasslikeForb <0.5 3-15% 5-50% 5-50% 1-20% >0.5 <= 1 1-15% 5-40% 25-50% 3-10% >1 <= 2 1-15% 10-40% 25-75% 3-5% >2 <= 4.5 1-10% 3-25% 5-50% 1-3% >4.5 <= 13 1-15% 1-10% – – >13 <= 40 3-70% – – – >40 <= 80 40-70% – – – >80 <= 120 10-70% – – – >120 – – – – Community 1.2
Fire-primed Understory
The Fire-primed Understory (1.2) phase has an increased accumulation of previous years’ growth of grasses, forbs, and shrubs, increasing the fuel load for fire. The shrub layer is on the verge of occupying the entire understory. Litter has built up, bare ground has lessened, and last year’s vegetative growth may still be seen on the ground layer. Under natural conditions, only fire tolerant saplings will grow into the overstory of State 1.
Pathway 1.1A
Community 1.1 to 1.2
Shortleaf Pine/Red Oak Woodland
Fire-primed UnderstoryThe driver for the community shift is time since the last fire. As post-fire time increases, so does the foliar cover by shrub species. As the grasses and forbs age, their senesced leaves increase fine fuel levels.
Pathway 1.2A
Community 1.2 to 1.1
Fire-primed Understory
Shortleaf Pine/Red Oak WoodlandThe driver for the community shift is fire. As fire burns through the understory, it encourages a diverse herbaceous layer while suppressing shrubs and tree seedlings.
State 2
Mixed Mid-storyOne community exists in the Mixed Mid-story (2) State: the Mixed Mid-story Community (2.1). This community represents a transitioning state between the historical climax community (State 1) and the steady-state of the Mixed Forest (State 3). Without fire or management, the understory is quickly overtaken by shrubs and saplings which shade out grasses and forbs. The site begins to lose diversity amongst vegetative types.
Community 2.1
Mixed Mid-story
Encroachment by fire intolerant species like sweetgum (Liquidambar stryacifula), red maple (Acer rubrum), and loblolly pine begin to grow in the mid-story. Added foliar cover by the shrubs and saplings reduce the light penetration to the lower growing herbaceous species. The shading reduces the diversity of the environment. Both factors combine to allow only the most dominant species to propagate. Longleaf woodoats, yaupon, and American beautyberry quickly become the most dominant understory vegetation.
Tree seedlings have grown higher and are beginning to escape the effects of fire and will become part of the overstory given more time with lack of management. The species present in the reference community will still be found, only in lesser amounts because the canopy cover is creating a better environment for fire-intolerant and shade-loving species.Table 8. Ground cover
Tree foliar cover 10-20% Shrub/vine/liana foliar cover 20-50% Grass/grasslike foliar cover 10-30% Forb foliar cover 0-10% Non-vascular plants 0% Biological crusts 0% Litter 40-80% Surface fragments >0.25" and <=3" 0% Surface fragments >3" 0% Bedrock 0% Water 0% Bare ground 0-0% Table 9. Canopy structure (% cover)
Height Above Ground (ft) Tree Shrub/Vine Grass/
GrasslikeForb <0.5 1-5% 3-35% 1-5% 1-5% >0.5 <= 1 1-15% 3-50% 3-25% 1-20% >1 <= 2 1-15% 3-50% 3-10% 1-15% >2 <= 4.5 3-10% 10-50% 0-5% 0-5% >4.5 <= 13 5-50% 20-75% – – >13 <= 40 15-70% 5-15% – – >40 <= 80 40-70% – – – >80 <= 120 10-70% – – – >120 – – – – State 3
Mixed ForestThere are two communities in the Mixed Forest State: the Mixed Forest Community (3.1) and the No Overstory Community (3.2). The Mixed Forest community represents a steady-state for the Loamy Uplands. Without fire or management, the site begins to lose the vegetative indicators that make the ecological site unique. The plant communities will stay constant without disturbance or intervention.
Community 3.1
Dense Mixed Forest
The Dense Mixed Forest Community has crossed a threshold in which normal environmental events cannot transition the community back to the reference state (State 1). The crossing of this threshold represents a closure in the overstory canopy, which limits the productivity of the ground layer. The canopy closure is filled in by any sapling that could gain a foothold in an earlier state. Water oak (Quercus nigra), willow oak (Quercus phellows), red maple, and sweetgum are especially common invaders into the community. The limited ground layer does not provide enough fuel to harbor a burn with the intensity found in State 1. Hardwood litter usually covers the ground, also retarding fire in this state.
The understory plant layer only contains remnants of the reference community and possibly no reference community indicator species. Sparse amounts of shade tolerant species, like longleaf woodoats, poison ivy, and greenbriers (Smilax sp.) may be the only ground-layer species. Some shrubs may still persist, but not as dense as found in States 1 or 2. Because the site lacks the diversity of the reference state, the wildlife diversity will be limited to generalist species, species that require a closed canopy, and those species seeking refuge.
This ecological state requires management to restore the reference community. Selective timber harvest to reduce the basal area is the first step to allow the understory to return. More frequent than natural prescribed burns (1 to 3 years) will help suppress the hardwood regeneration, but only after understory fuel levels are adequate. Intense summer fires may also be required. The suppression of unwanted overstory seedlings will allow the reference plant community to establish.Table 10. Ground cover
Tree foliar cover 0-20% Shrub/vine/liana foliar cover 10-20% Grass/grasslike foliar cover 0-10% Forb foliar cover 0-10% Non-vascular plants 0% Biological crusts 0% Litter 50-90% Surface fragments >0.25" and <=3" 0% Surface fragments >3" 0% Bedrock 0% Water 0% Bare ground 0-10% Table 11. Canopy structure (% cover)
Height Above Ground (ft) Tree Shrub/Vine Grass/
GrasslikeForb <0.5 0-5% 5-15% 0-10% 0-10% >0.5 <= 1 0-5% 5-10% 0-5% 0-5% >1 <= 2 0-5% 5-10% 0-5% 0-5% >2 <= 4.5 10-20% 5-15% 0-3% 0-3% >4.5 <= 13 10-35% 0-5% – – >13 <= 40 50-85% 0-5% – – >40 <= 80 65-95% – – – >80 <= 120 10-85% – – – >120 – – – – Community 3.2
No Overstory
The No Overstory Community (3.2) is a result of natural environmental disturbances or clearcutting the overstory trees. The plant communities from State 1 may return initially, but if the natural disturbance of fire or overstory stand management do not occur, the site will transition into a Mixed Forest Community (3.1)
Pathway 3.1A
Community 3.1 to 3.2
Dense Mixed Forest
No OverstoryThe driver for the shift is a natural disaster or clearcut situation. Examples of natural disasters include hurricane, wind throw, tornadoes, severe ice storms, or severe fires. Following timber harvest by clearcut, little of the reference state vegetation remains. Primary vegetative succession occurs post clearcut.
Pathway 3.2A
Community 3.2 to 3.1
No Overstory
Dense Mixed ForestThe driver for the community shift is time and lack of fire. Shrubs and tree saplings will not be suppressed without return fire intervals.
State 4
PlantationThe Plantation State is a result of conversion activities. The landowner has maximized silviculture production by planting a monoculture of tree species.
Community 4.1
Pine/Hardwood Plantation
In the immediate years following the initial tree planting, the understory community will resemble the reference state (State 1). During this early growth period, the landowner will typically remove unwanted hardwoods and mow the herbaceous plants to reduce competition with the planted pine trees. As the overstory canopy closes, less understory management is required due to sunlight restrictions at the ground layer.
State 5
Pasture and CroplandThe Pasture and Cropland State is a result of conversion activities. The landowner has maximized agriculture production by planting a monoculture of introduced grass species or agricultural row crops.
Community 5.1
Planted Pasture and Row Crop
Typical introduced pasture grass species include bahiagrass (Paspalum notatum) and different varieties of bermudagrass (Cynodon dactylon). The grasses are grown for livestock production through direct grazing or baling hay for later use. Agricultural row crops are grown for food and fiber production. Many farmers use herbicides to reduce unwanted plant competition which yields a plant community unrepresentative of State 1 or subsequent vegetative states.
Transition T1A
State 1 to 2The transition from State 1 to State 2 is a result of time and long periods (greater than 5 years) of no fire and/or forest management practices. Without fire to suppress tree seedlings, biomass and diversity is lost from the grass and forb layers of the system.
Transition T1B
State 1 to 4The transition is due to the land manager maximizing silviculture potential. Merchantable timber is harvested by clearcut, then the site is prepared and planted to a monoculture of trees.
Transition T1C
State 1 to 5The transition is due to the land manager maximizing agricultural production. Merchantable timber is harvested by clearcut, then the site is prepared and planted to either an improved grass or row crops.
Restoration pathway R2A
State 2 to 1The driver for restoration is fire and understory shrub and tree suppression. Enough fuel is still left in this community to carry a fire through the site. More frequent burns (1 to 2 years) may be required to suppress the woody vegetation. Timber stand improvement practices should be used on undesirables and some species may have escaped the effective fire height and will have to be selectively cut down to return to the reference state.
Transition T2A
State 2 to 3The transition from a Mixed Mid-story (State 2) to the Mixed Forest (State 3) is a result of time and long periods (greater than 20 years) of no fire and/or no forest management. Without fire to suppress fire intolerant trees, they become part of the overstory canopy. The overstory is so saturated that the understory herbaceous layer is almost non-existent. As the overstory canopy closes, the under and mid-story are occupied only by shade tolerant species.
Transition T2B
State 2 to 4The transition is due to the land manager maximizing silviculture potential. Merchantable timber is harvested by clearcut, then the site is prepared and planted to a monoculture of trees.
Transition T2C
State 2 to 5The transition is due to the land manager maximizing agricultural production. Merchantable timber is harvested by clearcut, then the site is prepared and planted to either an improved grass or row crops.
Restoration pathway R3A
State 3 to 1Restoration of this community to the reference state begins with a selective timber harvest. Removing unwanted trees opens up the canopy, allowing sunlight penetration to the ground. Years of overstory growth have limited the fuel necessary to have an effective fire. Time will be needed to encourage understory growth. Once the herbaceous layer has established, more frequent than natural burns (1 to 3 years) may be required to suppress the woody vegetation.
Transition T3A
State 3 to 4The transition is due to the land manager maximizing silviculture potential. Merchantable timber is harvested by clearcut, then the site is prepared and planted to a monoculture of pine trees.
Transition T3B
State 3 to 5The transition is due to the land manager maximizing agricultural production. Merchantable timber is harvested by clearcut, then the site is prepared and planted to either an improved grass or row crops.
Restoration pathway R4A
State 4 to 1This restoration pathway can be accomplished in different ways depending on goals. One option is to create canopy openings by reducing the number of overstory trees. Then, restore the resulting canopy gaps with species from the reference state’s (State 1) understory. Restoring the understory may include planting shortleaf pine and oak species found in the reference state. This method keeps the woodland structure intact and slowly changes the species composition.
Transition T4A
State 4 to 3This community transition is caused by neglecting the plantation understory. Without fire, mowing, or herbicides, unwanted understory saplings can begin to grow into the overstory.
Transition T4B
State 4 to 5The transition is due to the land manager maximizing agricultural production. Merchantable timber is harvested by clearcut, then the site is prepared and planted to either an improved grass or row crops.
Restoration pathway R5A
State 5 to 1This restoration path can be accomplished by planting a mix of oak and pine species to their natural frequencies (see State 1 – Overstory Composition table), trying to attain a 65 to 85 percent mature overstory canopy. Management will be required to control unwanted species by burning, mowing, and/or herbicides. Controlling introduced pasture grasses is difficult, with complete control likely not attainable. The herbaceous understory will take time to develop, but this process can be expedited if adapted plant material seed is available.
Transition T5A
State 5 to 4The transition is due to the land manager maximizing silviculture production. The site is prepared and planted to a monoculture of trees.
Additional community tables
Table 12. Community 1.1 plant community composition
Group Common name Symbol Scientific name Annual production () Foliar cover (%) Table 13. Community 1.1 forest overstory composition
Common name Symbol Scientific name Nativity Height ft Canopy cover (%) Diameter in Basal area (square ft/acre) Treeshortleaf pine PIEC2 Pinus echinata Native – 60-100 – 0 southern red oak QUFA Quercus falcata Native – 0-30 – 0 blackjack oak QUMA3 Quercus marilandica Native – 0-20 – 0 post oak QUST Quercus stellata Native – 0-10 – 0 black hickory CATE9 Carya texana Native – 0-5 – 0 Table 14. Community 1.1 forest understory composition
Common name Symbol Scientific name Nativity Height (ft) Canopy cover (%) Grass/grass-like (Graminoids)needleleaf rosette grass DIAC Dichanthelium aciculare Native – 10–50 variable panicgrass DICO2 Dichanthelium commutatum Native – 5–25 little bluestem SCSC Schizachyrium scoparium Native – 0–20 longleaf woodoats CHSE2 Chasmanthium sessiliflorum Native – 5–20 Forb/Herbeastern poison ivy TORA2 Toxicodendron radicans Native – 5–15 dogfennel EUCA5 Eupatorium capillifolium Native – 0–7 flowering spurge EUCO10 Euphorbia corollata Native – 1–5 Nuttall's wild indigo BANU2 Baptisia nuttalliana Native – 0–5 St. Andrew's cross HYHY Hypericum hypericoides Native – 0–5 hairy small-leaf ticktrefoil DECI Desmodium ciliare Native – 1–5 slender yellow woodsorrel OXDI2 Oxalis dillenii Native – 0–3 whitemouth dayflower COER Commelina erecta Native – 0–3 downy milkpea GAVO Galactia volubilis Native – 0–3 nettleleaf noseburn TRUR2 Tragia urticifolia Native – 0–1 Fern/fern allywestern brackenfern PTAQ Pteridium aquilinum Native – 0–5 Shrub/SubshrubAmerican beautyberry CAAM2 Callicarpa americana Native – 20–65 yaupon ILVO Ilex vomitoria Native – 10–50 sawtooth blackberry RUAR2 Rubus argutus Native – 3–15 parsley hawthorn CRMA5 Crataegus marshallii Native – 0–10 farkleberry VAAR Vaccinium arboreum Native – 0–5 rusty blackhaw VIRU Viburnum rufidulum Native – 0–5 Vine/Lianasummer grape VIAE Vitis aestivalis Native – 5–15 Virginia creeper PAQU2 Parthenocissus quinquefolia Native – 5–15 saw greenbrier SMBO2 Smilax bona-nox Native – 1–5 cat greenbrier SMGL Smilax glauca Native – 1–5 laurel greenbrier SMLA Smilax laurifolia Native – 1–5 Table 15. Community 1.2 plant community composition
Group Common name Symbol Scientific name Annual production () Foliar cover (%) Table 16. Community 2.1 plant community composition
Group Common name Symbol Scientific name Annual production () Foliar cover (%) Table 17. Community 3.1 plant community composition
Group Common name Symbol Scientific name Annual production () Foliar cover (%) Table 18. Community 3.2 plant community composition
Group Common name Symbol Scientific name Annual production () Foliar cover (%) Table 19. Community 4.1 plant community composition
Group Common name Symbol Scientific name Annual production () Foliar cover (%) Table 20. Community 5.1 plant community composition
Group Common name Symbol Scientific name Annual production () Foliar cover (%) Interpretations
Animal community
Turkey and quail will utilize the site to some degree, but in combination with other sites. The grass layer is well-suited to provide nesting habitat, and the presence of mature oaks will provide roosting areas. As long as the canopy is open, such as those found in the reference conditions, a diverse forb layer will create an abundance of insects. The insects provide high-quality protein in their diet, especially for newly hatched chicks.
Deer will utilize the site as the community matures and browse the saplings and desired shrubs. As with most deer habitat, deer utilize a large array of ecological sites throughout their life. Well-managed browse, cover, and natural food sources provide the best habitat.
Migratory song birds and woodpeckers use the site as well. Locations with fire and snags will typically have a higher diversity of birds. Fruits from the shrub species (American beautyberry and yaupon) are readily consumed by birds as well.
Grazing animals primarily use grasses as their food source. While grasses can be in abundance on the Loamy Uplands, the sites will have to be specifically managed for grazing to produce enough biomass. Reduction of basal area, below 60 square feet per acre, will create more openings for light to penetrate to the ground layer, therefore allowing more biomass to be produced.Hydrological functions
Due to the texture of the soils, the Loamy Uplands are typically well drained and have little runoff, therefore absorbing most of the rainfall. Hydrology is basically absent from these upland soils unless excessive amounts of precipitation occur.
Recreational uses
Much of this land is leased for deer hunting purposes.
Wood products
These deep soils are on uplands and have a high potential for woodland management, both pine and hardwood. The 50-year site index for loblolly pine averages 90 feet (60 feet on a 25-year curve), but ranges from 85 to 100 feet. The yield from an unmanaged, natural stand of loblolly pine, over a 50-year period, is approximately 330 board feet (Doyle Rule), 2.64 tons, or 129 cubic feet per acre per year. Management can substantially increase this yield. The only problem associated with these soils is the somewhat limited access and equipment operability during wet periods when rutting can be a moderate concern. Short-term restrictions may be necessary at these times and harvesting and other operations may need to be suspended during such periods when rutting can be severe. Site preparation operations should be limited to the dry months and planting should be planned for the drier part of the planting season. The use of herbicides for site preparation should take into consideration the slow drainage and high water table on these soils. Applications should not be made during wet periods.
Other products
Fruits, nuts, acorns, and seeds of the trees, shrubs, vines, and herbaceous plants are used for food, jellies, and jam.
Supporting information
Inventory data references
These site descriptions were developed as part a Provisional Ecological Site project using historic soil survey manuscripts, available site descriptions, and low intensity field traverse sampling. Future work to validate the information is needed. This will include field activities to collect low, medium, and high-intensity sampling, soil correlations, and analysis of that data. A final field review, peer review, quality control, and quality assurance review of the will be needed to produce the final document.
Type locality
Location 1: Shelby County, TX Latitude 31° 45′ 13″ Longitude -93° 58′ 24″ General legal description Sabine National Forest Other references
Ajilvsgi, G. 2003. Wildflowers of Texas. Revised edition. Shearer Publishing, Fredericksburg, TX.
Ajilvsgi, G. 1979. Wildflowers of the Big Thicket. Texas A&M University Press, College Station, TX.
Allen, J. A., B. D. Keeland, J. A. Stanturf, and A. F. Kennedy Jr. 2001. A guide to bottomland hardwood restoration. Technical report, USGS/BRD/ITR-2000-0011.
Bray, W. L. 1904. Forest resources of Texas. Bureau of Forestry Bulletin 47, Government Printing Office, Washington D.C.
Diggs, G. M., B. L. Lipscomb, M. D. Reed, and R. J. O’Kennon. 2006. Illustrated flora of East Texas. Second edition. Botanical Research Institute of Texas & Austin College, Fort Worth, TX.
Jones, S. D., J. K. Wipff, and P. M. Montgomery. 1997. Vascular plants of Texas: a comprehensive checklist including synonymy, bibliography, and index. University of Texas Press, Austin.
NatureServe. 2002. International classification of ecological communities: Terrestrial vegetation of the United States. National forests in Texas final report. NatureServe, Arlington, VA.
Nixon, E. S. 2000. Trees, shrubs & woody vines of East Texas. Second edition. Bruce Lyndon Cunningham Productions, Nacogdoches, TX.
Picket, S. T. and P. S. White. 1985. The ecology of natural disturbance and patch dynamics. Academic Press, Orlando, FL.
Randall, J. M., and J. Marinelli. 1996. Invasive plants: weeds of the global garden. Volume 149. Brooklyn Botanic Garden, Brooklyn, NY.
Roberts, O. M. 1881. A description of Texas, its advantages and resources with some account of their development past, present and future. Gilbert Book Company, Saint Louis, MO.
Soil Survey Staff, Natural Resources Conservation Service, United States Department of Agriculture. Soil Survey Geographic (SSURGO) Database.
Stanturf, J. A., S. H. Schoenholtz, C. J. Schweitzer, and J. P. Shepard. 2001. Achieving restoration success: Myths in bottomland hardwood forests. Restoration Ecology, 9:189-200.
Stringham, T. K., W. C. Krueger, and P. L. Shaver. 2003. State and transition modeling: An ecological process approach. Journal of Range Management 56:106-113.
Truett, J. C. 1984. Land of bears and honey: A natural history of East Texas. The University of Texas Press, Austin, TX.
U.S. Army Corps of Engineers. 2010. Regional supplement to the Corps of Engineers Wetland Delineation Manual: Atlantic and Gulf Coastal Plain Region (Version 2.0). U.S. Army Corps of Engineers, Engineer Research and Development Center, Environmental Laboratory ERDC/EL TR-10-20.
USDA-NRCS Ag Handbook 296 (2006).
Van Kley, J. E., R. L. Turner, L. S. Smith, and R. E. Evans. 2007. Ecological classification system for the national forests and adjacent areas of the West Gulf Coastal Plain. Second approximation. Stephen F. Austin University and The Nature Conservancy, Nacogdoches, TX.
Vines, R. A. 1960. Trees, shrubs, and woody vines of the Southwest. University of Texas Press, Austin, TX.
Watson, G. E. 2006. Big Thicket Plant Ecology. Third Edition. University of North Texas Press, Denton, TX.Contributors
Tyson Hart
Approval
Bryan Christensen, 12/13/2023
Rangeland health reference sheet
Interpreting Indicators of Rangeland Health is a qualitative assessment protocol used to determine ecosystem condition based on benchmark characteristics described in the Reference Sheet. A suite of 17 (or more) indicators are typically considered in an assessment. The ecological site(s) representative of an assessment location must be known prior to applying the protocol and must be verified based on soils and climate. Current plant community cannot be used to identify the ecological site.
Author(s)/participant(s) Contact for lead author Date 09/03/2021 Approved by Approval date Composition (Indicators 10 and 12) based on Annual Production Indicators
-
Number and extent of rills:
-
Presence of water flow patterns:
-
Number and height of erosional pedestals or terracettes:
-
Bare ground from Ecological Site Description or other studies (rock, litter, lichen, moss, plant canopy are not bare ground):
-
Number of gullies and erosion associated with gullies:
-
Extent of wind scoured, blowouts and/or depositional areas:
-
Amount of litter movement (describe size and distance expected to travel):
-
Soil surface (top few mm) resistance to erosion (stability values are averages - most sites will show a range of values):
-
Soil surface structure and SOM content (include type of structure and A-horizon color and thickness):
-
Effect of community phase composition (relative proportion of different functional groups) and spatial distribution on infiltration and runoff:
-
Presence and thickness of compaction layer (usually none; describe soil profile features which may be mistaken for compaction on this site):
-
Functional/Structural Groups (list in order of descending dominance by above-ground annual-production or live foliar cover using symbols: >>, >, = to indicate much greater than, greater than, and equal to):
Dominant:
Sub-dominant:
Other:
Additional:
-
Amount of plant mortality and decadence (include which functional groups are expected to show mortality or decadence):
-
Average percent litter cover (%) and depth ( in):
-
Expected annual annual-production (this is TOTAL above-ground annual-production, not just forage annual-production):
-
Potential invasive (including noxious) species (native and non-native). List species which BOTH characterize degraded states and have the potential to become a dominant or co-dominant species on the ecological site if their future establishment and growth is not actively controlled by management interventions. Species that become dominant for only one to several years (e.g., short-term response to drought or wildfire) are not invasive plants. Note that unlike other indicators, we are describing what is NOT expected in the reference state for the ecological site:
-
Perennial plant reproductive capability:
Print Options
Sections
Font
AAAAOther
PrintThe Ecosystem Dynamics Interpretive Tool is an information system framework developed by the USDA-ARS Jornada Experimental Range, USDA Natural Resources Conservation Service, and New Mexico State University.
Accessibility statement


