
Natural Resources
Conservation Service
Ecological site F127XY002WV
Spodic Intergrade Shale Upland Hardwood And Conifer Forest
Last updated: 9/27/2024
Accessed: 08/18/2026
-
Search


Major Land Resource Area or ecological site by name and/or ID.
PreviousSectionsNextGeneral information
Approved. An approved ecological site description has undergone quality control and quality assurance review. It contains a working state and transition model, enough information to identify the ecological site, and full documentation for all ecosystem states contained in the state and transition model.
Click to explore map
Figure 1. Mapped extent
Areas shown in blue indicate the maximum mapped extent of this ecological site. Other ecological sites likely occur within the highlighted areas. It is also possible for this ecological site to occur outside of highlighted areas if detailed soil survey has not been completed or recently updated.
MLRA notes
Major Land Resource Area (MLRA): 127X–Eastern Allegheny Plateau and Mountains
The Spodic Shale Upland Hardwood and Conifer Forest ecological site occupies the Allegheny Mountain Section of the Appalachian Highlands of the Appalachian Plateau Province. The deeply dissected plateau in this area terminates in a high escarpment, the Allegheny Front, in the eastern part of the area. Steep slopes are dominant, but level to gently rolling plateau remnants are conspicuous in the northern part of the area. The area is dominantly forest containing large blocks of state forest, game lands, and national forest. Less than one-tenth of the MLRA consists of urban areas.
Classification relationships
USFS Northern high Alleghany mountain subsection
USNVC M014. Northern Mesic Hardwood & Conifer Forest
Ecological site concept
The ecological site overstory canopy is dominated by hardwoods with a canopy cover of red spruce and/or eastern hemlock less than 30%. The climate is cool and moist with a frigid soil temperature regime and perudic soil moisture regime. This upland site exists on every geomorphic position from the summit to the lower backslope and can exist on any aspect. The geology of this site consists of Devonian inter-bedded sandstone and shale that has low pH and is relatively base poor. Soils of this site show evidence of podzolization and will classify as Spodic Dystrudepts. The nature of the organic O horizons (mull or moder) favors hardwood regeneration.
Associated sites
F127XY001WV Spodic Shale Upland Conifer Forest
Table 1. Dominant plant species
Tree (1) Acer rubrum
(2) Picea rubensShrub Not specified
Herbaceous (1) Dryopteris intermedia
Physiographic features
At the highest elevations in the State of West Virginia, this ecological site is generally composed of mountain ranges oriented in a northeast-southwest direction, with deep valleys intervening. The deeply dissected plateau terminates in the eastern part in a high escarpment known as the Allegheny Front. Steep slopes are dominant but level to gently rolling plateau remnants are present. Water tables in this ecological site are deeper than 60 inches, and the site both receives and generates runoff.
Table 2. Representative physiographic features
Landforms (1) Interfluve
(2) Mountain slope
(3) Mountain
Elevation 2631 – 4583 ft Slope 3 – 80 % Water table depth 51 – 99 in Aspect Aspect is not a significant factor Climatic features
Mean annual air temperature of this ecological site is 46 degrees F. On many days in a normal winter there is no snow cover, but some years the ground is snow covered all winter. Cloudiness is more common than clear skies. About 81 days per year have clear skies, 196 days are cloudy, and the rest partly cloudy. In valleys, fog is prevalent in summer and fall. Rainfall is heaviest in summer and lowest in the fall. During the growing season, rainfall often exceeds potential evapo-transpiration. Long dry periods seldom occur. Westerly winds prevail at the higher elevations in all months of the year except August when southwesterly winds prevail. Damaging windstorms are rare.
Table 3 Representative climatic features
Frost-free period (average) 120 days Freeze-free period (average) 150 days Precipitation total (average) 50 in BarLineFigure 2. Monthly precipitation range
BarLineFigure 3. Monthly average minimum and maximum temperature
Figure 4. Annual precipitation pattern
Figure 5 Annual average temperature pattern
">Influencing water features
This site is not directly influenced by water from wetland or stream.<br />
Soil features
The soils of this site are brown, moderately deep to deep silt loams and loams that are represented by the Spodic Dystrudept soil great group. The main process in the formation of a Spodic Dystrudept is podzolization. Podzolization is a complex process in which organic material and soluble iron and aluminum are leached from the A horizon to the B horizon. These soils are relatively infertile, but more fertile than Spodosols. Sandstone and shale fragments and rocks sometime occur in the profile or outcrop on the soil surface, but not to the extent that they impair the production of native vegetation. Plant-soil moisture relationships are good. In best condition, rills, gullies, wind scoured areas, pedestals, and soil compaction layers are not present on the site.

Figure 6. Mandy Soil
Table 4. Representative soil features
Parent material (1) Residuum – acid shale
(2) Colluvium – sandstone and shale
(3) Solifluction deposits – sandstone and siltstone
Surface texture (1) Channery silt loam
(2) Channery loam
Family particle size (1) Loamy
Drainage class Well drained Permeability class Moderate Soil depth 20 – 60 in Surface fragment cover <=3" 0 – 5 % Surface fragment cover >3" 0 – 3 % Available water capacity
(0-40in)2.1 – 5.25 in Calcium carbonate equivalent
(0-40in)Not specified Electrical conductivity
(0-40in)Not specified Sodium adsorption ratio
(0-40in)Not specified Soil reaction (1:1 water)
(0-40in)4 – 5 Subsurface fragment volume <=3"
(Depth not specified)15 – 60 % Subsurface fragment volume >3"
(Depth not specified)5 – 40 % Ecological dynamics
The information contained in the State and Transition Model (STM) and the Ecological Site Description was developed using archeological and historical data, professional experience, and scientific studies. The information presented is representative of a very complex set of plant communities. Not all scenarios or plants are included. Key indicator plants, animals and ecological processes are described to inform land management decisions.
The historic plant community composition of this site was relatively stable. American beech, red spruce, and hemlock are long-lived and very shade tolerant species. Red maple and sweet and yellow birch are less long lived. Natural disturbances in this community are characterized by windthrow of individual trees. Stand-replacing lightning-ignited fires may affect large patch sizes but occur rarely, at 300 to 1,000-year intervals; large-scale wind events are likely at more frequent intervals of 100 to 200 years (Gorman 2007). Beech bark disease an invasive disease has altered the plant community.
Beech bark disease (BBD), a complex affecting American beech, includes both insect and fungal components. The disease passes through three phases: the initial scale front phase, the second killing front phase, and the final aftermath forest phase. During the initial phase, the exotic scale insect disperses through the forest, causing scale-induced alterations to patches of bark. The killing front phase begins 1 to 19 years after the arrival of the scale. Throughout this phase, the scale-modified bark is killed and colonized by species of Neonectria, rendering the dead tissues vulnerable to additional decaying fungi. The resulting beech snap and mortality levels may reach 50 percent in 5 years. The final aftermath forest phase results in an ecological accommodation to the disease, resulting in either a change in species composition or the death of re-emergent beech. The genetically identical stump sprouts and root suckers (beech brush), which appear following the initial BBD deaths die in a second wave of BBD.
Historic accounts indicate that on high elevation slopes where soils are deeper and/or slightly more fertile, a mixture of hardwoods and spruce predominated (Hopkins 1899, Brooks 1910, Allard and Leonard 1952).
Spodosols develop within cool, humid climates beneath conifers and thick snow packs (Ciolkosz et al. 1989; Ugolini et al. 1990; Schaetzl and Isard 1996) Research verified Spodosol occurrence in West Virginia (Stanley and Ciolkosz 1981. Researchers have also studied Spodosols at points southward along the Appalachian Chain (Lietzke and McGuire 1987). Soils with spodic tendencies in the southern Appalachians have been recognized as early as the 1980s, leading to proposals for spodic subgroups for Dystrochrepts and Haplumbrepts (Lietzke and McGuire 1987) The current version of Soil Taxonomy (2010) reconizes these soils as Spodic Dystrudepts.
Without continuing conifer cover, the podzolization process may cease and actually reverses itself (depodzolization), causing spodic markers to disassociate overtime (Barrett and Schaetzl 1998). The shift in vegetation causes the breakdown of the coniferous litter layer, release of iron and manganese from B horizons, and increase of calcium from deciduous litter accrual (Lundstrom et al. 2000). Moreover, soil displacement (erosion) and loss of surface organic matter (O horizon) associated with past cutting and burning may have further deteriorated spodic soil characteristics.
Humus terminology used throughout the text: Mor is a type of humus, which occur largely in coniferous forest soils and the moorlands soils. This humus arise under conditions of low-biological activity in soil. The mineralization of organic matter proceeds slowly and creates layers, which maintain a structure of vegetative material. Mull is a type of humus characteristic of hardwood forests. Mull is a well humified organic matter, which is produce in very biologically active Moder is a transitional form of humus between mull and mor. The organic horizons with moder humus consist of low-thickness litter.
A State and Transition Model for the site follows this narrative. Thorough descriptions of each state, transition, plant community, and pathway follow the model. Experts base this model on available experimental research, field observations, professional consensus, and interpretations. It is likely to change as knowledge increases.
Clearcutting of mixed hardwood and conifer in the time period 1880-1920 removed a majority of the overstory, and destroyed much of the organic soil horizon and seed bank within it due to logging practices and fires common during the era. Logs where skidded across the soil and slope on cable strung from the summit of the slope to the valley floor; in some instances slash fires occurred at these sites. The new conditions exposed large areas of mineral soil that allowed the invasion of these sites by hardwood trees, especially species with heavy seed rain and seeds that spread rapidly and over long distance due to transport by wind and birds such as shade tolerant American beech and black cherry . Many areas still had remnant midstory spruce trees present and small understory spruce trees. Seeds of red spruce and hemlock typically travel a maximum of 200 meters. Red spruce and hemlock are able to re-establish in the sites canopy if a few trees remain, but the process may take hundreds of years without restoration efforts such as timber harvest, thinning, and/or herbicide application to release suppressed understory conifers. Once a trajectory of conifer co-dominate overstory is set the site will maintain a sustainable community dynamic.
The appearance of the logged states depends on tree dominance; for example both share a common dominant (or subdominant ) tree- red maple and the occurrence of subdominant red spruce and eastern hemlock in the understory. Red maple has a large seed rain, is quick to establish, shade-tolerant and is common throughout the range of this ecological site. The division between the two logged states is based upon the occurrence of subdominant American beech or black cherry in the respective states. Sites with a history of soil erosion exposing extensive areas of mineral soil or burning often have higher overstory canopy cover of black cherry. Sites with relatively less disturbance have higher overstory canopy cover occurrence of beech.
The logged and burned states are areas that experienced intense logging slash fires caused by railroad sparks and negligent fire management. One site scenario may represent a situation of a burned conifer forest on a Spodosol that was sent on an entirely new vegetation trajectory and an entirely different soil was formed through depozolization. An alternative scenario is a site with weakly expressed podzolization (spodic dystrudept). The division between the two states is based upon the occurrence of subdominant American beech or black cherry in the respective states. Like the logged states the vegetative community develops in response to the severity of disturbance.
Many of severely burned locations and abandoned marginal farmland were re-vegetated with conifer plantations during the depression until World War II by the Civilian Conservation Corps (CCC) and the United States Forest Service (USFS). These areas were planted to prevent soil erosion and to provide timber products and wildlife habitat. The current condition of these areas is a plantation of mature even aged Norway spruce and occasional plantations of red and/or white pine timber. These species are not endemic to the ecological site area and have created an artificial ecological condition.
Plant communities will differ across the MLRA because of the naturally occurring variability in weather, soils, and aspect. The Reference Plant Community is not necessarily the management goal. The biological processes on this site are complex. Therefore, representative values are presented in a land management context. The species lists are representative and are not botanical descriptions of all species occurring, or potentially occurring, on this site. They are not intended to cover every situation or the full range of conditions, species, and responses for the site.
The following diagram suggests some pathways that the vegetation on this site might take. There may be other states not shown on the diagram. This information is intended to show what might happen in a given set of circumstances. It does not mean that this would happen the same way in every instance. Local professional guidance should always be sought before pursuing a treatment scenario.State and transition model
Custom diagramStandard diagram
Figure 7. Spodic Intergrade Shale Upland Hardwood And Conife

Figure 8. State and Transition Diagram Legend
More interactive model formats are also available. View Interactive Models
More interactive model formats are also available. View Interactive Models
Click on state and transition labels to scroll to the respective textEcosystem states
States 1, 5 and 6 (additional transitions)
State 1 submodel, plant communities
State 2 submodel, plant communities
State 3 submodel, plant communities
State 4 submodel, plant communities
State 5 submodel, plant communities
State 6 submodel, plant communities
State 1
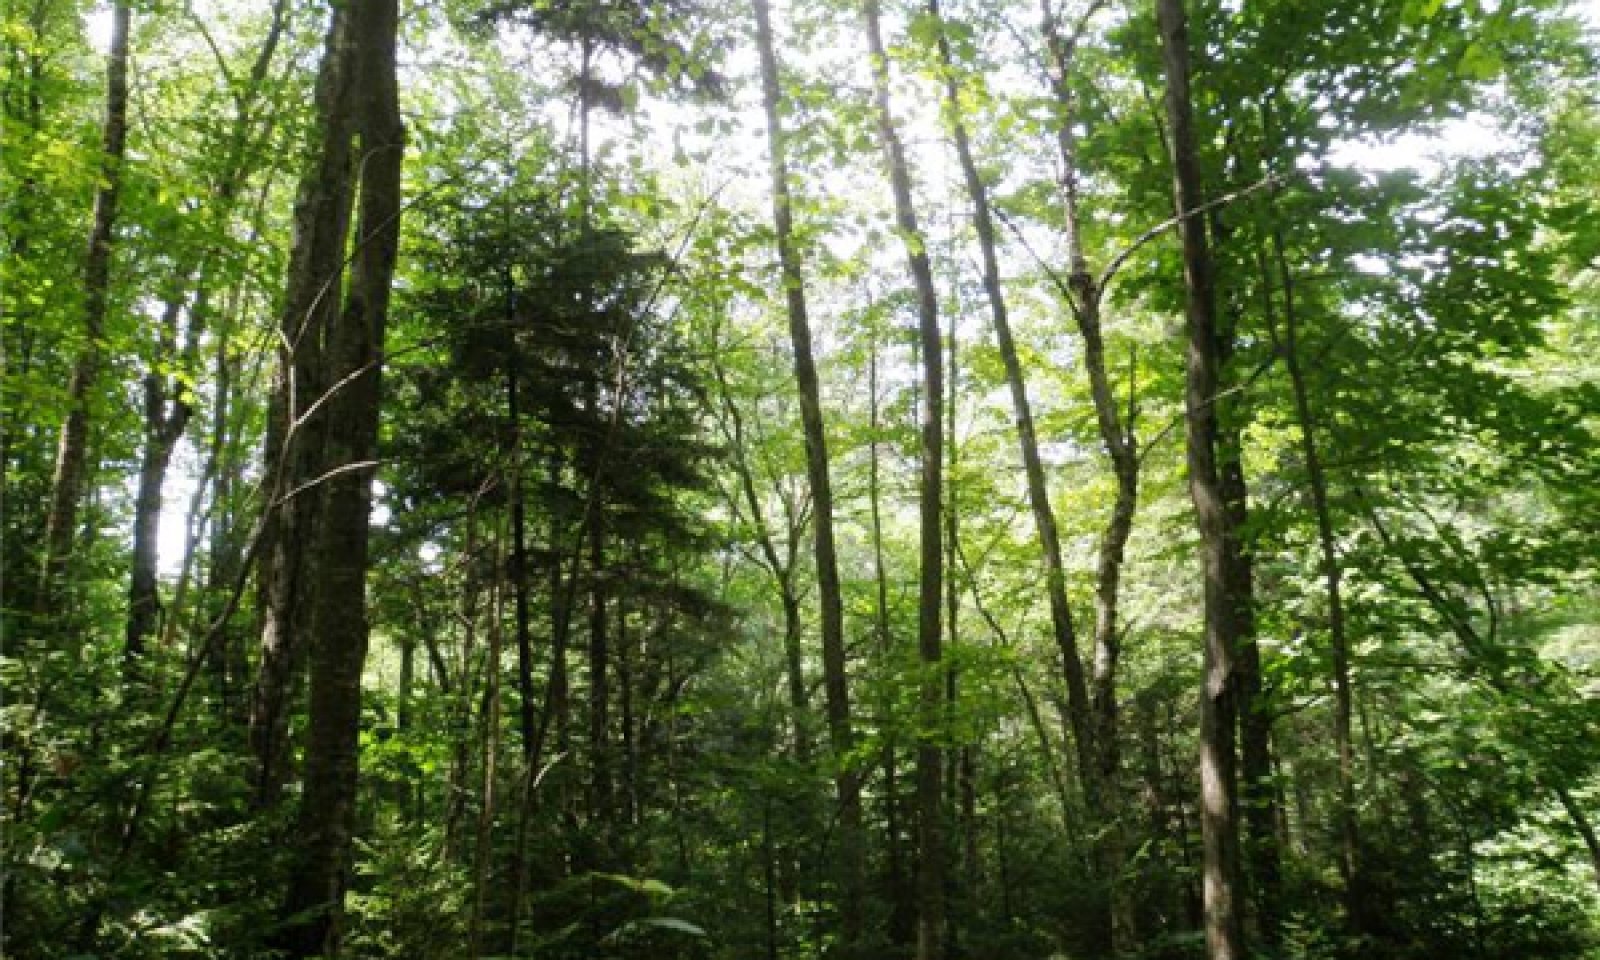
Reference StateThis state represents the current range of variability that dominates the dynamics of this site. The canopy typically has strong dominance by red maple with lower cover of Picea rubens (red spruce), with Tsuga canadensis (eastern hemlock) next in importance. Shrub cover is often dominated by beech brush; herbs are sparse. The plant community is maintained by an absence of fire and major disturbance. Pre-European settlement disturbance consisted of single tree disturbance associated with wind, snow and or/ice damage.
Community 1.1
Red Maple-Red Spruce/Beech Brush
Figure 9. Red Maple-Red Spruce/Beech Brush
This image is the reference community for the site. The description is based on historical descriptions, site index data, professional consensus of experienced ecologists, and analysis of field work. Old growth forests of this type are very rare.
Indicators: This community is the result of beech die back caused by beech bark disease (BBD). Historically, beech would have been a major component of the overstory with red maple and birch species co-dominating. Red spruce likely would have composed less than 25-30% of overstory cover.
Feedbacks: Hardwoods cycle soil calcium via leaf litter. Hardwood leaf litter mull creates unfavorable conditions for conifer regeneration.Forest overstory.The upper canopy averages 85% cover and is strongly dominated by Acer rubrum (red maple), with lower cover of Picea rubens (red spruce), Tsuga canadensis (eastern hemlock), Betula alleghaniensis var. alleghaniensis (yellow birch), Betula lenta (black birch), Prunus serotina (black cherry), and other trees that occasionally occur with low cover in the canopy include Fagus grandifolia (American beech), Acer pensylvanicum (striped maple) and Amelanchier laevis (Allegheny serviceberry). The subcanopy is very similar in dominance and composition to the canopy.
Forest understory. The understory is strongly dominated by saplings of the root suckers of the canopy species Fagus grandifolia (American beech), and occasional species of the overstory, especially Picea rubens (red spruce). The fern/herbaceous/non-vascular stratum is dominated by moss, Lycopodium species, and wood ferns.
Table 5. Soil surface cover
Tree basal cover 0-10% Shrub/vine/liana basal cover 0.0-0.1% Grass/grasslike basal cover 0.0-0.1% Forb basal cover 0.1-1.0% Non-vascular plants 0.0-0.1% Biological crusts 0% Litter 80-90% Surface fragments >0.25" and <=3" 0.1-3.0% Surface fragments >3" 0.1-3.0% Bedrock 0.0-0.1% Water 0% Bare ground 0% Table 6. Woody ground cover
Downed wood, fine-small (<0.40" diameter; 1-hour fuels) 1-2% Downed wood, fine-medium (0.40-0.99" diameter; 10-hour fuels) 1-2% Downed wood, fine-large (1.00-2.99" diameter; 100-hour fuels) 3-8% Downed wood, coarse-small (3.00-8.99" diameter; 1,000-hour fuels) 2-5% Downed wood, coarse-large (>9.00" diameter; 10,000-hour fuels) 3-8% Tree snags** (hard***) – Tree snags** (soft***) – Tree snag count** (hard***) 10-20 per acre Tree snag count** (hard***) 0-10 per acre * Decomposition Classes: N - no or little integration with the soil surface; I - partial to nearly full integration with the soil surface.
** >10.16cm diameter at 1.3716m above ground and >1.8288m height--if less diameter OR height use applicable down wood type; for pinyon and juniper, use 0.3048m above ground.
*** Hard - tree is dead with most or all of bark intact; Soft - most of bark has sloughed off.
Table 7. Canopy structure (% cover)
Height Above Ground (ft) Tree Shrub/Vine Grass/
GrasslikeForb <0.5 0-1% 0-1% 0-1% 0-1% >0.5 <= 1 0-1% 0-1% 0-1% 0-1% >1 <= 2 0-1% 0-1% 0-1% 0-1% >2 <= 4.5 0-1% 0-1% – 0-1% >4.5 <= 13 1-10% 0-1% – – >13 <= 40 1-25% – – – >40 <= 80 65-75% – – – >80 <= 120 80-95% – – – >120 0-20% – – – State 2
Logged & Burned State With Beech SeedbankLogging and/or intense fire eliminate conifers. American beech remnants remain to contribute seed rain and/or seed remains in the soil seedbank.
Community 2.1
Red Maple-Beech
Figure 10. Red Maple-American Beech

Figure 11. Red Maple-Beech
This community was created by management (logging) and/or human induced fire.
Indicators: Hardwoods are the dominant overstory species and red spruce is absent from the overstory and understory. These sites may also represent locations experiencing Spodosol depodzolization (see ecologic dynamics of the site for discussion)
Feedbacks: Hardwood leaf litter mull and an absence of conifer seed source inhibits conifer regeneration. Beech bark disease is killing beech.State 3
Logged & Burned State With Cherry SeedbankLogging and/or intense fire eliminate conifers. Black cherry remnants remain to contribute seed rain and/or seed remains in soil seedbank.
Community 3.1
Black Cherry-Red Maple
Figure 12. Black Cherry-Red Maple

Figure 13. Black Cherry-Red Maple
This community was created by management (logging) and/or human induced fire.
Indicators: Hardwoods are the dominant overstory species and red spruce is absent from the overstory and understory. These sites may also represent locations experiencing Spodosol depodzolization (see ecologic dynamics of the site for discussion)
Feedbacks: Hardwood leaf litter mull and lack of conifer seed source inhibits conifer regeneration. Black cherry regeneration appears relatively successful.State 4
Logged State With Beech SeedbankThis state occurs after logging, with an absence of fire or with the occurance of very light fire and with a residual spruce seed source. Remaining beech trees contribute seed rain to the site and/or beech seeds remain in the soil seedbank.
Community 4.1
Red Maple-Beech/Red Spruce Saplings
Figure 14. Red Maple-Beech/Red Spruce Saplings
This community was created by management (logging) and/or human induced, low intensity fire.
Indicators: Hardwoods are the dominant overstory component, with less than 30 percent red spruce overstory.
Feedbacks: Red spruce is suppressed in the understory. Hardwood leaf litter mull inhibits conifer regeneration. Beech bark disease is killing beech.State 5
Logged State With Cherry SeedbankThis state occurs after logging, with an absence of fire or with the occurance of very light fire and with a residual spruce seed source. Remaining black cherry trees contribute seed rain to the site and/or beech seeds remain in the soil seedbank.
Community 5.1
Black Cherry-Maple/Red Spruce Saplings
Figure 15. Black Cherry-Maple/Red Spruce Saplings
This community was created by management (logging) and/or man induced, low intensity fire.
Indicators: hardwoods are the dominant overstory component, with less than 30 percent red spruce overstory.
Feedbacks: red spruce is suppressed in the understory. Hardwood leaf litter mull inhibits conifer regeneration.State 6
Tree Plantation StateThis community was created by logging, intense fire and commercial tree planting. Some sites may represent plantations located on marginal and/or abandoned farmland.
Community 6.1
Norway Spruce, White Pine or Red Pine
Figure 16. Red Pine Plantation
This phase is a plantation planted by the Civilian Conservation Corps and the United States Forest Service during the 1930s and 1940s. The areas were planted to provide timber products and wildlife habitat.
Transition T1A
State 1 to 2Logging and intense fire removes trees. Natural hardwood regeneration occurs in the absence of conifer lost to fire.
Transition T1B
State 1 to 3Logging and intense fire removes trees. Natural hardwood regeneration occurs in the absence of conifer lost to fire.
Transition T1C
State 1 to 4Transition occurs via logging with the absence of fire or the occurrence of light fire leaving the spruce seed source intact.
Transition T1D
State 1 to 5Transition occurs via logging with the absence of fire or the occurrence of light fire leaving the spruce seed source intact.
Transition T1E
State 1 to 6Transition occurs via logging, intense fire and commercial tree planting. Some sites reflect planting of abandoned marginal farmland.
Transition T2A
State 2 to 4Natural conifer understory recruitment and or under-planting conifer
Transition T3A
State 3 to 5Natural conifer understory recruitment and or under-planting conifer
Restoration pathway R4A
State 4 to 1Thin hardwoods (cutting, ringing and/or herbicide application) to release spruce
Conservation practices
Forest Stand Improvement Restoration pathway R5A
State 5 to 1Thin hardwoods (cutting, ringing and/or herbicide application) to release spruce
Conservation practices
Forest Stand Improvement Additional community tables
Table 8. Community 1.1 plant community composition
Group Common name Symbol Scientific name Annual production () Foliar cover (%) Table 9. Community 1.1 forest overstory composition
Common name Symbol Scientific name Nativity Height ft Canopy cover (%) Diameter in Basal area (square ft/acre) Treered maple ACRU Acer rubrum Native 60-120 30-50 14-18 0 black cherry PRSE2 Prunus serotina Native 60-100 10-30 14-18 0 red spruce PIRU Picea rubens Native 75-100 10-30 12-16 0 yellow birch BEAL2 Betula alleghaniensis Native 40-80 0-20 6-10 0 sweet birch BELE Betula lenta Native 30-60 0-10 6-10 0 sugar maple ACSA3 Acer saccharum Native 65-95 0-10 10-14 0 eastern hemlock TSCA Tsuga canadensis Native 60-100 0-10 14-16 0 American beech FAGR Fagus grandifolia Native 40-90 0-10 10-12 0 striped maple ACPE Acer pensylvanicum Native 13-30 0-5 4-6 0 Allegheny serviceberry AMLA Amelanchier laevis Native 13-30 0-5 4-8 0 Table 10. Community 1.1 forest understory composition
Common name Symbol Scientific name Nativity Height (ft) Canopy cover (%) Grass/grass-like (Graminoids)sedge CAREX Carex Native 0.1–0.8 0.1–1 Forb/HerbIndian cucumber MEDEO Medeola Native 0.1–0.5 0–0.1 trillium TRILL Trillium Native 0.1–0.5 0–0.1 common yellow oxalis OXST Oxalis stricta Native 0.1–0.4 0–0.1 partridgeberry MIRE Mitchella repens Native 0.1–0.2 0–0.1 Canada mayflower MACA4 Maianthemum canadense Native 0.1–0.4 0–0.1 lesser roundleaved orchid PLOR4 Platanthera orbiculata Native 0.1–1 0–0.1 Fern/fern allyrunning clubmoss LYCL Lycopodium clavatum Native 0.1–0.5 0–1 intermediate woodfern DRIN5 Dryopteris intermedia Native 0.5–1.5 0.1–1 New York fern THNO Thelypteris noveboracensis Native 0.4–1 0–0.5 Treestriped maple ACPE Acer pensylvanicum Native 6–13 0–5 Allegheny serviceberry AMLA Amelanchier laevis Native 6–13 0–5 red spruce PIRU Picea rubens Native 0.4–1.5 0.1–1 American beech FAGR Fagus grandifolia Native 1–3 0.1–1 American beech FAGR Fagus grandifolia Native 3–6 0.1–1 red spruce PIRU Picea rubens Native 1.5–6 0.1–1 American beech FAGR Fagus grandifolia – 6–13 0.1–1 Nonvascularsplendid feather moss HYSP70 Hylocomium splendens Native 0.1–0.4 0–5 Table 11. Community 2.1 plant community composition
Group Common name Symbol Scientific name Annual production () Foliar cover (%) Table 12. Community 3.1 plant community composition
Group Common name Symbol Scientific name Annual production () Foliar cover (%) Table 13. Community 4.1 plant community composition
Group Common name Symbol Scientific name Annual production () Foliar cover (%) Table 14. Community 5.1 plant community composition
Group Common name Symbol Scientific name Annual production () Foliar cover (%) Table 15. Community 6.1 plant community composition
Group Common name Symbol Scientific name Annual production () Foliar cover (%) Interpretations
Animal community
This ecological sites included has three forested phases: Hardwood dominated canopy, and a conifer dominated canopy tree plantation. Conifer species on non-plantation sites include red spruce and hemlock; on plantations Norway spruce, red pine and occasionally white pine. The hardwood dominated canopy includes beech, black cherry, red maple, cucumber magnolia, and yellow birch with red spruce and hemlock a minor component of the canopy.
This ecological site provides critical habitat and ecosystem functions for numerous wildlife species. Some wildlife species that show a preference for this type of vegetation includes, but not too; Northern Goshawk, Pine Siskin, Swainson’s Thrush, Olive-sided Flycatcher, Red Crossbill, WV Northern Flying Squirrel, Snowshoe Hare, Spruce Knob Threetooth Snail, Black Bear, Grouse, Bobcat, Fisher, and Whitetail Deer.
Using the Natural Resources Conservation Service (NRCS) planning and programs to establish or maintain forest habitat will ensure that landowners can protect, conserve, and enhance their natural resources including the many species of wildlife that depend on these sites.
Recreational uses
A majority of land that this ecological site descriptions represents is owned by the federal government as part of the United States Forest Service Monongahela National Forest (Forest Service). Many trails exists throughout the ecological site. Hiking, biking, horseback riding, hunting, fishing are very popular recreation opportunities. Birding and wildflower (plant) identification are potential recreational pursuits. Steeper trails e.g. greater than 15% may be susceptible to erosion.
Wood products
This land is generally used for habitat conservation. Occasionally commercial logging occurs. Valuable tree species (i.e. black cherry) exist on disturbed states, and red spruce is valued for musical instruments.
Other products
The land is not used for farming or livestock production.
Other information
Habitat conservation and carbon sequestration are important attributes of this ecological site.
Supporting information
Inventory data references
Tier I Data- Low intensity data collection including field reconnaissance; verification of soil maps; ocular estimates; plant identifications; taking photos; recording GPS coordinates; making field notes; developing ES concepts in field; etc. Tier II Data- Medium intensity data including additional qualitative and quantitative data collection; plant identifications; additional soils verification; taking photos; recording GPS coordinates; making field notes; testing ES concepts and site keys in field for ES ranges of variability; etc. Tier III Data-High intensity data collection according including additional quantitative data at type locations to support finalized ES concepts and populate ESDs; plant identifications; intensive soils verification, as needed; taking photos; recording GPS coordinates; making field notes; verifying ESD STM and key in field to establish full range of variability for ES; etc. This includes releve data.
Type locality
Location 1: Pocahontas County, WV Latitude 38° 47′ 25″ Longitude 38° 41′ 30″ General legal description Near the mouth of Fox Run along the West Fork of the Greenbrier River. Other references
Allard, H.A., and E.C. Leonard. 1952. The Canaan and the Stony River Valleys of West Virginia, their former magnificent spruce forests, their vegetation and floristics today. Castanea 17(1): 1-60.
Barrett, L.R. and R.J. Schaetzl. 1998. Regressive pedogenesis following a century of deforestation: Evidence for depodzolization. Soil Science 163: 482-497.
Brooks, A.B. 1910. WV Geological Survey, Volume 5: Forestry and Wood Industries. Acme Publishing Co, Morgantown, WV.
Ciolkosz, E.J., W.J. Waltman, T.W. Simpson, and R.R. Dobos. 1989. Distribution and genesis of soils of the northeastern United States. Geomorphology 2:285-302.
Hopkins, A.D. 1899. Report on investigations to determine the cause of unhealthy conditions of the spruce and pine from 1880-1893. West Virginia Agricultural Experiment Station, Bulletin 56: 197-461.
Lundstrom, U.S., N. van Breeman, and D. Bain. 2000. The podzolization process: A review. Geoderma 94:91-107.
Lietzke, D.A. and G.A. McGuire. 1987. Characterization and classification of soils with spodic morphology in the Southern Appalachians. Soil Sci. Soc. Amer. J. 51:165-170.
Schaetzl, R.J. and S.A. Isard. 1996. Regional-scale relationships between climate and strength of podsolization in the Great Lakes Region, North America. Catena 28:47-69.
Soil Survey Staff. 2010. Keys to Soil Taxonomy, 11th ed. USDA-Natural Resources Conservation Service, Washington, DC.
Stanley, S.R. and E.J. Ciolkosz. 1981. Classification and genesis of Spodosols in the Central Appalachians. Soil Sci. Soc. Amer. J. 45:912-917.
Ugolini, F.C., R. Dahlgren, and K. Vogt. 1990. The genesis of Spodosols and the role of vegetation in the Cascade Range of Washington, U.S.A. P. 370-380 in J.M. Kimble and R.D. Yeck (eds.), Proc. 5th Int. Soil Correlation Mtg. Characterization, Classification, and Utilization of Spodosols. USDA-SCS, Lincoln, NE.
Contributors
Jason Teets
Approval
Greg Schmidt, 9/27/2024
Rangeland health reference sheet
Interpreting Indicators of Rangeland Health is a qualitative assessment protocol used to determine ecosystem condition based on benchmark characteristics described in the Reference Sheet. A suite of 17 (or more) indicators are typically considered in an assessment. The ecological site(s) representative of an assessment location must be known prior to applying the protocol and must be verified based on soils and climate. Current plant community cannot be used to identify the ecological site.
Author(s)/participant(s) Contact for lead author Date 08/18/2026 Approved by Approval date Composition (Indicators 10 and 12) based on Annual Production Indicators
-
Number and extent of rills:
-
Presence of water flow patterns:
-
Number and height of erosional pedestals or terracettes:
-
Bare ground from Ecological Site Description or other studies (rock, litter, lichen, moss, plant canopy are not bare ground):
-
Number of gullies and erosion associated with gullies:
-
Extent of wind scoured, blowouts and/or depositional areas:
-
Amount of litter movement (describe size and distance expected to travel):
-
Soil surface (top few mm) resistance to erosion (stability values are averages - most sites will show a range of values):
-
Soil surface structure and SOM content (include type of structure and A-horizon color and thickness):
-
Effect of community phase composition (relative proportion of different functional groups) and spatial distribution on infiltration and runoff:
-
Presence and thickness of compaction layer (usually none; describe soil profile features which may be mistaken for compaction on this site):
-
Functional/Structural Groups (list in order of descending dominance by above-ground annual-production or live foliar cover using symbols: >>, >, = to indicate much greater than, greater than, and equal to):
Dominant:
Sub-dominant:
Other:
Additional:
-
Amount of plant mortality and decadence (include which functional groups are expected to show mortality or decadence):
-
Average percent litter cover (%) and depth ( in):
-
Expected annual annual-production (this is TOTAL above-ground annual-production, not just forage annual-production):
-
Potential invasive (including noxious) species (native and non-native). List species which BOTH characterize degraded states and have the potential to become a dominant or co-dominant species on the ecological site if their future establishment and growth is not actively controlled by management interventions. Species that become dominant for only one to several years (e.g., short-term response to drought or wildfire) are not invasive plants. Note that unlike other indicators, we are describing what is NOT expected in the reference state for the ecological site:
-
Perennial plant reproductive capability:
Print Options
Sections
Font
AAAAOther
PrintThe Ecosystem Dynamics Interpretive Tool is an information system framework developed by the USDA-ARS Jornada Experimental Range, USDA Natural Resources Conservation Service, and New Mexico State University.
Accessibility statement


