Natural Resources
Conservation Service
-
Search


Major Land Resource Area or ecological site by name and/or ID.
PreviousSectionsNextGeneral information
Draft. A draft ecological site description is either incomplete or has not undergone quality control and quality assurance review.
Classification relationships
Landcover Type: Colorado Plateau mixed bedrock canyon and tableland (USGS National Gap Analysis Program, 2005).
PINUS EDULIS - (JUNIPERUS SPP.) Woodland Alliance (Western Ecology Working Group of NatureServe, No date).Ecological site concept
This site occurs in the semidesert zone of the Colorado and Green River Plateaus Region (MLRA 35) in Southern Utah. It is found on very shallow to shallow soil pockets intermingled with extensive slickrock at elevations between 4000 and 5000 feet. Average annual precipitation ranges from 7 to 11 inches. Soils are sandy loams derived from eolian deposits and/or sandstone residuum. Continuous biological crust cover is typical of the reference state. The soil moisture regime is typic aridic and the soil temperature regime is mesic. The plant community is characterized by a sparse overstory of Utah juniper (Juniperus osteosperma) and twoneedle pinyon (Pinus edulis) over a relatively low cover of shrubs and grasses. Mormontea (Ephedra viridis) and Bigelow’s sage (Artemisia bigelovii) are common, with broom snakeweed (Gutierrezia sarothrae) increasing with soil disturbance. James’ galleta (Pleuraphis jamesii) is the dominant grass in the interpretive state, while Indian ricegrass (Achnatherum hymenoides) may have been more abundant in the reference state.
Similar sites
R035XY019UT Shallow Sand Rock Pocket (Utah Juniper/Two-Needle Pinyon)
This ecological site also occurs on soils among predominately bedrock areas; however it occurs on soils with less development (psamments), and consequently lower stability. Production and species diversity are higher, and blackbrush (Coleogyne ramosissima) and singleleaf ash (Fraxinus anomala) are the dominant shrubs.
Table 1. Dominant plant species
Tree (1) Juniperus osteosperma
(2) Pinus edulisShrub (1) Artemisia bigelovii
(2) Ephedra viridisHerbaceous (1) Pleuraphis jamesii
Physiographic features
This site occurs on pockets among sandstone bedrock on structural benches, cuestas, and mesas. Slopes may range from 3 to 20%, but are typically below 10%. Elevations range from 4,000 to 5,000 feet. Runoff class is very high.
Table 2. Representative physiographic features
Landforms (1) Structural bench
(2) Cuesta
(3) Mesa
Flooding frequency None Ponding frequency None Elevation 4000 – 5000 ft Slope 3 – 10 % Climatic features
The climate is characterized by hot summers and cool winters. Large fluctuations in daily temperature are common. The wettest months include July thru October and the driest December thru February, and June. Precipitation is variable from month to month and from year to year and typically ranges between 7-11 inches. Snow packs are generally light and not persistent.
Table 3 Representative climatic features
Frost-free period (average) 150 days Freeze-free period (average) 180 days Precipitation total (average) 10 in BarLineFigure 1. Monthly precipitation range
BarLineFigure 2. Monthly average minimum and maximum temperature
Figure 3. Annual precipitation pattern
Figure 4 Annual average temperature pattern
Climate stations used
-
(1) ARCHES NP HQS [USC00420336], Thompson, UT
-
(2) MOAB [USC00425733], Moab, UT
">Influencing water features
Soil features
The soils associated with this ecological site are very shallow to shallow over lithic bedrock. These soils are derived from eolian deposits and/or residuum weathered from sandstone parent material. The dry surface color is reddish brown. Soils are well drained with moderately rapid permeability. The soil moisture regime is typic aridic and the soil temperature regime is mesic. The surface texture is a fine sandy loam, and surface rock fragments are not typically present. Soils on the sites in the reference state generally have moderate wind and water erosion potential due to high cover of biological crust; erosion potential becomes high with surface disturbance. Biological crust cover is characterized as high, with continuous thick lichen, moss, and cyanobacteria cover typical of undisturbed sites. In disturbed areas loss of crust and gullying from runoff from adjacent bedrock is common. Subsurface textures is sandy loam. Subsurface rock fragments smaller than 3 mm in diameter range from 0 to 5 percent by volume, and larger fragments are typically not present. The Moenkopie soils (Loamy, mixed, superactive, calcareous, mesic Lithic Torriorthents) are correlated to this ecological site.
This ecological site has been correlated to the following mapunits and soil components:
UT624 - Grand County - MU55 - Moenkopie (25%)
Typical Soil Profile:
A--0-2 inches; fine sandy loam; strongly calcareous; moderately alkaline
C--2-9 inches; sandy loam; strongly calcareous; moderately alkaline
2R--9 inches; sandstone
Table 4. Representative soil features
Parent material (1) Eolian deposits – sandstone
Surface texture (1) Fine sandy loam
Family particle size (1) Loamy
Drainage class Well drained Permeability class Moderately rapid Soil depth 5 – 20 in Surface fragment cover <=3" Not specified Surface fragment cover >3" Not specified Available water capacity
(0-40in)1.9 – 2.1 in Subsurface fragment volume <=3"
(Depth not specified)0 – 5 % Subsurface fragment volume >3"
(Depth not specified)Not specified Ecological dynamics
This ecological site occurs in the semidesert zone of the Colorado and Green River Plateaus Region (MLRA 35) in southeastern Utah. Shallow soils amongst a bedrock dominated landscape support a sparse overstory of Utah juniper and twoneedle pinyon over an open cover of shrubs and grasses. Forbs are present but typically have minimal cover and production. Well-developed biological soil crust (BSC) consisting of mosses, lichens and cyanobacteria forms a nearly continuous cover. This site developed with a natural disturbance regime that included decadal level variation in precipitation with alternating wet and dry periods, including severe drought (Swetnam and Betancourt 1998, Hereford et al. 2002, Miller 2004, Schwinning et al. 2008), and light grazing by native ungulates (Mack and Thompson 1982, Cole et al. 1997, Neff et al. 2005, Schwinning et al. 2008). Fire was and is minimal due to extensive rock cover in between vegetated pockets, although rare lightning strikes could have affected isolated stands. Current disturbances impacting this site include climatic variation, livestock grazing, recreational impacts (mountain biking, hiking, ohv use), and climate change.
Decadal scale variation in precipitation due to the Pacific Decadal Oscillation (PDO) has characterized the climate of the Colorado Plateau over the last century, with a wet period from 1905-1941, a dry period between 1942-1977, a wet period from 1978-1998, and a dry period from 1999 to the present, with a particularly catastrophic drought in 2002 (Ehleringer et al. 2000, Hereford et al. 2002, Miller 2004, Schwinning et al. 2008). These fluctuations can change plant community composition, cover and production (Swetnam and Betancourt 1998, Illius and O'Connor 1999, Ehleringer et al. 2000, Briske et al. 2003, Neff et al. 2005). In this ecological site drought impacts may result in widespread mortality in twoneedle pinyon, and shallow-rooted plants like cactus, grasses and forbs. Drought can increase the susceptibility of twoneedle pinyon to attack and damage by bark beetle (Ips confusus), increasing mortality rates (Miller 2004, Schwinning et al. 2008). Wet climatic periods result in widespread recruitment, and increased productivity. Biological soil crust productivity and composition is also impacted by climate, with photosynthetic capacity of all organisms decreasing during drought, and certain organisms more impacted than others (Belnap et al. 2004).
Global climate change predictions for the Colorado Plateau include an increase in both average and extreme temperatures, which will increase the impacts of drought even if precipitation patterns remain relatively unchanged (Schwinning et al. 2008). The Colorado Plateau may be particularly sensitive to global climate change due to a transitional climatic position between strong monsoon dominated systems to the south and cool season precipitation dominance to the north (Ehleringer et al. 2000, Miller 2004). Evidence for global climate change so far shows an increase in minimum temperatures since the 1960s, a weak trend towards increasing winter precipitation and no change in the summer monsoon (Spence 2001). Changes in the timing of precipitation could have major effects; for example, a shift to more summer and less winter precipitation would be very damaging to BSCs, which would in turn impact plant community structure (Belnap et al. 2004, Schwinning et al. 2008).
Historically the Colorado Plateau experienced only light grazing by native ungulates whose populations were kept in check by native predators such as mountain lions and wolves (Mack and Thompson 1982, Cole et al. 1997, Schwinning et al. 2008). Livestock grazing by cattle was introduced to this region in the 1880s, and many areas were impacted by grazing at some level (Neff et al. 2005). One of the most significant impacts of livestock grazing in this arid region has been damage to biological soil crust (BSC), including reductions in species diversity, cover, and alteration of species composition, with simplified communities of cyanobacteria replacing lichen and moss species that may take decades to recover (e.g Evans and Belnap 1999, Belnap and Eldridge 2003). The loss of BSC reduces soil stability, and soil moisture holding capacity, and consequently increases erosion potential (Evans and Belnap 1999, Belnap and Eldridge 2003, Harris et al. 2003, Neff et al. 2005). The typically sloping, relatively fine, shallow soils of this ecological site are especially susceptible to erosion with loss of BSC. They naturally receive runoff from adjacent bedrock, and where crust isn’t present to absorb and deflect this runoff, severe gullying and erosion is likely.
The following State-and-Transition Model describes the most commonly occurring plant communities found on this ecological site. Separations between states and community phases were based on professional consensus. All tabular data listed for a specific community phase within this ecological site description represent a summary of one or more field data collection plots taken in modal communities within the community phase, except for 1.2, which was inferred from community phase 2.2. Although such data are valuable in understanding the phase (kinds and amounts of ground and surface materials, canopy characteristics, community phase overstory and understory species, production and composition, and growth), they do not represent the absolute range of characteristics or an exhaustive listing of all species that may occur in that phase over the geographic range of the ecological site.State and transition model
Custom diagramStandard diagram
Figure 5. R035XY229UT
More interactive model formats are also available. View Interactive Models
More interactive model formats are also available. View Interactive Models
Click on state and transition labels to scroll to the respective textEcosystem states
State 1 submodel, plant communities
State 1
ReferenceThe reference state was determined by literature review, historical accounts and observations of trends in plant community dynamics. Community composition data for community phase 1.2 was inferred from the community phase 2.2 and literature.
The reference state represents the plant communities and ecological dynamics of this ecological site under pre-settlement conditions and a natural disturbance regime. The plant communities of the reference state were likely similar to the climate induced plant communities of the current potential state (State 2), and characterized by a sparse overstory of Utah juniper and twoneedle pinyon, over sparse shrubs and grasses. Mormon tea, Bigelow’s sagebrush, and antelope bitterbrush were common shrubs, with a diversity of other species present. Cover of these palatable species may have been higher in the ungrazed reference state. Unpalatable disturbance adapted shrubs like broom snakeweed and rubber rabbitbrush were likely less abundant, and palatable grasses like Indian ricegrass and James’ galleta were likely more abundant (Cole et al. 1997). James’ galleta may be an increaser with grazing pressure at the expense of other less grazing tolerant species (Kleiner 1983), and Indian ricegrass may have been the dominant grass in the reference plant community, or at least more important than observed in the interpretive state plant communities. The primary disturbances included fluctuations in precipitation and native ungulate browsing. Plant community composition likely changed during wet and dry periods, fluctuating between community phase 1.1 and 1.2.
Reference State: Plant communities influenced by climate fluctuations between wet and dry periods.
Indicators: Continuous well-developed BSC and productive perennial grass component.
Feedbacks: Natural fluctuations in climate allow for a self-sustaining sparse woodland community with shrub, grass and forb component.
At-risk Community Phase: Community 1.2 is particularly susceptible to damage.
Trigger: Improper livestock grazing.Community 1.1
Utah juniper – twoneedle pinyon sparse woodlandData for this community phase does not exist, but the community composition was likely similar to Community Phase 1.2, except with more BSC cover, higher vegetative cover and production, higher grass cover and production, and less importance of disturbance adapted species.
Community 1.2
Utah juniper sparse woodlandData for this community phase does not exist, but the community composition was likely similar to Community Phase 2.2, except with more BSC cover, higher vegetative cover and production, higher grass cover and production, and less importance of disturbance adapted species. Species composition in the below table is inferred from community phase 2.2.
Figure 6. Annual production by plant type (representative values) or group (midpoint values)
Pathway 1.1a
Community 1.1 to 1.2This pathway occurs when a dry climatic phase triggers mortality and dieback in twoneedle pinyon, shallow-rooted shrubs and herbaceous species. Utah juniper may be impacted with severe drought.
Pathway 1.2a
Community 1.2 to 1.1This pathway occurs with wetter than normal, or a return to normal precipitation periods and time, that allow for recruitment and growth of twoneedle pinyon, shrubs and grasses.
State 2
Current PotentialThis state represents the current potential of this ecological site, and the dynamics include disturbance by livestock and recreational use (mountain biking, hiking, ohv) as well as the natural climate fluctuations that influenced the historic state. The current potential state will naturally fluctuate between Community phases 2.1 and 2.2, and will shift to Community phase 2.3 with abusive livestock or recreational use. Continued abusive use, especially if coupled with severe drought, could cause a transition to an eroded state. The eroded state has not been observed, but managers should be aware of the potential for it to occur.
Current Potential State: Plant communities influenced by climate fluctuations between wet and dry periods, livestock grazing, and recreational use (mountain biking, hiking and ohv).
Indicators: Patchy well-developed BSC with large areas of bare ground, sparse Utah juniper and twoneedle pinyon cover over Mormon tea, Bigelow’s sagebrush, antelope bitterbrush and other shrubs, and sparse James’ galleta. Indian ricegrass may be present at low amounts.
Feedbacks: Natural fluctuations in climate allow for a self-sustaining sparse woodland community with shrub, grass and forb component. Improper livestock grazing or heavy recreational use that further damages BSC and soils, reduces grass cover and promotes establishment of disturbance adapted shrubs.
At-risk Community Phase: Community 2.3 is at risk of transitioning to an eroded state with continued improper livestock grazing or recreational use, especially in combination with drought, but all community phases may be impacted.
Trigger: Continuous improper livestock grazing or recreational use that causes permanent loss of BSC and soils.
Community 2.1
Utah Juniper – twoneedle pinyon sparse woodland (Provisional)This community phase was not observed, since all areas where the site occurs are still recovering from the impacts of catastrophic drought in 2002 and an overall very dry period from 1996 to 2013. Data for this phase should be collected after a sustained wet period. Based on observations of standing trees and shrubs in the dry community phase (Phase 2.2), this phase is characterized by 3-4% canopy of Utah juniper and 2 to 3% canopy of twoneedle pinyon. Shrub cover may be as high as 25-30%. Perennial grass cover is likely much higher than that observed in the dry community phase, perhaps 10-15%. Forb cover and diversity is likely higher in this phase. This phase is more susceptible to invasion by non-native species.
Community 2.2
Utah juniper sparse woodland
Figure 7. Community Phase 2.1

Figure 8. Community Phase 2.1 soil surface
This community phase is characterized by 1-2% canopy cover of Utah Juniper and 0 -1% cover of twoneedle pinyon. Total canopy cover averages 22%. Average shrub canopy cover is 17%, with Mormon tea, Bigelow’s sagerbrush, antelope bitterbrush, and broom snakeweed important species. Other frequently encountered shrubs include rubber rabbitbrush (Ericameria nauseosa var. bigelovii), Parry’s rabbitbrush (Ericameria parryi), plains pricklypear (Opunita polyacantha), and singleleaf ash (Fraxinus anomolus), and other shrub species may be present at low amounts. Perennial grass cover averages 3%, and ranges from trace to 7 percent. James’ galleta is the dominant species, while Indian ricegrass typically present at up to 1% cover. Purple needlegrass may also be present at trace amounts. Forbs are a minor component of this phase, with only trace cover and production. Cover of biological soil crust ranges from 45-55%, with 8-11% bare ground, 4-9% litter, and 8-11% bedrock. Biological soil crust is typically well-developed lichen, moss and cyanobacteria, but patches of light cyanobacteria may also be present.
Figure 9. Annual production by plant type (representative values) or group (midpoint values)
Table 5. Annual production by plant type
Plant type Low
(lb/acre)Representative value
(lb/acre)High
(lb/acre)Tree 30 40 130 Shrub/Vine 42 65 88 Grass/Grasslike 26 41 55 Forb 0 0 5 Total 98 146 278 Table 6. Ground cover
Tree foliar cover 0-0% Shrub/vine/liana foliar cover 10-30% Grass/grasslike foliar cover 0-10% Forb foliar cover 0-0% Non-vascular plants 0% Biological crusts 50-60% Litter 10-10% Surface fragments >0.25" and <=3" 0-10% Surface fragments >3" 0-10% Bedrock 10-10% Water 0% Bare ground 0-10% Table 7. Canopy structure (% cover)
Height Above Ground (ft) Tree Shrub/Vine Grass/
GrasslikeForb <0.5 0-1% 1-3% 0-7% 0-1% >0.5 <= 1 0-1% 3-15% 1-7% 0-1% >1 <= 2 0-1% 10-28% 0-5% 0-1% >2 <= 4.5 0-1% 0-10% – – >4.5 <= 13 0-1% – – – >13 <= 40 0-3% – – – >40 <= 80 – – – – >80 <= 120 – – – – >120 – – – – Community 2.3
Degraded Utah juniper – twoneedle pinyon sparse woodland
Figure 10. Community Phase 2.3

Figure 11. Eroded soils
This community phase is characterized by a decline in BSC, with 20 to 30% cover, an increase in bare ground to 25-30%, and a reduction in total canopy cover, which averages 9%. Cyanobacterial crust patches are more prevalent, while lichen and moss patches are small. Broom snakeweed is often the most productive and abundant species in this phase, while the palatable Bigelow sagebrush declines.
Figure 12. Annual production by plant type (representative values) or group (midpoint values)
Table 8. Annual production by plant type
Plant type Low
(lb/acre)Representative value
(lb/acre)High
(lb/acre)Tree 14 18 160 Shrub/Vine 28 43 58 Grass/Grasslike 17 27 35 Forb 0 0 1 Total 59 88 254 Table 9. Ground cover
Tree foliar cover 0-0% Shrub/vine/liana foliar cover 0-10% Grass/grasslike foliar cover 0-0% Forb foliar cover 0-0% Non-vascular plants 0% Biological crusts 20-30% Litter 0-10% Surface fragments >0.25" and <=3" 10-20% Surface fragments >3" 0-0% Bedrock 10-20% Water 0% Bare ground 30-30% Table 10. Canopy structure (% cover)
Height Above Ground (ft) Tree Shrub/Vine Grass/
GrasslikeForb <0.5 0-1% 0-5% 0-3% 0-1% >0.5 <= 1 0-1% 1-5% 0-3% 0-1% >1 <= 2 0-1% 3-9% 0-3% 0-1% >2 <= 4.5 0-1% 0-9% 0-1% 0-1% >4.5 <= 13 0-1% – – – >13 <= 40 1-4% – – – >40 <= 80 – – – – >80 <= 120 – – – – >120 – – – – Pathway 2.1a
Community 2.1 to 2.2This pathway occurs when a dry climatic phase triggers mortality and dieback in twoneedle pinyon, shallow-rooted shrubs and herbaceous species. Utah juniper may be impacted by severe drought, and exhibit mortality or dieback.
Pathway 2.1b
Community 2.1 to 2.3This pathway occurs with improper livestock and/or recreational use that damages BSC and soils, leading to a loss of BSC cover and observable erosion. Shrub and perennial grass cover and production decline.
Pathway 2.2a
Community 2.2 to 2.1This pathway occurs with wetter than normal, or a return to normal precipitation periods and time, that allow for recruitment and growth of twoneedle pinyon, shrubs and grasses.
Pathway 2.2b
Community 2.2 to 2.3
Utah juniper sparse woodland
Degraded Utah juniper – twoneedle pinyon sparse woodlandThis pathway occurs with improper livestock and/or recreational use that damages BSC and soils, leading to a loss of BSC cover and observable erosion. Shrub and perennial grass cover and production decline.
Pathway 2.3a
Community 2.3 to 2.1This pathway may occur with time without additional disturbance, and adequate precipitation to allow recruitment and establishment to occur. Continued disturbance however, will either maintain this community phase, or if severe enough, trigger a transition to an eroded state. Recovery during dry climatic periods is unlikely.
Transition T1
State 1 to 2Transition from reference state (State 1) to current potential state (State 2). This transition may occur with improper livestock grazing.
Additional community tables
Table 11. Community 1.1 plant community composition
Group Common name Symbol Scientific name Annual production () Foliar cover (%) Table 12. Community 1.2 plant community composition
Group Common name Symbol Scientific name Annual production () Foliar cover (%) Shrub/Vine1 Shrubs 42–88 Bigelow sage ARBI3 Artemisia bigelovii 25–50 3–7 antelope bitterbrush PUTR2 Purshia tridentata 0–30 0–5 mormon tea EPVI Ephedra viridis 5–25 2–4 plains pricklypear OPPO Opuntia polyacantha 1–10 0–1 singleleaf ash FRAN2 Fraxinus anomala 0–6 0–1 broom snakeweed GUSA2 Gutierrezia sarothrae 0–5 0–1 rubber rabbitbrush ERNAB2 Ericameria nauseosa ssp. nauseosa var. bigelovii 0–5 0–1 Parry's rabbitbrush ERPA30 Ericameria parryi 0–5 0–1 Grass/Grasslike2 Grasses 60–205 Indian ricegrass ACHY Achnatherum hymenoides 30–100 2–7 James' galleta PLJA Pleuraphis jamesii 30–100 2–7 Grass, perennial 2GP Grass, perennial 0–20 0–2 purple threeawn ARPU9 Aristida purpurea 0–5 0–1 Forb3 Forbs 0–5 Forb, annual 2FA Forb, annual 0–5 0–3 Forb, perennial 2FP Forb, perennial 0–5 0–3 thymeleaf sandmat CHSE6 Chamaesyce serpyllifolia 0–1 0–1 shy wallflower ERIN7 Erysimum inconspicuum 0–1 0–1 rock goldenrod PEPU7 Petradoria pumila 0–1 0–1 Tree4 Trees 30–130 Utah juniper JUOS Juniperus osteosperma 25–105 1–2 twoneedle pinyon PIED Pinus edulis 5–25 0–1 Table 13. Community 2.1 plant community composition
Group Common name Symbol Scientific name Annual production () Foliar cover (%) Table 14. Community 2.2 plant community composition
Group Common name Symbol Scientific name Annual production () Foliar cover (%) Shrub/Vine1 Shrubs 42–88 broom snakeweed GUSA2 Gutierrezia sarothrae 5–44 1–5 Bigelow sage ARBI3 Artemisia bigelovii 3–35 1–5 antelope bitterbrush PUTR2 Purshia tridentata 0–30 0–5 Shrub, other 2S Shrub, other 0–30 0–5 mormon tea EPVI Ephedra viridis 5–25 2–4 rubber rabbitbrush ERNAB2 Ericameria nauseosa ssp. nauseosa var. bigelovii 0–10 0–2 plains pricklypear OPPO Opuntia polyacantha 1–10 0–1 Parry's rabbitbrush ERPA30 Ericameria parryi 1–7 1–2 singleleaf ash FRAN2 Fraxinus anomala 0–6 0–1 Grass/Grasslike2 Grasses 26–55 James' galleta PLJA Pleuraphis jamesii 15–90 1–7 Indian ricegrass ACHY Achnatherum hymenoides 0–25 0–1 Grass, perennial 2GP Grass, perennial 0–10 0–5 purple threeawn ARPU9 Aristida purpurea 0–5 0–1 Forb3 Forbs 0–5 Forb, annual 2FA Forb, annual 0–5 0–5 Forb, perennial 2FP Forb, perennial 0–5 0–5 thymeleaf sandmat CHSE6 Chamaesyce serpyllifolia 0–1 0–1 shy wallflower ERIN7 Erysimum inconspicuum 0–1 0–1 rock goldenrod PEPU7 Petradoria pumila 0–1 0–1 Tree4 Trees 30–130 Utah juniper JUOS Juniperus osteosperma 25–105 1–2 twoneedle pinyon PIED Pinus edulis 5–25 0–1 Table 15. Community 2.3 plant community composition
Group Common name Symbol Scientific name Annual production () Foliar cover (%) Shrub/Vine1 Shrubs 28–58 broom snakeweed GUSA2 Gutierrezia sarothrae 5–55 1–5 mormon tea EPVI Ephedra viridis 4–12 1–3 antelope bitterbrush PUTR2 Purshia tridentata 0–10 0–1 Parry's rabbitbrush ERPA30 Ericameria parryi 1–6 1–2 singleleaf ash FRAN2 Fraxinus anomala 0–6 0–1 Bigelow sage ARBI3 Artemisia bigelovii 0–2 0–1 Grass/Grasslike2 Grasses 17–36 James' galleta PLJA Pleuraphis jamesii 0–35 0–3 Indian ricegrass ACHY Achnatherum hymenoides 0–2 0–1 Forb3 Forbs 0–1 rock goldenrod PEPU7 Petradoria pumila 0–1 0–1 Tree4 Trees 14–160 Utah juniper JUOS Juniperus osteosperma 9–135 1–3 twoneedle pinyon PIED Pinus edulis 5–25 0–1 Interpretations
Animal community
--Wildlife Interpretation--
Small herds of mule deer and pronghorn antelope may graze/browse on these sites, especially when located near water sources and in the winter. The hot summers and lack of water often favors small mammals, which may have an easier time finding shelter, food, and water. Several species of rats, mice, squirrels, bats, and chipmunks may be observed using the site, along with coyotes and foxes. Lizards can often be observed during the day. Common lizard species include the northern whiptail, desert spiny, and the colorful western collard lizard. (NPS.gov, 2008)
--Grazing Interpretations--
This site has limited potential for livestock grazing due to a lack of perennial grasses and the large amounts of rock outcrop that dissect this site. This site often lacks natural water sources, which can influence its suitability for livestock grazing. When present, perennial grasses, primarily Indian ricegrass and James galleta, can provide good forage for horses, cattle, and sheep. Several shrub species that occur on this site are important forage for wildlife and livestock. Bigelow’s sagebrush is an important nutritious winter and spring forage species, (Howard 1993), mormon tea is an important winter forage species(Anderson 2001), and antelope bitterbrush is very important summer, fall and winter forage (Zlatnik 1999). Grazing is not recommended on this site due to overall low productivity and the fragility of the small soil pockets that characterize this site. If grazing does occur, it must be carefully planned and managed to prevent damage to the site. An onsite evaluation should be conducted as part of a science based grazing management plan.
Hydrological functions
The soils associated with this ecological site are generally in Hydrologic Soil Group D due to their shallow depth (NRCS National Engineering Handbook). These soils become saturated quickly due to their high infiltration rates and shallow depths; once these soils are saturated run off potential is high (National Range and Pasture Handbook, 2003).
Recreational uses
This site is used extensively for mountain biking and hiking, and ohv travel. One of the largest delineations of the site occurs in the Klondike Bluffs Area (BLM), which has at least 50 miles of designated trails. Research on mountain biking impacts on the ecological communities of this site is not available. Mountain biking trails target the slickrock component of this site; however sections on soil are unavoidable. Recreational use quickly damages and removes BSC, and causes soil erosion.
Wood products
Utah juniper and Two-needle pinyon may provide firewood and possibly fence post where growth is sufficient and regulations allow such use.
Other information
--Invasive Plant Communities--
Although livestock grazing and other forms of soil disturbance often increases site susceptibility to invasion, this ecological site has low susceptibility to invasion by non-native species, with no non-natives observed during data collection and field reconnaissance. High crust or gravel cover in the undisturbed state repels establishment of species like cheatgrass (Bromus tectorum) (Belnap and Lange 2003), while high erosion rates in disturbed states also reduce invasibility in this site. Cheatgrass may invade this site however, especially during wet winter conditions.
--Fire Ecology--
The ability of this ecological site to carry fire is limited due to the surrounding bedrock that prevents fires from spreading, and low productivity and fine fuels in the vegetation community. The sites present fuel load and plant fine fuel moisture content affect the spread of any lightening caused spot fires that may start.Supporting information
Inventory data references
Data collected to develop this ecological site were part of a contract to update draft MLRA35 Ecological Sites. The vegetation data was collected on representative soil components, and was geo-referenced. All data is stored as hard copy files and in an electronic format in the NRCS Utah State Office. High intensity sampling (Caudle et al. 2013) was used to describe this ecological site. Site characteristics such as aspect, slope, elevation and UTMS were recorded for each plot, along with complete species inventory by ocular percent cover. The line-point intercept method was used to measure foliar cover, groundcover, and vegetation structure. At 100 points along a 200 foot transect, ground cover and intercepted plant species were recorded by height. The first hit method (Herrick et al. 2009) was used to generate the foliar cover values entered in the community phase composition tables. Annual production was estimated using the double-weight sampling method outlined in the National Range and Pasture Handbook and in Sampling Vegetation Attributes (NRCS 2003 and Interagency Technical Reference 1999 pgs. 102 - 115). For herbaceous vegetation, ten 9.6 square foot circular sub-plots were evenly distributed along a 200 foot transect. For woody and larger herbaceous species, production was estimated in four 21x21 foot square plots along the same transect. Weight units were collected for each species encountered in the production plots. The number of weight units for each species is then estimated for all plots.
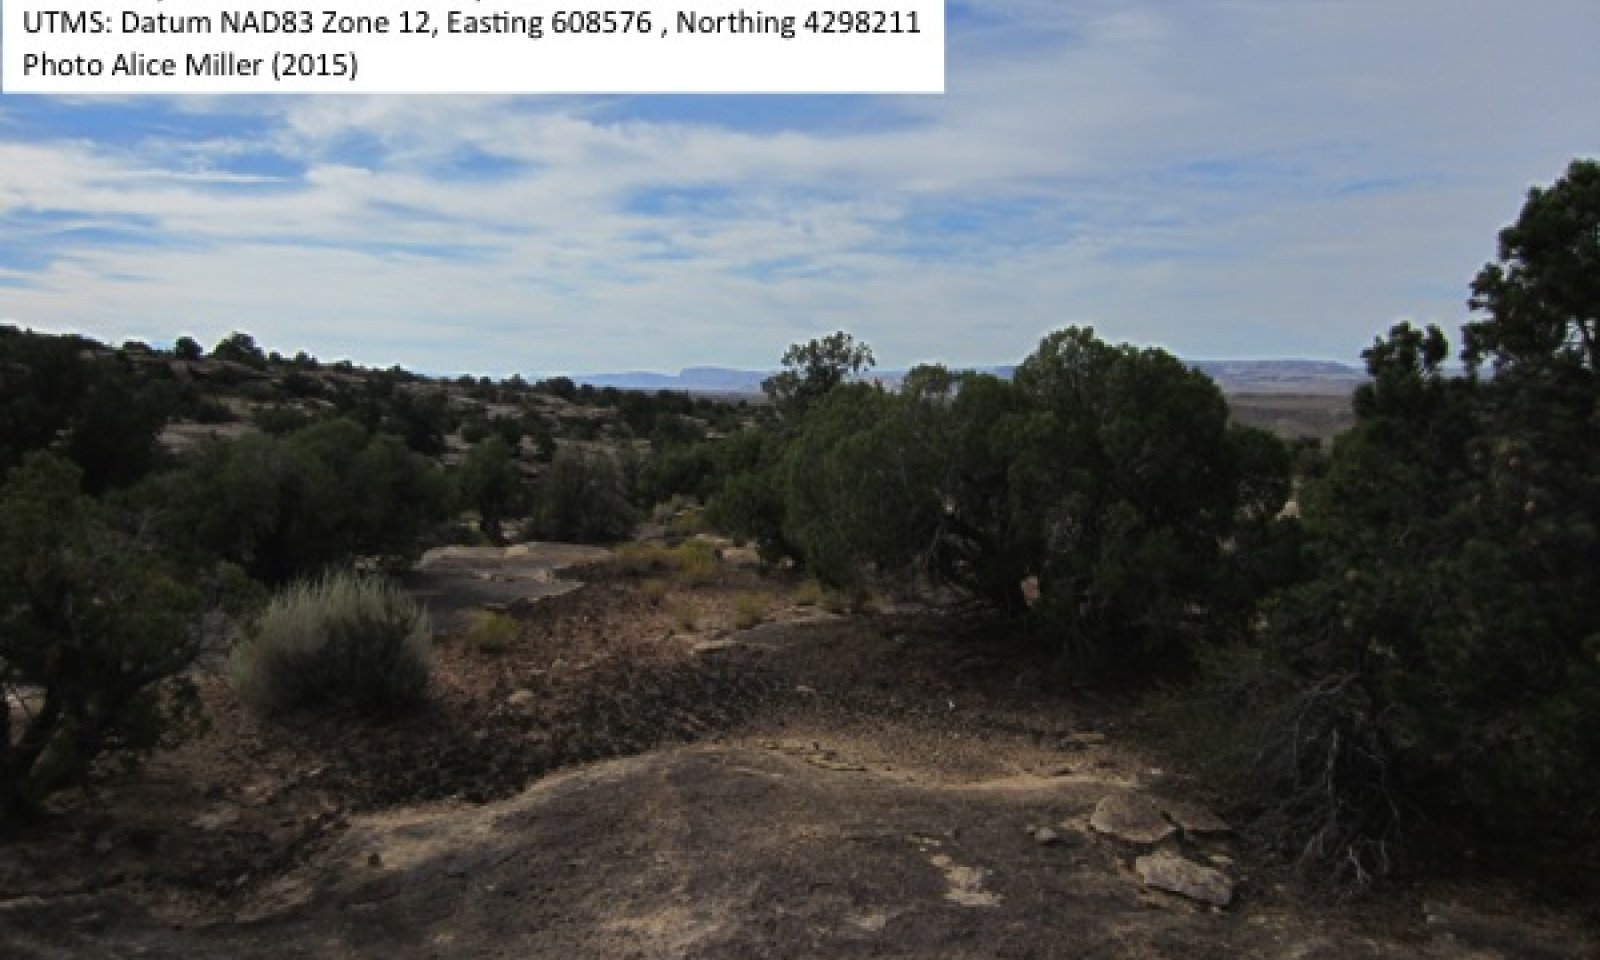
Type locality
Location 1: Grand County, UT UTM zone N UTM northing 4298211 UTM easting 608576 General legal description The type location occurs in the Klondike Bluffs Area (BLM), north of Moab. Other references
Anderson, M. D. 2001. Ephedra viridis. Fire Effects Information System, [Online]. U.S. Department of Agriculture, Forest Service, Rocky Mountain Research Station, Fire Sciences Laboratory.
Belnap, J. and D. Eldridge. 2003. Disturbance and recovery of biological soil crusts. Pages 363-383 Biological soil crusts: structure, function, and management. Springer, Berlin Heidelberg.
Belnap, J. and O. L. Lange. 2003. Biological soil crusts: structure, function, and management. Springer, Berin, Heidelberg, New York.
Belnap, J., S. L. Phillips, and M. E. Miller. 2004. Response of desert biological soil crusts to alterations in precipitation frequency. Oecolgia 141:306-316.
Briske, D. D., S. D. Fuhlendorf, and F. E. Smeins. 2003. Vegetation dynamics on rangelands: a critique of the current paradigms. Journal of Applied Ecology 40:601-614.
Brotherson, J. D., W. E. Evenson, S. R. Rushforth, J. Fairchild, and J. R. Johansen. 1985. Spatial patterns of plant communities and differential weathering in Navajo National Monument, Arizona. The Great Basin Naturalist 45:1-13.
Caudle, D., H. Sanchez, J. DiBenedetto, C. Talbot, and M. Karl. 2013. Interagency ecological site handbook for rangelands. USDA-NRCS, USDA-FS, DOI-BLM.
Cole, K. L., N. Henderson, and D. S. Shafer. 1997. Holocene vegetation and historic grazing impacts at Capitol Reef National Park reconstructed using packrat middens. Great Basin Naturalist 57:315-326.
Ehleringer, J. E., S. Schwinning, and R. Gebauer. 2000. Water use in arid land ecosystems. Pages 347-365. Blackwell Science, University of York.
Evans, R. D. and J. Belnap. 1999. Long-term consequences of disturbance on Nitrogen dynamics in an arid ecosystem. Ecology 80:150-160.
Harris, A. T., G. P. Asner, and M. E. Miller. 2003. Changes in vegetation structure after long-term grazing in pinyon-juniper ecosystems: integrating imaging spectroscopy and field studies. Ecosystems 6:368-383.
Hereford, R., R. H. Webb, and S. Graham. 2002. Precipitation history of the Colorado Plateau Region, 1900-2000. U.S. Geological Survey Fact Sheet 119-02. (online). U. S. Geological Survey.
Herrick, J. E., J. W. V. Zee, K. M. Havstad, L. M. Burkett, and W. G. Whitford. 2009. Monitoring manual for grassland, shrubland, and savanna ecosystems. Volume I: Quick Start. USDA-ARS Jornada Experimental Range, Tucson, AZ.
Howard, J. L. 1993. Artemisia bigelovii. Fire Effects Information System, [Online]. U.S. Department of Agriculture, Forest Service, Rocky Mountain Research Station, Fire Sciences Laboratory.
Illius, A. W. and T. G. O'Connor. 1999. On the relevance of nonequilibrium concepts to arid and semiarid grazing systems. Ecological Applications 9:798-813.
Kleiner, E. F. 1983. Successional trends in an ungrazed, arid grassland over a decade. Journal of Range Management 36:114-118.
Mack, R. N. and J. N. Thompson. 1982. Evolution in steppe with few large, hooved mammals. The American Naturalist 119:757-773.
Miller, M. E. 2004. The structure and functioning of dryland ecosystems - conceptual models to inform the vital-sign selection process. United States Geological Survey Report, February draft Report, Moab, UT.
Neff, J. C., R. L. Reynolds, J. Belnap, and P. Lamothe. 2005. Multi-decadal impacts of grazing on soil physical and biogeochemical properties in southeast Utah. Ecological Applications 15:87-95.
Schwinning, S., J. Belnap, D. R. Bowling, and J. R. Ehleringer. 2008. Sensitivity of the Colorado Plateau to change: climate, ecoystems, and society. Ecology and Society 13:28.
Spence, J. R. 2001. Climate of the central Colorado Plateau, Utah and Arizona: Characterization and recent trends. Pages 187-203 in C. van Riper III, K. A. Thomas, and M. A. Stuart, editors. Proceedings of the fifth biennial conference of research on the Colorado Plateau. U.S. Geological Survey/FRESC Report Series USGSFRESC/COPL/2001/24.
Swetnam, T. W. and J. L. Betancourt. 1998. Mesoscale disturbance and ecological response to decadal climatic variability in the American southwest. Journal of Climate 11:3128-3147.
USGS National Gap Analysis Program. 2005. Southwest Regional GAP Analysis Project—Land Cover Descriptions. RS/GIS Laboratory, College of Natural Resources, Utah State University.
Western Ecology Working Group of NatureServe. No date. International Ecological Classification Standard: International Vegetation Classification. Terrestrial Vegetation. NatureServe, Boulder, CO.
Zlatnik, E. 1999. Purshia tridentata. Fire Effects Information System. U.S. Department of Agriculture, Forest Service, Rocky Mountain Research Station, Fire Sciences Laboratory.
Contributors
Alice Miller
Rangeland health reference sheet
Interpreting Indicators of Rangeland Health is a qualitative assessment protocol used to determine ecosystem condition based on benchmark characteristics described in the Reference Sheet. A suite of 17 (or more) indicators are typically considered in an assessment. The ecological site(s) representative of an assessment location must be known prior to applying the protocol and must be verified based on soils and climate. Current plant community cannot be used to identify the ecological site.
Author(s)/participant(s) Alice Miller (Pyramid Botanical Consultants), Shane A. Green (NRCS) Contact for lead author shane.green@ut.usda.gov Date 02/26/2016 Approved by Approval date Composition (Indicators 10 and 12) based on Annual Production Indicators
-
Number and extent of rills:
Often present below adjacent exposed bedrock. Rills increase immediately following large storm events. Rills are typically 5-20’ in length, and are typically broken by vegetation patches or exposed bedrock. -
Presence of water flow patterns:
Few and short water flow patterns. Waterflow patterns may increase on steeper slopes following large storm events, dissipating where the slope flattens. Interspaces between vegetation and/or well developed biological soil crusts appear to be depression water storage areas but actually serve as somewhat stable water flow patterns during precipitation events. -
Number and height of erosional pedestals or terracettes:
Pedestals are rare to none. Well developed biological crusts may appear pedestalled, but are actually a characteristic of the crust formation. Terracettes are rare to none, and if present occur behind litter obstructions in water flow patterns. -
Bare ground from Ecological Site Description or other studies (rock, litter, lichen, moss, plant canopy are not bare ground):
8-11%. Most bare ground is associated with water flow patterns. Biological soil crust dominates the soil surface at 45-55%, and areas with well developed biological soil crusts should not be counted as bare ground. Areas with poorly developed biological soil crusts that are interpreted as functioning as bare ground (therefore they would be susceptible to raindrop splash erosion) should be recorded as bare ground. This site typically has 8-11%bedrock cover, and may have up to 15% rock fragment cover. Ground cover is based on first raindrop impact, and bare ground is the opposite of ground cover. Ground cover + bare ground = 100%. -
Number of gullies and erosion associated with gullies:
None to few. Stable gullies may be present in landscape settings where increased runoff may accumulate (such as areas below exposed bedrock). -
Extent of wind scoured, blowouts and/or depositional areas:
None to very few. High cover of biological soil crust stabilizes the soil and reduces potential for wind erosion. -
Amount of litter movement (describe size and distance expected to travel):
Most fine litter accumulates at the base of plants, or in waterflow patterns following large storm events. Woody litter (if present) should not move from beneath the plant. -
Soil surface (top few mm) resistance to erosion (stability values are averages - most sites will show a range of values):
This site should have a soil stability rating of 4-6 throughout the site. Surface texture is fine sandy loam. -
Soil surface structure and SOM content (include type of structure and A-horizon color and thickness):
Soil surface horizon is typically 2 inches deep. Structure is typically weak medium platy and weak fine granular. Color is typically reddish brown (5YR4/3). The A horizon would be expected to be more strongly developed under plant canopies. It is important if you are sampling to observe the A horizon under plant canopies as well as the interspaces. Use the specific information for the soil you are assessing found in the published soil survey to supplement this description. -
Effect of community phase composition (relative proportion of different functional groups) and spatial distribution on infiltration and runoff:
Distribution of vascular plants and/or biological soil crusts intercept raindrops, reduce splash erosion and provide areas of surface detention to store water allowing additional time for infiltration. Plants and/or biological soil crusts usually have sufficient cover to slow runoff allowing time for infiltration, except for some concentrated runoff flow at the base of exposed bedrock. -
Presence and thickness of compaction layer (usually none; describe soil profile features which may be mistaken for compaction on this site):
None. -
Functional/Structural Groups (list in order of descending dominance by above-ground annual-production or live foliar cover using symbols: >>, >, = to indicate much greater than, greater than, and equal to):
Dominant:
trees (juniper>pinyon)>=shrubs>perennial grassesSub-dominant:
forbsOther:
Additional:
-
Amount of plant mortality and decadence (include which functional groups are expected to show mortality or decadence):
Several standing dead trees may be present on the site, with more standing dead pinyon than juniper. Approximately 20% of the trees and shrubs can show evidence of decadence. During drought tree mortality is likely to increase with the first sign being a yellowish to reddish leaf color. Pinyon are more likely to die during drought, and juniper will often exhibit branch dieback rather than complete mortality. -
Average percent litter cover (%) and depth ( in):
-
Expected annual annual-production (this is TOTAL above-ground annual-production, not just forage annual-production):
98-276 pounds/acre.High biological soil crust or gravel cover in the undisturbed state repels establishment of species like cheatgrass (Bromus tectorum) (Belnap and Lange 2003), while high erosion rates in disturbed states also reduce invasibility in this site. Cheatgrass may invade this site however, especially in degraded conditions and during wet winter conditions. -
Potential invasive (including noxious) species (native and non-native). List species which BOTH characterize degraded states and have the potential to become a dominant or co-dominant species on the ecological site if their future establishment and growth is not actively controlled by management interventions. Species that become dominant for only one to several years (e.g., short-term response to drought or wildfire) are not invasive plants. Note that unlike other indicators, we are describing what is NOT expected in the reference state for the ecological site:
High biological soil crust or gravel cover in the undisturbed state repels establishment of species like cheatgrass (Bromus tectorum), while high erosion rates in disturbed states also reduce invasibility in this site. Cheatgrass may invade this site however, especially in degraded conditions and during wet winter conditions. -
Perennial plant reproductive capability:
All perennial plants should have the ability to reproduce sexually or asexually in most years, except in drought years.
Print Options
Sections
Font
AAAAOther
PrintThe Ecosystem Dynamics Interpretive Tool is an information system framework developed by the USDA-ARS Jornada Experimental Range, USDA Natural Resources Conservation Service, and New Mexico State University.
Accessibility statement