Natural Resources
Conservation Service
Ecological site VX166X01X003
Aquisalids Herbland
Last updated: 5/08/2025
Accessed: 09/23/2026
-
Search
Major Land Resource Area or ecological site by name and/or ID.
PreviousSectionsNextGeneral information
Provisional. A provisional ecological site description has undergone quality control and quality assurance review. It contains a working state and transition model and enough information to identify the ecological site.
MLRA notes
Major Land Resource Area (MLRA): 166X–Very Stony Land and Rock Land
This MLRA occurs in the State of Hawaii on the islands of Maui, Kahoolawe, Lanai, Molokai, Oahu, Kauai, and Niihau. Elevation ranges from sea level to 8,000 feet (0 to 2,440 meters). The terrain encompasses stony complex slopes and rocky gulches (USDA-NRCS, 2006). The geology is extrusive basic igneous rock (primarily basalt) that are weathered in some areas. Some interfluves are mantled with weathered volcanic ash. Average annual precipitation ranges from 17 to 39 inches (430 to 990 millimeters) (Giambelluca et al., 2013). Extreme average annual precipitation ranges from 10 to 107 inches (254 to 2,720 millimeters). Most of the rainfall occurs from November through March, much of it during kona storms. Average annual air temperatures ranges from 70 to 75 degrees F (21 to 24 degrees C) with little seasonal variation (Giambelluca et al., 2014). Extreme annual air temperatures range from 48 to 82 degrees F (9 to 28 degrees C). Dominant soils are Mollisols, Aridisols, and Entisols with an isohyperthermic, isothermic, or isomesic soil temperature regimes and ustic or aridic soil moisture regimes (USDA-NRCS, 2006). Vegetation consists of forbs, grasses, and shrubs with some trees. Most of the plant species typically encountered are introduced species that have become naturalized in Hawaii. However, areas within this MLRA are critical habitat for rare, threatened, or endangered plant species.
Classification relationships
This ecological site occurs within Major Land Resource Area (MLRA) 166 - Very Stony Land and Rock Land.
The Aha Moku System, which dates back to the 9th century and has been passed down through oral tradition and generational wisdom, effectively sustains Hawaii's natural ecosystems and environment (DLNR, 2024). This site-specific and resource-based approach balances land and ocean resources essential for fostering healthy, thriving communities. Grounded in Native Hawaiian generational knowledge, the Aha Moku System emphasizes community consultation to prioritize the health and welfare of Hawaii’s natural and cultural resources. It is rooted in the concept of 'ahupua'a, the traditional system of land and ocean management in Hawaii. For collaboration, this ecological framework encompasses the following mokus:
Molokai Moku Acres: Kona (1,571).
Maui Moku Acres: Pu'ali Komohana (660), Lahaina (233), and Kula (43).Ecological site concept
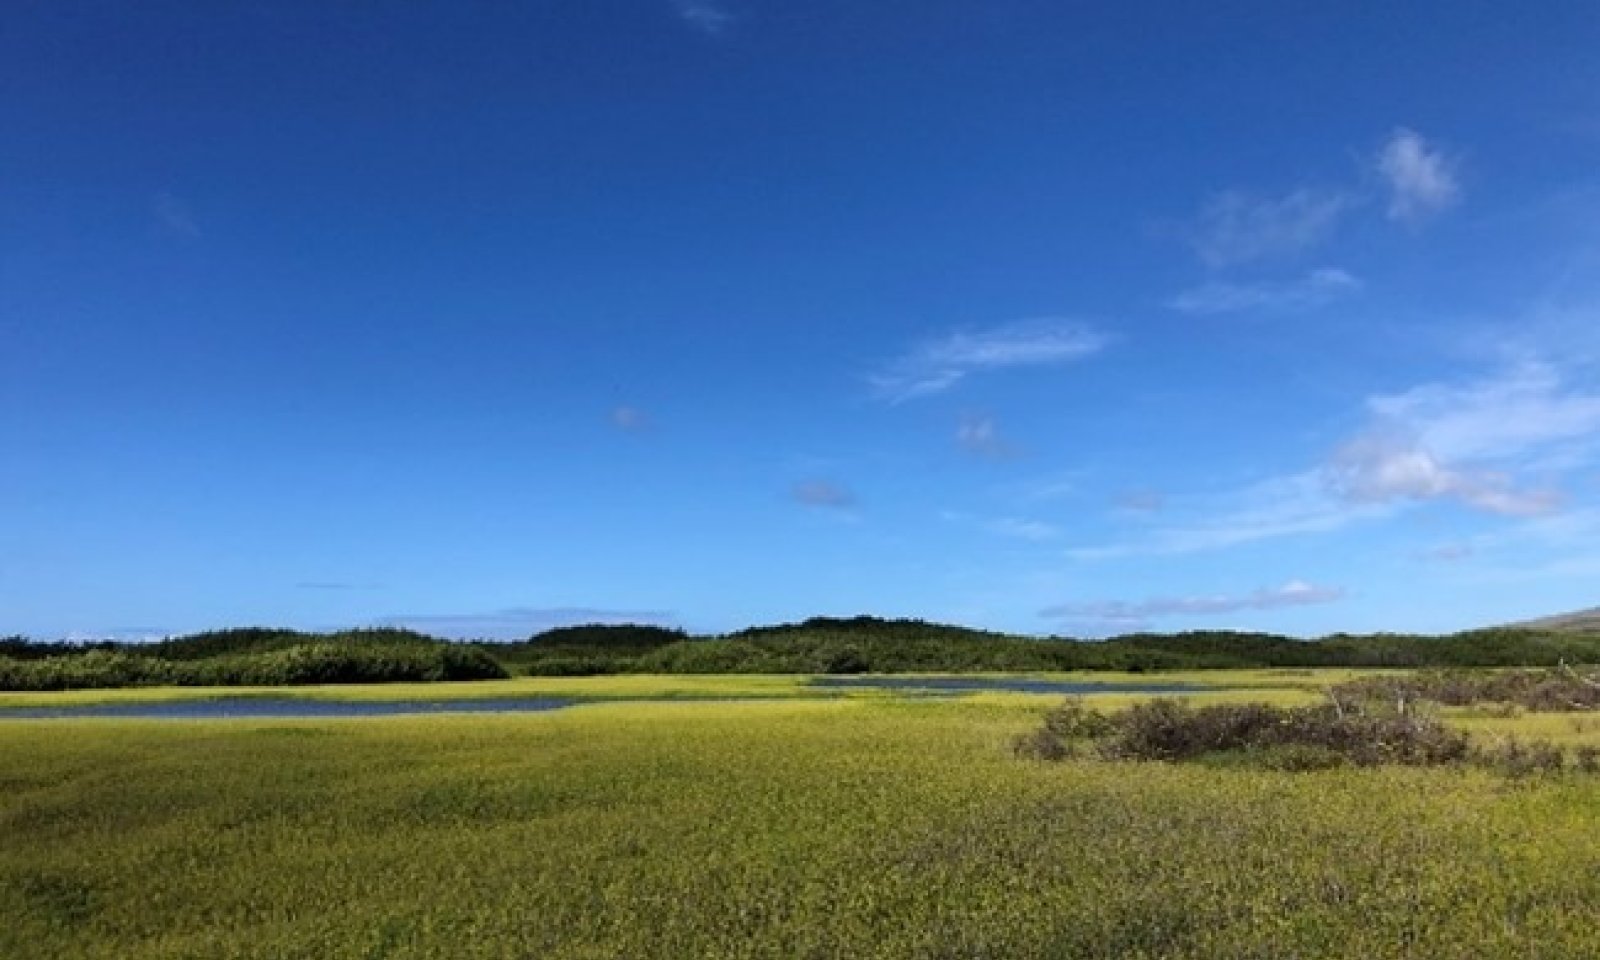
This ecological site supports a mix of forbs, grasses, shrubs, and a few trees (USDI-USGS, 2006). It occurs on nearly level coastal flats in scattered locations on the southwestern coast of Maui and southern coast of Molokai. Examples can be seen at Maalaea Haycraft Beach Park and Kealia Ponds Preserve on Route 31 on Maui, locations along Route 30 on West Maui, and along Route 450 on Molokai.
The central concept of the Aquisalids Herbland Ecological Site is of poorly drained, very deep soils formed in alluvium over beach sand. Soils are frequently ponded; a fluctuating, brackish water table is present at depths ranging from approximately 12 to 40 inches (305 to 1016 millimeters) (USDA-SCS, 1972). The ecological site occurs between elevations of 0 to 10 feet (0 to 3 meters) with extremes up to 100 feet (30 meters). Annual air temperatures and proximity to the ocean are associated with warm (isohyperthermic), water-saturated and anaerobic (aquic), saline soil conditions. Annual rainfall (20th and 80th percentiles) averages 23 to 27 inches (584 to 686 millimeters) (Giambelluca et al., 2013). Vegetation consists of forbs, grasses, shrubs, and trees that are adapted to survival in these unique conditions (USDA-SCS, 1972).
It appears that some examples of this community that are located on alluvial outwash from gulches emerging from the mountains may receive freshwater runoff that produces less-saline conditions, allowing some species not typically associated with high salinity tolerance to flourish.Associated sites
VX163X01X002 Sandy Shrubland
The Sandy Shrubland Ecological Site (R163XY002HI) co-occurs with this ecological site on Maui. It differs from this ecological site in its deep, sandy, excessively drained, and typically dry soils rather than poorly drained silt loam soils. However, one phase of this deep, dry, sandy soil has a shallower water table than most of this soil series; in microsite troughs in the terrain where this saline groundwater is at or near the surface, the two ecological sites may share some plant species.
VX166X01X001 Isohyperthermic Torric Naturalized Grassland
The Isohyperthermic Torric Naturalized Grassland Ecological Site (R166XY001HI) co-occurs with this ecological site on Molokai, where it forms the immediate upland area adjoining this ecological site. It is well drained rather than poorly drained and support dry upland vegetation rather than the primarily saline wetland species of this ecological site.
VX158X01X002 Isohyperthermic Torric Naturalized Grassland Kiawe/buffelgrass (Prosopis pallida/Pennisetum ciliare)
The Isohyperthermic Torric Naturalized Grassland Ecological Site (R158XY002HI) has a similar climate to this ecological site, but its soils are different. It has well drained soils rather than poorly drained soils which are shallow to a brackish water table. The two ecological sites share some plant species.
Similar sites
VX163X01X005 Aquic Coastal Wetland
The Aquic Coastal Wetland Ecological Site (R163XY005HI) and this ecological site are similar in the following ways: They are both wetlands with poorly, to very poorly drained soils which are subject to flooding and ponding, and they both occur along coastlines on coastal plains where they share similar elevations and climates. While they share some wetland species these ecological sites have predominantly different dominant species, different species compositions, and different vegetative structure. This ecological site is an herb land while R163XY005HI is predominantly dominated by Hau trees. This ecological site occurs on Maui and Molokai while R163XY005HI occurs on Oahu and Kauai.
Table 1. Dominant plant species
Tree Not specified
Shrub (1) Lycium sandwicense
Herbaceous (1) Sesuvium portulacastrum
(2) Heliotropium curassavicumLegacy ID
R166XY003HI
Physiographic features
This ecological site occurs on coastal plains on tidal flats and salt marshes where alluvium is deposited on beach sand (USDA-SCS, 1972).
Table 2. Representative physiographic features
Landforms (1) Coastal plain > Salt marsh
(2) Coastal plain > Tidal flat
Runoff class Very low Flooding frequency Frequent Ponding frequency Frequent Elevation 0 – 10 ft Slope 0 – 1 % Water table depth 12 – 40 in Aspect W, S Table 3. Representative physiographic features (actual ranges)
Runoff class Not specified Flooding frequency Not specified Ponding frequency Not specified Elevation 0 – 100 ft Slope 0 % Water table depth 0 in Climatic features
SUMMARY FOR THIS ECOLOGICAL SITE
Rainfall statistics were determined from University of Hawaii's Rainfall Atlas Raster Data (Giambelluca et al., 2013). Most of the precipitation falls from October through April. Representative (20th and 80th percentiles) values for annual average precipitation range from 23 to 27 inches (58 to 69 centimeters) while actual (10th and 90th percentiles) values range from 22 to 30 inches (56 to 76 centimeters). Extreme values range from 19 to 56 inches (48 to 142 centimeters). The mean annual precipitation is 26 inches (66 centimeters), and the median annual average precipitation is also 25 inches (64 centimeters).
Temperature statistics were determined from University of Hawaii's Surface Temperature Raster Data (Giambelluca et al., 2014). Representative (20th and 80th percentiles) values for annual temperatures range from 70 to 73 degrees F (21 to 23 degrees C) while actual (10th and 90th percentiles) values also range from 68 to 73 degrees F (20 to 23 degrees C). Extreme values range from 66 to 81 degrees F (19 to 27 degrees C). The mean annual temperature is 72 degrees F (22 degrees C) and the median annual temperature is also 72 degrees F (22 degrees C).
No suitable Western Region Climate Stations occur in or near this ecological site (WRCC, 2020). The data in the climate normals tables below are from the University of Hawaii.
GENERAL PRINCIPALS
Air temperature in the Hawaiian Islands is buffered by the surrounding ocean so that the range in temperature through the year is narrow. This creates “iso" - soil temperature regimes in which mean summer and winter temperatures differ by less than 6 degrees C (11 degrees F).
Hawaiian indigenous understanding recognized two seasons: Kau or Kauwela (dry season), and Ho`oilo (wet season). During Kau, the sun is directly overhead, days are long and warm, and the trade winds are stronger and more consistent; Kau started on the first new moon in May when the Pleiades set at sunrise (Handy et al., 1991). During Ho’oilo (wet season) the sun is declined toward the south, days are shorter, temperatures cooler and winds more variable and generally started with the first new moon in November. Ho’oilo is also the season when extensive low-pressure systems often approach the islands from the west, producing heavy rainstorms that primarily affect the leeward sides, but can envelope the entire island. (Malo, 1903; Handy et al., 1991; Sanderson, 1993). Differences in rainfall amounts between winter and summer are most marked in low elevation dry areas; wetter areas exhibit less seasonal variation in rainfall (USDA-SCS, 1972; Western Regional Climate Center, 2020).
The islands lie within the trade wind zone. Moisture is picked up from the ocean by trade winds to an altitude of about 6,000 feet (1,829 meters). As the trade winds from the northeast are forced up the islands’ mountains their moisture condenses, creating rain on the windward slopes; the leeward sides of the island receive little of this moisture. On West Maui and Molokai where the mountains are all lower than 6,000 feet (1,829 meters), the highest rainfall amounts occur along or near the summits. The moist trade winds usually flow across these lower mountains and around the higher mountains.
Besides the trade winds discussed above, other rainfall sources on the Hawaiian Islands include: a) Widespread winter storms that usually approach the islands from the west, producing heavy rainstorms that primarily affect the leeward sides but can envelope much larger areas; b) "Naulu storms" (Leopold, 1949) caused by local convergence of sea breezes and trade winds to produce summertime cumulus clouds, resulting in infrequent, short-duration, high-intensity rainfall and afternoon shade over leeward dry areas; and c) Fog drip, particularly important to areas with relatively low rainfall, that adds a significant amount of water to areas where clouds intersect mountains (Juvik and Nullet, 1993; Western Regional Climate Center, 2020).
The heaviest rains are brought by winter storms. The greatest amounts of storm rainfall do not always occur in areas with the highest average rainfall, and a storm may bring half of the mean annual rainfall to a dry area in one day (Western Regional Climate Center, 2020).Table 4 Representative climatic features
Frost-free period (characteristic range) 370 days Freeze-free period (characteristic range) 370 days Precipitation total (characteristic range) 20-30 in Frost-free period (actual range) 370 days Freeze-free period (actual range) 370 days Precipitation total (actual range) 20-30 in Frost-free period (average) 370 days Freeze-free period (average) 370 days Precipitation total (average) 30 in ">Influencing water features
Number of National Wetland Inventory (NWI) features overlapping ecological site: Freshwater forested/shrub wetland (89), freshwater emergent wetland (50), estuarine and marine wetland (41), freshwater pond (45), riverine (29), estuarine and marine deepwater (13), and lake (10) (USFSW, 2023). <br />
<br />
Number of National Hydrologic Dataset (NHD) features overlapping ecological site: Lake/pond (27), reservoir (16), swamp/marsh (7), sea/ocean (2), and foreshore (1) (USGS, 2019).Soil features
Only one soil component (Kealia) is associated with this ecological site.
Kealia soils are classified in the Aquisalids great group. The soil order is Aridisols, which typically are soils of dry areas, but also can be partly defined as soils that have a lack of water for mesophytic plants (plants that thrive under moderate conditions) for extended periods. The suborder is Salids, which have an accumulation of salts more soluble than gypsum (in this case, primarily sodium chloride). Kealia soils are poorly drained and very deep (greater than 72 inches or 183 centemeters). Although soils in the great group Aquisalids are saturated with water near the surface for extended periods, the deleterious effects of brackish water on most plants and the low effective concentration of water due to dissolved salts creates a unique environment that favors the dominance of specially adapted plant species (USDA-SCS, 1972).
Kealia soils formed on coastal flats in alluvium over beach sand. They have an isohyperthermic (very warm) soil temperature regime and are deep or very deep. They have an aquic (free of dissolved oxygen because it is saturated by water) soil moisture regime. Frequent ponding occurs in low areas after heavy rainfall. When the soil dries, salt crystals accumulate on the surface. These soils have a brackish water table that fluctuates with the tides. The water table is nearer the surface along the shoreline than in inland areas, ranging from approximately 12 to 40 inches (305 to 1016 millimeters) deep (USDA-SCS, 1972).Table 5. Representative soil features
Parent material (1) Alluvium
(2) Beach sand
Surface texture (1) Silt loam
Family particle size (1) Fine-loamy
Drainage class Poorly drained Permeability class Moderately slow Depth to restrictive layer 72 in Soil depth 72 in Surface fragment cover <=3" Not specified Surface fragment cover >3" Not specified Available water capacity
(0-40in)4 in Calcium carbonate equivalent
(0-40in)Not specified Electrical conductivity
(0-40in)16 – 32 mmhos/cm Sodium adsorption ratio
(0-40in)Not specified Soil reaction (1:1 water)
(0-10in)8.2 Subsurface fragment volume <=3"
(0-40in)4 % Subsurface fragment volume >3"
(0-40in)Not specified Ecological dynamics
The information in this ecological site description (ESD), including the state-and-transition model (STM), was developed using archaeological and historical data, professional experience, and scientific studies. The information is representative of a complex set of plant communities. Not all scenarios or plants are included. Key indicator plants, animals, and ecological processes are described to inform land management decisions.
NATURUAL DISTURBANCES
The natural (not human-related) disturbances most important for discussion in this ecological site are changes in water salinity and eolian (wind-carried) movements of sand.
Long periods of unusually high rainfall or drought may cause changes in groundwater salinity that differentially affect abundance and productivity of the plant species occurring on a site (USDA-SCS, 1972).
Movement of sand by wind will cause shifting of beaches and dunes that may cover areas of Kealia soils (USDA-SCS, 1972).
The plant species mix occurring in different examples of this ecological site appears to vary depending on water salinity, and some examples contain plant species not specially adapted to salty conditions. Some sites are situated near the ocean but at outlets of gulches emerging from the mountains, where they may receive inputs of fresher surface or ground water. Depth and salinity of the water table also will vary with distance from the ocean (U.S. Army Corps of Engineers, 1981).
Before the arrival of humans, the only grazing animals on the island were land birds up to the size of large geese (Henke, 1929).
HUMAN DISTURBANCES
Human-related disturbances have been more important than natural disturbances in this ecological site since the arrival of Polynesians and, later, Europeans. This is reflected in the state-and-transition model diagram.
Humans arrived in the Hawaiian Islands 1,200 to 1,500 years ago. Their population gradually increased so that by 1,600 A.D. at least 80 percent of all the lands in Hawaii below about 1,500 feet (roughly 457 meters) in elevation had been extensively altered by humans (Kirch, 1982); some pollen core data suggest that up to 100 percent of lowlands may have been altered (Athens, 1997). By the time of European contact late in the 18th century, the Polynesians had developed high population densities and placed extensive areas under intensive agriculture (Cuddihy and Stone, 1990).
This ecological site may have been affected by construction of fishponds, inadvertently introduced plant diseases, seed predation by the introduced Pacific rat, and siltation caused by soil erosion and movement connected with cultivation or burning of surrounding lands.
After the arrival of Europeans, documentary evidence attests to accelerated and extensive deforestation, erosion, siltation, and changes in local weather patterns (Kirch, 1983) due to more intensive land use, modern tools, and introduction of more plant, animal, and microbe species.
The Polynesians introduced dogs, Pacific rats, and small pigs to the islands. Cattle, sheep, horses, goats, and larger European pigs were introduced in the final decades of the 18th century. These animals ranged free on the islands, becoming very numerous and destructive by the early decades of the 19th century. By 1851, records reported severe overstocking of pastures, lack of fences, and large numbers of feral livestock (Henke, 1929). This would have resulted in consumption of native plants and physical disturbance of sites by wallowing and hoof action.
Through the 20th and into the 21st centuries, increases in human populations with attendant land development, as well as accelerated introduction of non-native mammals, birds, reptiles, amphibians, invertebrates, plants, and microorganisms, have brought about dramatic changes to wild ecosystems in Hawaii.
The heaviest impacts in this ecological site have been caused by domestic and feral ungulates grazing and browsing native vegetation, none of which evolved with land mammals of any kind except for a native bat. This ecological site has been invaded by introduced plant species that have displaced native plants to a large extent.
Some examples of this ecological site may be affected by salinity changes due to interference by intervening coastal highways with entry of tidal ocean water and drainage of fresher ground water.State and transition model
Custom diagramStandard diagram
Figure 1. State-and-transition model diagram for the Aquisalids Herbland Ecological Site (R166XY003HI).
More interactive model formats are also available. View Interactive Models
Click on state and transition labels to scroll to the respective textT1A - The Reference State (1) transitions to the Weed Invaded State (2) by gradual invasion and replacement of native species by introduced plant species. T1B - The Reference State (1) transitions to the Grazed and Browsed State (3) with the introduction of livestock forage species by either purposeful introduction or incidental spread from neighboring areas. R2A - The Weed Invaded State (2) may be restored to the Reference State (1) by excluding all ungulates with a suitably designed fence. Weed control must be done initially and continued in the long term. Missing native plant species must then be reintroduced. R2B - Careful grazing management to favor desired forage species, along with weed control, can restore the Weed Invaded State (2) to the Grazed and Browsed State (3). R3A - Permanent exclusion of livestock and feral ungulates, intensive and long-term weed control, and replanting of native plant species can be applied to restore the Grazed and Browsed State (3) to a facsimile of the Reference State (1). T3A - Grazing and browsing intensity and duration that exceeds the modest production of preferred forage species causes a transition from the Grazed and Browsed State (3) to the Weed Invaded State (2). State 1 submodel, plant communities
State 2 submodel, plant communities
State 3 submodel, plant communities
State 1
Reference StateThe Reference State (1) consists of one community phase. Some of this ecological site is of marginal value as grazing land. Disturbance by introduced ungulates results in replacement of native plant species by introduced species, causing a transition to the Grazed and Browsed State (3). Gradual invasion by introduced species results in a transition to the Weed Invaded State (2).
Community 1.1
Hawai'i Desert-Thorn (Ohelo Kai)/Shoreline Seapurselane (Akulikuli) – Salt Heliotrope
Figure 2. State 1.1 Reference. While the indigenous plant Akulikuli or shoreline seapurslane (Sesuvium portulacastrum) is the most abundant forb the introduced shrub Pluchera indica is the most abundant shrub.
Figure 3. Post fire installation of Akuluikuli, Ma'o, and Aweoweo at Kealia NWR. Kiawe trees killed by fire had been masticated on site to provide weed control and mulch. Golden beard crown and other weeds were hand pulled.
This community phase is dominated by the mat-forming forb (herb) shoreline seapurslane or akulikuli (Sesuvium portulacastrum) along with the forb salt heliotrope (Heliotropium curassavicum). The shrub Hawai’i desert-thorn or ohelo kai (Lycium sandwicense) is also common. Other native coastal shrubs, forbs, vines, grasses, sedges, and rushes that are capable of living in a variably saline environment are also present. Very small, localized elevation differences will cause localized changes in the plant community. The lowest elevation and most poorly drained locations may support no vegetation (Browning et al., 2019; US Army Corps of Engineers, 1981; Wagner et al., 1999).
Typically, no trees are present. Shrubs that may be encountered are Hawai'i desert-thorn or ohelo kai (Lycium sandwicense), beach naupaka, or naupaka kahakai (Scaevola sericea), Hawai’ian cotton or mao (Gossypium tomentosum), Florida hopbush or aalii (Dodonaea viscosa), naio (Myoporum sandwicense), Oahu riverhemp or ohai (Sesbania tomentosa), yellow ‘ilima (Sida fallax), and roundleaf chasetree, pohinahina, or kolokolo kahakai (Vitex rotundifolia). Shoreline seapurslane or akulikuli (Sesuvium portulacastrum) is the most abundant forb; salt heliotrope (Heliotropium curassavicum) is common. Common grasses or grasslike species (grasses, sedges, and rushes) are cosmopolitan bulrush or kaluha (Bolboschoenus maritimus), smooth flatsedge or makaloa or (Cyperus laevigatus), hurricanegrass or mauu akiaki (Fimbristylis cymosa), and seashore dropseed or akiaki (Sporobolus virginicus) (Browning et al., 2019; US Army Corps of Engineers, 1981; Wagner et al., 1999).Dominant plant species
-
Hawai'i desert-thorn (Lycium sandwicense), shrub
-
shoreline seapurslane (Sesuvium portulacastrum), other herbaceous
-
salt heliotrope (Heliotropium curassavicum), other herbaceous
State 2
Weed Invaded StateThe Weed Invaded State (2) consists of one community phase. It differs from the Reference State (1) by containing few to no native plant species because invasion by introduced plant species. It contains few species that are valuable as livestock forage.
Community 2.1
Kiawe/Indian Camphorweed (Indian Fleabane)/Turtleweed (Pickleweed)
This community phase is primarily dominated by forbs but introduced shrubs and an introduced tree species are common. At slightly raised elevations or where additional freshwater inflows occur, a wider variety of introduced plant species is present.
Kiawe (Prosopis pallida) trees are typically present. Where conditions are less saline, white leadtree or koa haole (Leucaena leucocephala) is also present. The understory is dominated by the introduced forb turtleweed or pickleweed (Batis maritima). Fivehorn smotherweed (Bassia hyssopifolia) is another common forb. Garden lettuce (Lactuca sativa) occurs at slightly higher microelevations. Common introduced shrubs are Indian Camphorweed or Indian fleabane (Pluchea indica), cure for all or sourbush (Pluchea carolinensis), and their cross, Pluchea x fosbergii, Australian saltbush (Atriplex semibaccata), and Atriplex suberecta (peregrine saltbush). At varying microelevations, the grasses Bermudagrass (Cynodon dactylon), pitted beardgrass (Bothriochloa pertusa), buffelgrass (Pennisetum ciliare), seashore Paspalum (Paspalum vaginatum), southern sandbur (Cenchrus echinatus), and swollen fingergrass (Chloris barbata) may occur. Guineagrass (Urochloa maxima) occurs in less saline locations receiving additional freshwater inputs (Browning et al., 2019; US Army Corps of Engineers, 1981; Wagner et al., 1999).Dominant plant species
-
kiawe (Prosopis pallida), tree
-
Indian camphorweed (Pluchea indica), shrub
-
turtleweed (Batis maritima), other herbaceous
State 3
Grazed and Browsed StateThe Grazed and Browsed State (3) is dominated by introduced plant species. It has been managed to favor production of desirable forage species.
Community 3.1
Kiawe/Australian Saltbush/Turtleweed (Pickleweed)This community is dominated by introduced shrubs that have value as browse species. Forage grasses are present in locations where salinity and drainage allow significant production.
The overstory consists of an open to closed canopy of kiawe trees (Prosopis pallida), the seedpods of which are forage for livestock. In less saline locations, white leadtree or koa haole (Leucaena leucocephala) provides pods and browse. Australian saltbush (Atriplex semibaccata) is dominant shrub which can be a useful browse species. Turtleweed or pickleweed (Batis maritima) is the dominant ground level plant; it provides some poor-quality forage. In less saline locations, guineagrass (Urochloa maxima), buffelgrass (Pennisetum ciliare), and Bermudagrass (Cynodon dactylon) provide some forage if carefully managed (Browning et al., 2019; US Army Corps of Engineers, 1981; Wagner et al., 1999).Dominant plant species
-
kiawe (Prosopis pallida), tree
-
Australian saltbush (Atriplex semibaccata), shrub
-
turtleweed (Batis maritima), other herbaceous
Transition T1A
State 1 to 2The Reference State (1) transitions to the Weed Invaded State (2) by gradual invasion and replacement of native species by introduced plant species.
Transition T1B
State 1 to 3The Reference State (1) transitions to the Grazed and Browsed State (3) with the introduction of livestock forage species by either purposeful introduction or incidental spread from neighboring areas.
Restoration pathway R2A
State 2 to 1The Weed Invaded State (2) may be restored to the Reference State (1) by excluding all ungulates with a suitably designed fence. Weed control must be done initially and continued in the long term. Missing native plant species must then be reintroduced.
Restoration pathway R2B
State 2 to 3Careful grazing management to favor desired forage species, along with weed control, can restore the Weed Invaded State (2) to the Grazed and Browsed State (3).
Restoration pathway R3A
State 3 to 1Permanent exclusion of livestock and feral ungulates, intensive and long-term weed control, and replanting of native plant species can be applied to restore the Grazed and Browsed State (3) to a facsimile of the Reference State (1).
Transition T3A
State 3 to 2Grazing and browsing intensity and duration that exceeds the modest production of preferred forage species causes a transition from the Grazed and Browsed State (3) to the Weed Invaded State (2).
Additional community tables
Table 6. Community 1.1 plant community composition
Group Common name Symbol Scientific name Annual production () Foliar cover (%) Table 7. Community 2.1 plant community composition
Group Common name Symbol Scientific name Annual production () Foliar cover (%) Table 8. Community 3.1 plant community composition
Group Common name Symbol Scientific name Annual production () Foliar cover (%) Interpretations
Supporting information
Other references
REFERENCES for R166XY003HI Aquisalids Herbland
Athens, J.S. (1997). Prehistoric environmental and landscape change. In Kirch, P.V. & T.L. Hunt (Eds.), Hawai’ian native lowland vegetation in the Pacific Islands (Pgs. 248 -270). Yale University Press. [https://www.pelagicos.net/BIOL3010/readings/Athens_1997.pdf].
Browning J.H., Reeves M., Amidon F., Stephen Miller, and Charrier J.C. (2019). Hawai'i: The wetland system of Hawai'i. Elsevier Inc.
Cuddihy, L.W., & C.P. Stone. (1990). Alteration of native Hawai’ian vegetation: Effects of humans, their activities and introductions. University of Hawaii Cooperative National Park Resources Study Unit.
Department of Land and Natural Resources (2024). Hawai’i State Aha Moku. [https://dlnr.hawaii.gov/ahamoku/councils/].
Giambelluca, T.W., Q. Chen, A.G. Frazier, J.P. Price, Y.L. Chen, P.-S. Chu, J.K. Eischeid, & D.M. Delparte. (2013): Online rainfall atlas of Hawai’i. Bull. Amer. Meteor. Soc. 94, 313-316, DOI: [https://doi.org/10.1175/BAMS-D-11-00228.1].
Giambelluca, T.W., X. Shuai, M.L. Barnes, R.J. Alliss, R.J. Longman, T. Miura, Q. Chen, A.G. Frazier, R.G. Mudd, L. Cuo, & A.D. Businger. (2014). Evapotranspiration of Hawai’i. Final report submitted to the U.S. Army Corps of Engineers - Honolulu District, and the Commission on Water Resource Management, State of Hawai’i. [https://www.hawaii.edu/climate-data-portal/evapotranspiration-atlas/].
Handy, E.S.C., E.G. Handy, & Pukui, M.K. (First Edition 1972, Revised Edition 1991). Native planters in old Hawai’i: Their life, lore, and environment. Bishop Museum Press.
Henke, L.A. (1929). A survey of livestock in Hawai’i. Research Publication No. 5. University of Hawai’i, Honolulu. [https://www.ctahr.hawaii.edu/oc/freepubs/pdf/RP-5.pdf].
Juvik, J.O., & Nullett, D. (1993). A climate transect through tropical montane rain forests in Hawai’i. Department of Geography, University of Hawai’i at Hilo, Hilo Hawai’i. Journal of Applied Meteorology. Volume 33.
Kirch, P.V. (1982). The impact of the prehistoric Polynesians in the Hawai’ian ecosystem. Pacific Science 36 (1):1-14.
Kirch, P.V. (1983). Introduction. In Archaeological investigations of the Mudlane-Waimea-Kawaihae Road Corridor, Island of Hawai’i: An Interdisciplinary Study of an Environmental Transect. Clark, J.T. and Kirch, P.V., eds. Dept. of Anthropology, Bernice Pauahi Bishop Museum, Report 83-1, Honolulu, HI.
Leopold, L.B. (1949). The interaction of trade wind and sea breeze, Hawai’i. Journal of Meteorology 6: 312-320.
Malo, D. (1903). Hawaiian antiquities. N.B. Emerson (trans.). Bishop Museum Special Publication 2. Honolulu.
Sanderson, M. (ed.). (1993). Prevailing trade winds, weather and climate in Hawai’i. University of Hawai’i Press. Honolulu.
U.S. Army Corps of Engineers, Honolulu District. (1981). A guide to Pacific wetland pants. L. Stemmermann, ed. Wetland plants for Hawaii and U.S.-affiliated Pacific islands.
U.S. Department of Agriculture, Natural Resources Conservation Service. (2006). Land resource regions and major land resource areas of the United States, the Caribbean, and the Pacific Basin. United States Department of Agriculture, Agriculture Handbook 296. [https://www.nrcs.usda.gov/sites/default/files/2022-10/AgHandbook296_text_low-res.pdf].
U.S. Department of Agriculture, Soil Survey Conservation Service. (1972). Soil survey of Islands of Kauai, Oahu, Maui, Molokai, and Lanai, State of Hawai’i. Foote D.E., Hill E.L., Nakamura S., & F. Stephens, in cooperation with The University of Hawai’i Agricultural Experiment Station.
U. S. Department of Interior, Fish & Wildlife Service. (2023). Download seamless wetlands data by state. National Wetlands Inventory website. U.S. Department of the Interior, Fish and Wildlife Service, Washington, D.C. Accessed April 24, 2024. [https://www.fws.gov/program/national-wetlands-inventory/download-state-wetlands-data].
U.S. Department of Interior, Geological Survey. (2006). A Gap analysis of Hawai’i: February 2006 final report. National gap analysis program. [https://catalog.lib.uchicago.edu/vufind/Record/6329681/Details].
U.S. Department of Interior, Geological Survey. (2019). National Hydrography Dataset (NHD) – USGS national map downloadable data collection: USGS – National Geospatial Technical Operations Center (NGTOC). [https://www.usgs.gov/national-hydrography/access-national-hydrography-products].
Wagner, W.L., D.R. Herbst, & S.H. Sohmer. (1999). Manual of the flowering plants of Hawai’i, Revised Edition. Bishop Museum Press, Honolulu.
Western Regional Climate Center, (2020). Climate of Hawai’i. Available: [https://wrcc.dri.edu/Climate/narrative_hi.php].
DEFINITIONS
Alluvial: Materials or processes associated with transportation and/or deposition by running water.
Aquic soil moisture regime: A regime in which the soil is free of dissolved oxygen because it is saturated by water. This regime typically exists in bogs or swamps.
Aquisalids: These are salty soils in wet areas. Although wet, the dissolved salts make the soils physiologically dry (the chemical activity, or effective concentration, of water is low). Aquisalids typically support plant species that are adapted to these conditions.
Aridic soil moisture regime: A regime in which defined parts of the soil are, in normal years, dry for more than half of the growing season and moist for less than 90 consecutive days during the growing season. In Hawaii it is associated with hot, dry areas with plants such as kiawe, wiliwili, and buffelgrass. The terms aridic and torric are basically the same.
Available water capacity: The amount of soil water available to plants to the depth of the first root-restricting layer.
CaCO3 equivalent: The amount of free lime in a soil. Free lime exists as solid material and typically occurs in regions with a dry climate.
Canopy cover: The percentage of ground covered by the vertical projection downward of the outermost perimeter of the spread of plant foliage. Small openings within the canopy are included.
Community pathway: A description of the causes of shifts between community phases. A community pathway is reversible and is attributable to succession, natural disturbances, short-term climatic variation, and facilitating practices, such as grazing management.
Community phase: A unique assemblage of plants and associated dynamic soil properties within a state.
Dominant species: Plant species or species groups that exert considerable influence upon a community due to size, abundance, or cover.
Drainage class: The frequency, duration, and depth of a water table in a soil. There are seven drainage classes, ranging from “excessively drained” (soils with very rare or very deep-water tables) to “well drained” (soils that provide ample water for plant growth but are not so wet as to inhibit root growth) to “very poorly drained” (soils with a water table at or near the surface during much of the growing season that inhibits growth of most plants).
Electrical conductivity (EC): A measure of the salinity of a soil. The standard unit is deciSiemens per meter (dS/m), which is numerically equivalent to millimhos per centimeter (mmhos/cm). An EC greater than about 4 dS/m indicates a salinity level that is unfavorable to growth of most plants.
Isohyperthermic soil temperature regime: A regime in which mean annual soil temperature is 72 degrees F (22 degrees C) or higher and mean summer and mean winter soil temperatures differ by less than 11 degrees F (6 degrees C) at a specified depth.
Isomesic soil temperature regime: A regime in which mean annual soil temperature is 47 degrees F (8 degrees C) or higher but lower than 59 degrees F (15 degrees C) and mean summer and mean winter soil temperatures differ by less than 11 degrees F (6 degrees C) at a specified depth.
Isothermic soil temperature regime: A regime in which mean annual soil temperature is 59 degrees F (15 degrees C) or higher but lower than 72 degrees F (22 degrees C) and mean summer and mean winter soil temperatures differ by less than 11 degrees F (6 degrees C) at a specified depth.
Major Land Resource Area (MLRA): A geographic area defined by NRCS that is characterized by a particular pattern of soils, climate, water resources, and land uses. The island of Hawaii contains nine MLRAs, some of which also occur on other islands in the state.
Mollisols: Soils with relatively thick, dark surface horizons, high cation-exchange capacity, high calcium content, that do not become hard or very hard when dry. Mollisols are conducive to plant growth. They characteristically form under grass in climates that are seasonally dry, but can form under forests.
Naturalized plant community: A community dominated by adapted, introduced species. It is a relatively stable community resulting from secondary succession after disturbance. Most grasslands in Hawaii are in this category.
Parent material: Unconsolidated and chemically weathered material from which a soil is developed.
pH: The numerical expression of the relative acidity or alkalinity of a soil sample. A pH of 7 is neutral; a pH below 7 is acidic and a pH above 7 is basic.
Reference community phase: The phase exhibiting the characteristics of the reference state and containing the full complement of plant species that historically occupied the site. It is the community phase used to classify an ecological site.
Reference state: A state that describes the ecological potential and natural or historical range of variability of an ecological site.
Restoration pathway: A term describing the environmental conditions and practices that are required to recover a state that has undergone a transition.
Sodium adsorption ratio (SAR): A measure of the amount of dissolved sodium relative to calcium and magnesium in the soil water. SAR values higher than 13 create soil conditions unfavorable to most plants.
Soil moisture regime: A term referring to the presence or absence either of ground water or of water held at a tension of less than 1500 kPa (the crop wilting point) in the soil or in specific horizons during periods of the year.
Soil temperature regime: A defined class based on mean annual soil temperature and on differences between summer and winter temperatures at a specified depth.
Soil reaction: Numerical expression in pH units of the relative acidity or alkalinity or a soil.
State: One or more community phases and their soil properties that interact with the abiotic and biotic environment to produce persistent functional and structural attributes associated with a characteristic range of variability.
State-and-transition model: A method used to display information about relationships between vegetation, soil, animals, hydrology, disturbances, and management actions on an ecological site.
Torric soil moisture regime: See Aridic soil moisture regime.
Transition: A term describing the biotic or abiotic variables or events that contribute to loss of state resilience and result in shifts between states.
Ustic soil moisture regime: A regime in which moisture is limited but present at a time when conditions are suitable for plant growth. In Hawaii it usually is associated with dry forests and subalpine shrublands.Contributors
David Clausnitzer
John Proctor
Carolyn Auweloa
Kendra Moseley
Amy Koch
Mathew Cocking
Ann Tan
Sarah Quistberg
Daniel Bowman
Jennifer FedenkoApproval
Kendra Moseley, 5/08/2025
Acknowledgments
Assistance, advice, review, and/or insights: Bret Wolfe, Kealia National Wildlife Refuge (USDI) Joshua Lewis, Kealia National Wildlife Refuge(USDI). Randy Bartlett, Puu Kukui Watershed Preserve Alison Cohan, The Nature Conservancy Michael Constantinides, NRCS-PIA Gordon Cran, Kapapala Ranch Diana Crow, Ulupalakua Ranch Lance DeSilva, Hawaii DLNR Kerri Fay, Waikamoi Preserve, The Nature Conservancy Alex Franco, Kaupo Ranch Ranae Ganske-Cerizo, NRCS Carl Hashimoto, NRCS Bob Hobdy, consultant, Maui Wallace Jennings, NRCS Mel Johansen, The Nature Conservancy Jordan Jokiel, Haleakala Ranch David Leonard, volunteer Penny Levin Reese Libby, GIS - NRCS Hannah Lutgen, Maui SWCD Joseph May, NRCS Scott Meidel, Haleakala Ranch Anna Palomino, Hoolawa Farms Inc. Jon Price, USGS Tamara Sherrill, USFWS, Maui Nui Botanical Garden Amber Starr, Hana Ranch Kahana Stone, NRCS Mark Vaught, Water Resources, Alexander & Baldwin Jacqueline Vega, NRCS Rich von Wellsheim, Whispering Bamboos, Kipahulu
Rangeland health reference sheet
Interpreting Indicators of Rangeland Health is a qualitative assessment protocol used to determine ecosystem condition based on benchmark characteristics described in the Reference Sheet. A suite of 17 (or more) indicators are typically considered in an assessment. The ecological site(s) representative of an assessment location must be known prior to applying the protocol and must be verified based on soils and climate. Current plant community cannot be used to identify the ecological site.
Author(s)/participant(s) Contact for lead author Date 09/23/2026 Approved by Approval date Composition (Indicators 10 and 12) based on Annual Production Indicators
-
Number and extent of rills:
-
Presence of water flow patterns:
-
Number and height of erosional pedestals or terracettes:
-
Bare ground from Ecological Site Description or other studies (rock, litter, lichen, moss, plant canopy are not bare ground):
-
Number of gullies and erosion associated with gullies:
-
Extent of wind scoured, blowouts and/or depositional areas:
-
Amount of litter movement (describe size and distance expected to travel):
-
Soil surface (top few mm) resistance to erosion (stability values are averages - most sites will show a range of values):
-
Soil surface structure and SOM content (include type of structure and A-horizon color and thickness):
-
Effect of community phase composition (relative proportion of different functional groups) and spatial distribution on infiltration and runoff:
-
Presence and thickness of compaction layer (usually none; describe soil profile features which may be mistaken for compaction on this site):
-
Functional/Structural Groups (list in order of descending dominance by above-ground annual-production or live foliar cover using symbols: >>, >, = to indicate much greater than, greater than, and equal to):
Dominant:
Sub-dominant:
Other:
Additional:
-
Amount of plant mortality and decadence (include which functional groups are expected to show mortality or decadence):
-
Average percent litter cover (%) and depth ( in):
-
Expected annual annual-production (this is TOTAL above-ground annual-production, not just forage annual-production):
-
Potential invasive (including noxious) species (native and non-native). List species which BOTH characterize degraded states and have the potential to become a dominant or co-dominant species on the ecological site if their future establishment and growth is not actively controlled by management interventions. Species that become dominant for only one to several years (e.g., short-term response to drought or wildfire) are not invasive plants. Note that unlike other indicators, we are describing what is NOT expected in the reference state for the ecological site:
-
Perennial plant reproductive capability:
Print Options
Sections
Font
AAAAOther
PrintThe Ecosystem Dynamics Interpretive Tool is an information system framework developed by the USDA-ARS Jornada Experimental Range, USDA Natural Resources Conservation Service, and New Mexico State University.
Accessibility statement