
Natural Resources
Conservation Service
Ecological site F152BY014TX
Poorly Drained Clayey Bottomland
Last updated: 9/22/2023
Accessed: 09/21/2026
-
Search


Major Land Resource Area or ecological site by name and/or ID.
PreviousSectionsNextGeneral information
Provisional. A provisional ecological site description has undergone quality control and quality assurance review. It contains a working state and transition model and enough information to identify the ecological site.
Click to explore map
Figure 1. Mapped extent
Areas shown in blue indicate the maximum mapped extent of this ecological site. Other ecological sites likely occur within the highlighted areas. It is also possible for this ecological site to occur outside of highlighted areas if detailed soil survey has not been completed or recently updated.
MLRA notes
Major Land Resource Area (MLRA): 152B–Western Gulf Coast Flatwoods
Major Land Resource Area (MLRA) 152B, Western Gulf Coast Flatwoods, is in eastern Texas and western Louisiana. Locally termed the Flatwoods, the area is dominated by coniferous forest covering 5,681 square miles (14,714 square kilometers). The region is a hugely diverse transition zone between the northern and eastern mixed forests and southern and western coastal prairies and grasslands.
Classification relationships
Major Land Resource Area (MLRA) (USDA-Natural Resources Conservation Service, 2006)
Ecological site concept
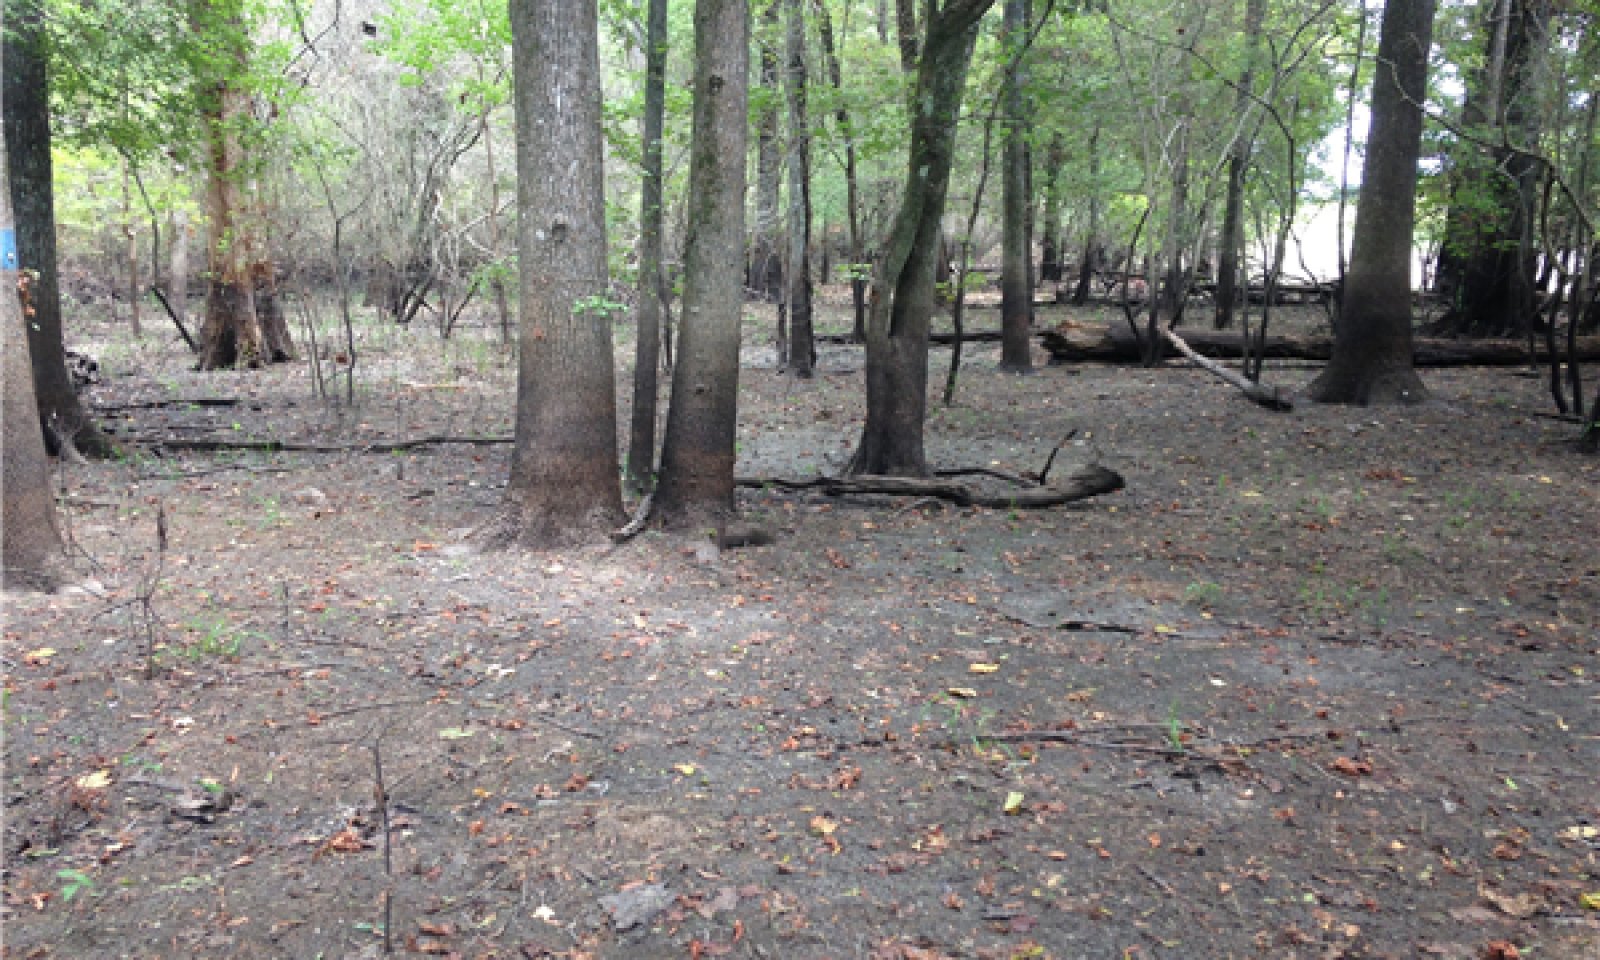
The Poorly Drained Clayey Bottomland ecological site has very deep, somewhat poorly drained soils that are flooded occasionally to frequently. The site is typically flooded for long periods during normal rainfall years. They will stay flooded starting in November and ending in May. The clay-textured soils combined with the flooding frequency form the plant community.
Associated sites
F152BY004TX Clayey Flat
Soils are clayey throughout and on a higher landform.
F152BY005TX Seasonally Wet Loamy Upland
Soils are loamy and on a higher landform.
F152BY006TX Well Drained Loamy Upland
Soils are well drained, loamy, and on a higher landform.
F152BY007TX Poorly Drained Loamy Upland
Soils are on a higher landform.
F152BY012TX Well Drained Bottomland
Soils are better drained.
F152BY013TX Poorly Drained Loamy Bottomland
Soils are loamy throughout.
F152BY011TX Swamp
Soils are in a lower depressional landform that remains ponded after flood events.
Similar sites
F152BY012TX Well Drained Bottomland
Soils are better drained.
F152BY004TX Clayey Flat
Soils are on a higher landform and not flooded for extended periods.
F152BY011TX Swamp
Soils are semi-permanently ponded.
F152BY013TX Poorly Drained Loamy Bottomland
Soils are loamy throughout.
Table 1. Dominant plant species
Tree (1) Quercus nigra
(2) Quercus lyrataShrub Not specified
Herbaceous (1) Carex
(2) CyperusPhysiographic features
The ecological site includes areas on nearly level soils in flood plains adjacent to rivers, channels, and streams. Flooding ranges from occasionally to frequently during the months of November through June. The flooding does not saturate the soils enough to become ponded. Also during the same months, a water table will be present with a top depth of 20 to 46 inches. The depth will deepen during the warmer months of the year. Slope is 0 to 1 percent. Elevation ranges from 20 to 100 feet.
Table 2. Representative physiographic features
Landforms (1) River valley > Flood plain
Runoff class High Flooding duration Brief (2 to 7 days) to long (7 to 30 days) Flooding frequency Occasional to frequent Ponding frequency None Elevation 20 – 150 ft Slope 0 – 1 % Water table depth 20 – 46 in Aspect Aspect is not a significant factor Climatic features
The Western Gulf Coast Flatwoods (MLRA 152B) is within the humid subtropical climate zone. The region boasts one of the highest rainfall averages in the southern United States, over 60 inches (152 centimeters) annually. This is due to the gulf currents that carry humid air to the region, where it condenses and precipitates. Rainfall averages are fairly consistent month by month, ranging from the lowest of 3.5 inches (8.9 centimeters) in March and the highest of 5.6 inches (14.3 centimeters) in June.
The area is prone to severe thunderstorms and tornadoes when the proper conditions exist, generally in the springtime. Sometimes excessive rainfall occurs, leading to flooding. Hurricanes also strike the region, generally in late summer or early fall. These extreme weather events can be quite destructive, toppling trees, and serves to naturally reset the vegetation to primary succession. The higher humidity of the region amplifies the feeling of heat during the summer. Prolonged droughts and snowfall events are rare.Table 3 Representative climatic features
Frost-free period (average) 250 days Freeze-free period (average) 290 days Precipitation total (average) 60 in BarLineFigure 2. Monthly precipitation range
BarLineFigure 3. Monthly average minimum and maximum temperature
Figure 4. Annual precipitation pattern
Figure 5 Annual average temperature pattern
Climate stations used
-
(1) DE QUINCY [USC00162361], Dequincy, LA
-
(2) CLEVELAND [USC00411810], Cleveland, TX
-
(3) ORANGE 9 N [USC00416680], Orange, TX
-
(4) WILDWOOD [USC00419754], Kountze, TX
-
(5) LIBERTY [USC00415196], Liberty, TX
-
(6) LUMBERTON [USC00415435], Silsbee, TX
-
(7) TOWN BLUFF DAM [USC00419101], Jasper, TX
-
(8) DE RIDDER [USC00162367], Deridder, LA
-
(9) ELIZABETH [USC00162800], Oakdale, LA
-
(10) OBERLIN FIRE TWR [USC00166938], Oberlin, LA
">Influencing water features
The site supports hydrophytic vegetation and the soils are hydric as long as natural flooding has not been manipulated. Onsite delineations are required as some mapped areas and locations on the peripheries may not fall within the United States Army Corps of Engineers (USACOE) definition of a wetland.
Wetland description
The soils in this site are hydric. Some areas are non-hydric. These areas are typically where flooding frequency is occasional and duration is not long, while some areas have soils in a higher landform and are not hydric. Onsite investigation is needed to determine the local conditions.
Soil features
The soils of this site are deep and characterized by clay horizons throughout the entire soil profile, measured to 80 inches. The clay has shrink-swell properties causing movement and cracking when dried, indicative of the vertisols soil order. All of the horizons are black to dark gray with the lower subsoil horizons exhibiting the gray as a result of anaerobic conditions while being saturated with water. The surface layer is darkest and the underlying subsoil layers are distinguished by color, amount of iron manganese nodules, redox concentrations, and eventually begin to find carbonates below 52 inches (132 centimeters). Kaman and Simelake are the representative soils and consist of very deep, somewhat poorly drained soils that formed in clayey alluvial deposits. The series are classified as a very-fine, smectitic, thermic Oxyaquic Hapludert and as a fine, smectitic, thermic Aeric Dystraquert, respectively.
Table 4. Representative soil features
Parent material (1) Alluvium – igneous, metamorphic and sedimentary rock
Surface texture (1) Clay
(2) Silty clay
Family particle size (1) Fine
Drainage class Somewhat poorly drained Permeability class Moderate to very slow Soil depth 80 in Surface fragment cover <=3" Not specified Surface fragment cover >3" Not specified Available water capacity
(0-60in)8 – 9 in Calcium carbonate equivalent
(20-60in)0 – 5 % Electrical conductivity
(0-60in)0 – 2 mmhos/cm Sodium adsorption ratio
(0-60in)0 – 6 Soil reaction (1:1 water)
(0-60in)3.5 – 6.5 Subsurface fragment volume <=3"
(Depth not specified)Not specified Subsurface fragment volume >3"
(Depth not specified)Not specified Ecological dynamics
The information in this ecological site description (ESD), including the state-and-transition model (STM), was developed using archeological and historical data, professional experience, and scientific studies. The information is representative of a complex set of plant communities. Not all scenarios or plants are included. Key indicator plants, animals, and ecological processes are described to inform land management decisions.
Introduction – In southeastern Texas and southwestern Louisiana the transition from coastal grasslands to the large expanse of coniferous forest has been deemed the “Flatwoods”. As the name suggests, the region is relatively flat and, with many transitional areas, highly diverse in flora and fauna. Historically, the area was covered by pines with mixed hardwoods, sparse shrubs, and a diverse understory of grasses and forbs. Fire and drainage patterns play a significant role in shaping the plant communities and their development. Fire suppression, drainage alterations, and land conversion have reduced the amount of historical communities in existence today.
Background – Prior to settlement by the Europeans, the reference state for the Poorly Drained Clayey Bottomlands were Water Oak/Overcup Oak Forests. Remnants of this presumed historic plant community still exist where natural conditions are intact. Evidence of the reference state is found in accounts of early historic explorers to the area, historic forest and biological survey teams, as well as recent ecological studies in the last 30 years. The age of this community varies and supports a diverse flora.
Settlement Management – As human settlement increased throughout the area, so did the increase in logging and grazing by domestic livestock. The logging became so extensive that by the 1930’s most of the region had been cut-over. Replanting trees to historic communities was not common and early foresters began planting loblolly pine (Pinus taeda) for its quick growth. As more people colonized they began suppressing fire, which allowed dense thickets of shrubs to replace the herbaceous understory. While this is typical for most of the region, unless the drainage patterns were altered in the swamp areas, they have retained their natural species makeup and loblolly is not often seen in the swamps.
Current Management and State – Today much of the historic forest is gone, replaced by pine plantations, crops, and pastures. The areas that were not converted have been fire-suppressed so long that loblolly pine and fire intolerant hardwoods populate the overstory structure. Currently, federally-managed properties are the best place to view the remnant sites (National Park Service, U.S. Fish and Wildlife Service, etc.). Some private individuals have begun restoring communities through selective tree planting and retention of communities that remain. Other restoration efforts include mimicking natural-disturbance regimes through gap-phase regeneration on plantation sites.
Fire Regimes – Fire was a natural and important disturbance throughout the region. Fire occurred naturally from lightning strikes, by Native Americans for game movement, and eventually early European settlers. Fires throughout the Flatwoods occurred at two different times. Early in the year, they would occur during late winter and early spring, removing senescent vegetation, recycling nutrients and minerals, and spurring new plant growth. Late summer and early fall fires occurred as well, but with a different community effect. Summer fires burned hotter and with more intensity, greatly suppressing the shrub canopy layer. The summer fires also shifted the ecological site transitional state by decreasing grass densities and increasing forb densities. The topography, fuel loads, and other conditions caused patchy burns throughout the region resulting in mosaic patterns of plant communities and a heterogeneous landscape. Fire naturally would have occurred very infrequently (once every 25 to 50 years) and only when conditions were extremely droughty.
Disturbance Regimes – Extreme weather events occur occasionally throughout the region. Tornados uproot trees and open canopies in the spring months. In the late summer and early fall, hurricanes or tropical depressions can make landfall, dumping excessive amounts of rain and toppling trees with high winds. Another cause of large canopy openings is the effects of the southern pine beetle (Dendroctonus frontalis). Starting in the late 1950’s, beetle outbreaks have occurred every 6 to 9 years (although a major attack has not occurred in some time); usually when the trees are stressed due to multiple environmental factors. Flooding is the disturbance that affects the bottomland sites most often. The amount and timing of flooding events shapes the plant communities by allowing only species adapted to the hydrologic conditions to thrive.State and transition model
More interactive model formats are also available. View Interactive Models
Click on state and transition labels to scroll to the respective textEcosystem states
T1A - Introduction of Chinese tallow and/or other non-native species T1B - harvest by clearcut and planted to a monoculture of hardwood trees R2A - Mechanical and/or chemical control of Chinese tallow and/or other non-natives T2A - harvest by clearcut and planted to a monoculture of hardwoods R3A - Selective harvest coupled with the reintroduction of native species State 1 submodel, plant communities
State 2 submodel, plant communities
State 3 submodel, plant communities
State 1
ReferenceThe Poorly Drained Clayey Bottomland ecological site is a Water Oak/Overcup Oak forest. The deep clayey soils are poorly drained and support hydrophytic vegetation. The overstory is moderate to heavy from 75 to 95 percent canopy cover. The basal areas are high, from 80 to over 100 square feet per acre. Fire is infrequent, occurring at intervals greater than 20 years apart, typically when lengthy dry periods occur. The dominant force in shaping the ecosystem is the flooding regimes. When flooding saturates the soil, water does not allow oxygen to flow through the soil, causing anoxic conditions. Some soil indicators include: gleyed (grey) colors with redoximorphic features (reds and yellow intermixed) and manganese nodules. The understory vegetation has adapted to the seasonally anaerobic conditions are dominant. The USACOE classifies plants that occur in wetlands with an estimated probability greater than 99 percent obligate (OBL), and those 67 to 99 percent facultative wetland (FACW) plants. Facultative wet wetland plants are the most common encountered throughout the bottomlands, with obligate plants found in the longer flooded areas and facultative wetland plants found on the peripheries.
Dominant plant species
-
water oak (Quercus nigra), tree
-
overcup oak (Quercus lyrata), tree
Community 1.1
Water Oak/Overcup Oak Forest
Common overstory trees are water oak (Quercus nigra), overcup oak (Quercus lyrata), swamp chestnut oak (Quercus michauxii), willow oak (Quercus phellos), water hickory (Carya aquatic), and black willow (Salix nigra). Common understory species are buttonbush (Cephalanthus occidentalis), smartweeds (Polygonum sp.), rushes (Juncus sp.), and a wide variety of sedges (Carex sp. and Cyperus sp.).
State 2
InvadedChinese tallow (Triadica sebifera) is an undesired, invasive species brought to the United States in 1776 (Randall & Marinelli, 1996). Rapid expansion along the gulf coastal states has allowed the species to invade many ecosystems and consequently reduce diversity. Tallow trees are known to cause gastrointestinal upset, contact dermatitis, and toxicity in livestock and humans. Mechanical and chemicals options exist as a means to control the trees.
Dominant plant species
-
Chinese tallow (Triadica sebifera), tree
Community 2.1
Exotic ThicketChinese tallow invade the ecological site via flooding events as nearby waterways transport seeds. Once settled, the seeds produce saplings viable to reproduce seeds in as little as three years. The rapid establishment immediately blocks sunlight to understory species and reduces diversity. Unabated growth quickly allows the saplings to grow into the overstory, thus changing the ecological state entirely. Reductions in size and number of all vegetative species are seen in all canopy tiers.
State 3
PlantationThe Plantation State is a result of conversion activities. The landowner has maximized silviculture production by planting a monoculture of hardwood species.
Community 3.1
Hardwood PlantationIn the immediate years following the initial plantation tree planting, the understory community will resemble the reference state (State 1). During this early growth period, the landowner will typically remove unwanted hardwoods and herbaceous plants to reduce competition with the planted pine trees. As the overstory canopy closes, less understory management is required due to sunlight restrictions to the ground layer.
Transition T1A
State 1 to 2The transition from State 1 to State 2 is a result of occupancy by Chinese tallow or other noxious weeds. Invasive plants outcompete, and eventually choke out, all other native species.
Transition T1B
State 1 to 3The transition is due to the land manager maximizing silviculture potential. Merchantable timber is harvested by clearcut, the site prepared and planted to a monoculture of hardwood trees.
Restoration pathway R2A
State 2 to 1The driver for restoration is control of Chinese tallow. Although an option, mechanical removal of the trees is difficult because they readily regrow from roots and seeds. Several chemicals methods are available, including glyphosate for cut-stump treatments, triclopyr for cut-stump and foliar treatments, imazamox for broad spectrum application, and imazapyr as a foliar spray. Many aquatic herbicides have water use restrictions and can potentially kill hardwoods, so labels and restrictions should be read carefully prior to application.
Transition T2A
State 2 to 3The transition is due to the land manager maximizing silviculture potential. Merchantable timber is harvested by clearcut. Then, the site is prepared and planted to a monoculture of hardwood trees.
Restoration pathway R3A
State 3 to 1When restoring a plantation, the land manager can either clearcut the timber and begin as in the previous example. Otherwise, gap-phase regeneration is possible through selective timber harvests. This involves replanting the desired overstory species in small openings within the current structure of the woodland. The benefit is a slow progression of restoration instead of starting from primary succession.
Additional community tables
Table 5. Community 1.1 plant community composition
Group Common name Symbol Scientific name Annual production () Foliar cover (%) Table 6. Community 1.1 forest overstory composition
Common name Symbol Scientific name Nativity Height ft Canopy cover (%) Diameter in Basal area (square ft/acre) Treewater hickory CAAQ2 Carya aquatica Native – – – 0 overcup oak QULY Quercus lyrata Native – – – 0 swamp chestnut oak QUMI Quercus michauxii Native – – – 0 water oak QUNI Quercus nigra Native – – – 0 willow oak QUPH Quercus phellos Native – – – 0 black willow SANI Salix nigra Native – – – 0 Table 7. Community 1.1 forest understory composition
Common name Symbol Scientific name Nativity Height (ft) Canopy cover (%) Grass/grass-like (Graminoids)sedge CAREX Carex Native – – flatsedge CYPER Cyperus Native – – Forb/Herbknotweed POLYG4 Polygonum Native – – lizard's tail SACE Saururus cernuus Native – – Shrub/Subshrubcommon buttonbush CEOC2 Cephalanthus occidentalis Native – – parsley hawthorn CRMA5 Crataegus marshallii Native – – swamp titi CYRA Cyrilla racemiflora Native – – possumhaw ILDE Ilex decidua Native – – Treehophornbeam OSVI Ostrya virginiana Native – – Vine/LianaAlabama supplejack BESC Berchemia scandens Native – – Virginia creeper PAQU2 Parthenocissus quinquefolia Native – – muscadine VIRO3 Vitis rotundifolia Native – – Table 8. Community 2.1 plant community composition
Group Common name Symbol Scientific name Annual production () Foliar cover (%) Table 9. Community 3.1 plant community composition
Group Common name Symbol Scientific name Annual production () Foliar cover (%) Interpretations
Wood products
These soils occur in the Woodland Suitability Group 2w6 and have a high potential for hardwood management. The 50-year site index for bottomland oaks averages 90 feet and ranges from 80 to 100 feet, depending on drainage. Although management can substantially increase yield, it should also include attention to streamside management zone considerations to protect water quality. Access and equipment operability on these soils is poor for long periods due to flooding and wetness. Harvesting and other operations may need to be suspended during these periods. Rutting during these operations can be severe due to the low strength of these soils. Flooding also makes these soils poorly suited for log landings and roads. Road construction should be limited. Planting could be difficult due to wetness and the sticky nature of these soils. Site preparation operations should be limited to the dry months and planting should be planned for the drier part of the planting season. Use of herbicides for site preparation must also take into consideration the possibility for flooding to prevent the possible contamination of surface waters.
Supporting information
Inventory data references
This site description was developed as part of the provisional ecological site initiative using historic soil survey manuscripts, available range site descriptions, and low intensity field sampling.
Type locality
Location 1: Jasper County, TX UTM zone N UTM northing 30.3569167 UTM easting -94.09225 General legal description Big Thicket National Forest – Neches Bottom Unit Other references
Ajilvsgi, G. 2003. Wildflowers of Texas. Revised edition. Shearer Publishing, Fredericksburg, TX.
Ajilvsgi, G. 1979. Wildflowers of the Big Thicket. Texas A&M University Press, College Station, TX.
Allen, J. A., B. D. Keeland, J. A. Stanturf, and A. F. Kennedy Jr. 2001. A guide to bottomland hardwood restoration. Technical report, USGS/BRD/ITR-2000-0011.
Bray, W. L. 1904. Forest resources of Texas. Bureau of Forestry Bulletin 47, Government Printing Office, Washington D.C.
Diggs, G. M., B. L. Lipscomb, M. D. Reed, and R. J. O’Kennon. 2006. Illustrated flora of East Texas. Second edition. Botanical Research Institute of Texas & Austin College, Fort Worth, TX.
Jones, S. D., J. K. Wipff, and P. M. Montgomery. 1997. Vascular plants of Texas: a comprehensive checklist including synonymy, bibliography, and index. University of Texas Press, Austin.
Liu, C., P. A. Harcombe, and I. S. Elsik. 1990. Fire study report, including Roy E. Larsen Preserve species list. Summer 1990. Department of Ecology and Evolutionary Biology, Rice University, Houston, TX.
Marks, P. L., and P. A. Harcombe. 1981. Forest Vegetation of the Big Thicket, southeast Texas. Ecological Monographs 51:287-305.
Matos, J. A. 1985. Roy E. Larsen Sandylands Sanctuary vascular plant species list. Master thesis, Stephen F. Austin University, Nacogdoches, TX.
NatureServe. 2002. International classification of ecological communities: Terrestrial vegetation of the United States. National forests in Texas final report. NatureServe, Arlington, VA.
Nixon, E. S. 2000. Trees, shrubs & woody vines of East Texas. Second edition. Bruce Lyndon Cunningham Productions, Nacogdoches, TX.
Randall, J. M., and J. Marinelli. 1996. Invasive plants: weeds of the global garden. Volume 149. Brooklyn Botanic Garden, Brooklyn, NY.
Stanturf, J. A., S. H. Schoenholtz, C. J. Schweitzer, and J. P. Shepard. 2001. Achieving restoration success: Myths in bottomland hardwood forests. Restoration Ecology, 9:189-200.
Stringham, T. K., W. C. Krueger, and P. L. Shaver. 2003. State and transition modeling: An ecological process approach. Journal of Range Management 56:106-113.
Soil Survey Staff, Natural Resources Conservation Service, United States Department of Agriculture. Soil Survey Geographic (SSURGO) Database.
Truett, J. C. 1984. Land of bears and honey: A natural history of East Texas. The University of Texas Press, Austin, TX.
Van Kley, J. E., R. L. Turner, L. S. Smith, and R. E. Evans. 2007. Ecological classification system for the national forests and adjacent areas of the West Gulf Coastal Plain. Second approximation. Stephen F. Austin University and The Nature Conservancy, Nacogdoches, TX.
USDA-NRCS Ag Handbook 296 (2006).
Vines, R. A. 1960. Trees, shrubs, and woody vines of the Southwest. University of Texas Press, Austin, TX.
Watson, G. E. 2006. Big Thicket Plant Ecology. Third Edition. University of North Texas Press, Denton, TX.Contributors
Tyson Hart
Approval
Bryan Christensen, 9/22/2023
Acknowledgments
Thanks to all involved during the preparation, sampling, and reviewing of the Flatwoods project. Thanks to Josh Berry, Dennis Brezina, Kenny Hall, Jason Hohlt, Stacey Kloesel, Ricky Lambert, Cody Langston, Mark Moseley, Ramiro Molina, Mike Oliver, Alan Peer, Sara Russell, Don Sabo, Mary Webb-Marek, and Jon Wiedenfeld for all their help.
Rangeland health reference sheet
Interpreting Indicators of Rangeland Health is a qualitative assessment protocol used to determine ecosystem condition based on benchmark characteristics described in the Reference Sheet. A suite of 17 (or more) indicators are typically considered in an assessment. The ecological site(s) representative of an assessment location must be known prior to applying the protocol and must be verified based on soils and climate. Current plant community cannot be used to identify the ecological site.
Author(s)/participant(s) Contact for lead author Date 09/21/2021 Approved by Approval date Composition (Indicators 10 and 12) based on Annual Production Indicators
-
Number and extent of rills:
-
Presence of water flow patterns:
-
Number and height of erosional pedestals or terracettes:
-
Bare ground from Ecological Site Description or other studies (rock, litter, lichen, moss, plant canopy are not bare ground):
-
Number of gullies and erosion associated with gullies:
-
Extent of wind scoured, blowouts and/or depositional areas:
-
Amount of litter movement (describe size and distance expected to travel):
-
Soil surface (top few mm) resistance to erosion (stability values are averages - most sites will show a range of values):
-
Soil surface structure and SOM content (include type of structure and A-horizon color and thickness):
-
Effect of community phase composition (relative proportion of different functional groups) and spatial distribution on infiltration and runoff:
-
Presence and thickness of compaction layer (usually none; describe soil profile features which may be mistaken for compaction on this site):
-
Functional/Structural Groups (list in order of descending dominance by above-ground annual-production or live foliar cover using symbols: >>, >, = to indicate much greater than, greater than, and equal to):
Dominant:
Sub-dominant:
Other:
Additional:
-
Amount of plant mortality and decadence (include which functional groups are expected to show mortality or decadence):
-
Average percent litter cover (%) and depth ( in):
-
Expected annual annual-production (this is TOTAL above-ground annual-production, not just forage annual-production):
-
Potential invasive (including noxious) species (native and non-native). List species which BOTH characterize degraded states and have the potential to become a dominant or co-dominant species on the ecological site if their future establishment and growth is not actively controlled by management interventions. Species that become dominant for only one to several years (e.g., short-term response to drought or wildfire) are not invasive plants. Note that unlike other indicators, we are describing what is NOT expected in the reference state for the ecological site:
-
Perennial plant reproductive capability:
Print Options
Sections
Font
AAAAOther
PrintThe Ecosystem Dynamics Interpretive Tool is an information system framework developed by the USDA-ARS Jornada Experimental Range, USDA Natural Resources Conservation Service, and New Mexico State University.
Accessibility statement


