Natural Resources
Conservation Service
Ecological site R151XY010LA
Sandy Chenier
55-64 PZ
Last updated: 3/24/2025
Accessed: 06/28/2026
-
Search


Major Land Resource Area or ecological site by name and/or ID.
PreviousSectionsNextGeneral information
Approved. An approved ecological site description has undergone quality control and quality assurance review. It contains a working state and transition model, enough information to identify the ecological site, and full documentation for all ecosystem states contained in the state and transition model.
Click to explore map
Figure 1. Mapped extent
Areas shown in blue indicate the maximum mapped extent of this ecological site. Other ecological sites likely occur within the highlighted areas. It is also possible for this ecological site to occur outside of highlighted areas if detailed soil survey has not been completed or recently updated.
MLRA notes
Major Land Resource Area (MLRA): 151X–Gulf Coast Marsh
Major land resource area (MLRA)151, Gulf Coast Marsh, is in Louisiana (95 percent), Texas (4 percent), and Mississippi (1 percent). It makes up about 8,495 square miles (22,015 square kilometers). The towns of Gretna, Chalmette, and Marrero, Louisiana, and the city of New Orleans, Louisiana, are in the eastern part of this MLRA. The town of Port Arthur, Texas, is in the western part. Interstate 10 and U.S. Highway 90 cross the area. The New Orleans Naval Air Station is in this MLRA. Fort Jackson, overlooking the mouth of the Mississippi River, and the Jean Lafitte National Historic Park and Preserve are in the MLRA. A number of national wildlife refuges and State parks occur throughout this area. MLRA 151 is a very complex ecosystem with active deltaic development and subsidence with extreme anthropogenic impact by man with construction of flood protection levees and channelization occurring on the eastern portion of the MLRA. The Western portion of the MLRA is more stable in that portions of the landscape is protected naturally by the Chenier's, although there is Anthropogenic affects of the interior due to channelization for navigation.
Classification relationships
Major Land Resource Area (MLRA) and Land Resource Unit (LRU) (USDA-Natural Resources Conservation Service, 2006)
The Natural Communities of Louisiana - (Louisiana Natural Heritage Program - Louisiana Department of Wildlife and Fisheries)Ecological site concept
These areas are on low ridges that generally parallel the Gulf of America coast marsh. The soils formed in coastal beach deposits of shell and sand. Slopes range from 0 to 3 percent. Brief flooding occurs rarely. Gulf cordgrass dominates this site. Little bluestem, switchgrass, Indiangrass, marshhay cordgrass, knotroot bristlegrass, and longspike Tridens are also found in smaller amounts. The soils are loamy throughout in low-lying areas of the inland side of the geologic beach ridges along the gulf.
Associated sites
R151XY002LA Saline Marsh 55-64 PZ
Saline Mineral Marsh frequently occurs adjacent to the Sandy Chenier site.
R151XY005LA Brackish Firm Mineral Marsh 55-64 PZ
Brackish Firm Mineral Marsh frequently occurs adjacent to the Sandy Chenier site
R151XY009LA Fresh Firm Mineral Marsh 60-64 PZ
Fresh Firm Mineral Marsh occasionally occurs adjacent to the Sandy Chenier site.
Similar sites
R151XY006LA Clayey Chenier Brackish Marsh 55-64 PZ
Clayey Chenier Brackish Marsh has many of the same plant species and similar production to the Sandy Chenier site.
R150BY550TX Northern Salt Marsh
Occurs in Texas counties immediately west of Louisiana and occupying a narrow strip of land along the entire Texas gulf coast. Similar plant species, but lower annual production due to less annual rainfall.
R151XY677TX Saline Fluid Marsh 42+ PZ
Occurs in Texas counties immediately west of Louisiana and occupying a narrow strip of land along the entire Texas gulf coast. Similar plant species and production due to less annual rainfall.
Table 1. Dominant plant species
Tree Not specified
Shrub Not specified
Herbaceous Not specified
Physiographic features
These areas are on low ridges that generally parallel the gulf coast marsh. The soils formed in coastal beach deposits of shell and sand. Slopes range from 0 to 3 percent. Brief flooding occurs rarely.
Table 2. Representative physiographic features
Landforms (1) Beach ridge
Flooding duration Brief (2 to 7 days) Flooding frequency Rare Ponding frequency None Elevation 0 – 10 ft Slope 0 – 3 % Ponding depth 0 in Water table depth 30 – 72 in Climatic features
The average annual precipitation is 60 to 65 inches. About 70 percent of the precipitation occurs during the growing season. Rainfall typically occurs as post-frontal precipitation in the winter and heat-convection showers and thunderstorms in the spring and summer. In addition, tropical storms can bring large amounts of rainfall. The freeze-free period averages 325 days and ranges from 290 to 365 dyas, increasing in length from north to south.
Table 3 Representative climatic features
Frost-free period (average) 370 days Freeze-free period (average) 370 days Precipitation total (average) 70 in BarLineFigure 2. Monthly precipitation range
BarLineFigure 3. Monthly average minimum and maximum temperature
">Influencing water features
The gulf is the influencing water feature on this site.
Soil features
Soils on this site include Cheniere, Hackberry and Peveto. These soils formed in shell and sand beach deposits. They are on low, narrow ridges that generally parallel the gulf coast shoreline. Small shell fragments on and in the surface range from 0 to 40 percent. Shell fragments in the underlying material ranges from 5 to 90 percent.
Taxonomic Classification:
Cheniere-Cartonitic, hyperthermic Typic Udipsamments
Hackberry - Sandy, mixed, hyperthermic aeric endoaquepts
Peveto - Mixed, hyperthermic Typic Udipsamments
The parent material kind is sandy beach sand, loamy beach sand and shell beach sand. The parent material origin is chenier plain marsh and shell fragments and sand beach deposits.Table 4. Representative soil features
Surface texture (1) Loamy fine sand
(2) Sand
Drainage class Somewhat poorly drained to somewhat excessively drained Permeability class Moderately rapid to rapid Soil depth 72 – 100 in Surface fragment cover <=3" Not specified Surface fragment cover >3" Not specified Available water capacity
(0-40in)2 – 5 in Calcium carbonate equivalent
(0-40in)0 – 65 % Electrical conductivity
(0-40in)0 – 4 mmhos/cm Sodium adsorption ratio
(0-40in)0 – 15 Soil reaction (1:1 water)
(0-40in)5.6 – 9 Subsurface fragment volume <=3"
(Depth not specified)Not specified Subsurface fragment volume >3"
(Depth not specified)Not specified Ecological dynamics
Sandy ridges developed when the westernmost deltaic lobes were being formed by the Mississippi River. Deposits from onshore currents created beaches as the gulf was receding. Sandy Chenier ecological sites are geologic remnants of those beaches and occur as narrow bands running parallel to the gulf. These sites are well drained and occur at elevations above Mean High Tide, usually less than 5 feet in height. The plant communities that occur on this site are adapted to much drier conditions than typical marsh vegetation. Remnant areas of vegetation suggest that tallgrass prairie grasses and gulf cordgrass were the dominant plant species on the Sandy Chenier ecological site prior to European colonization.
The proximity to the gulf makes this site susceptible to degradation by natural and human induced actions. Hurricanes and tropical storms can destroy or alter plant communities in a very short period of time as a result of storm surge, overwash and/or increased salinity.
Grazing by cattle, furbearers, and geese can adversely affect vegetation on this site if not properly managed. Wildlife grazing pressure presents a management challenge because it is not possible to consistently control the numbers and movements of most wildlife species. Burning enhances the quality, availability, and palatability of the vegetation. This can cause livestock and/or wildlife to concentrate on the burned area which results in continual overgrazing. This site is a natural concentration point for cattle and wildlife since it is drier and at a higher elevation. It is used as a bedding ground and as an area to find some relief from higher concentrations of mosquitoes in the adjacent wetter marsh sites.
Because of its elevation, it is the preferred site for human activities including transportation and utilities, as well as oil and gas exploration and infrastructure, residential and industrial development, etc. Some areas have been converted to tame pasture and hayland. As a result of these activities, most of this site has been disturbed or converted to other uses. Undisturbed remnants of pristine vegetation are rare. European man and accompanying domestic livestock, have inhabited this site for about two centuries. As a result of intensive use by both humans and livestock, relict vegetation is extremely rare. Only remnants of the vegetation found in community phase 1.1 and 2.1 can be found.State and transition model
Custom diagramStandard diagram
Figure 4. Sandy Chenier
More interactive model formats are also available. View Interactive Models
More interactive model formats are also available. View Interactive Models
Click on state and transition labels to scroll to the respective textEcosystem states
State 1 submodel, plant communities
State 2 submodel, plant communities
State 3 submodel, plant communities
State 1
Tallgrass StateCommunity 1.1
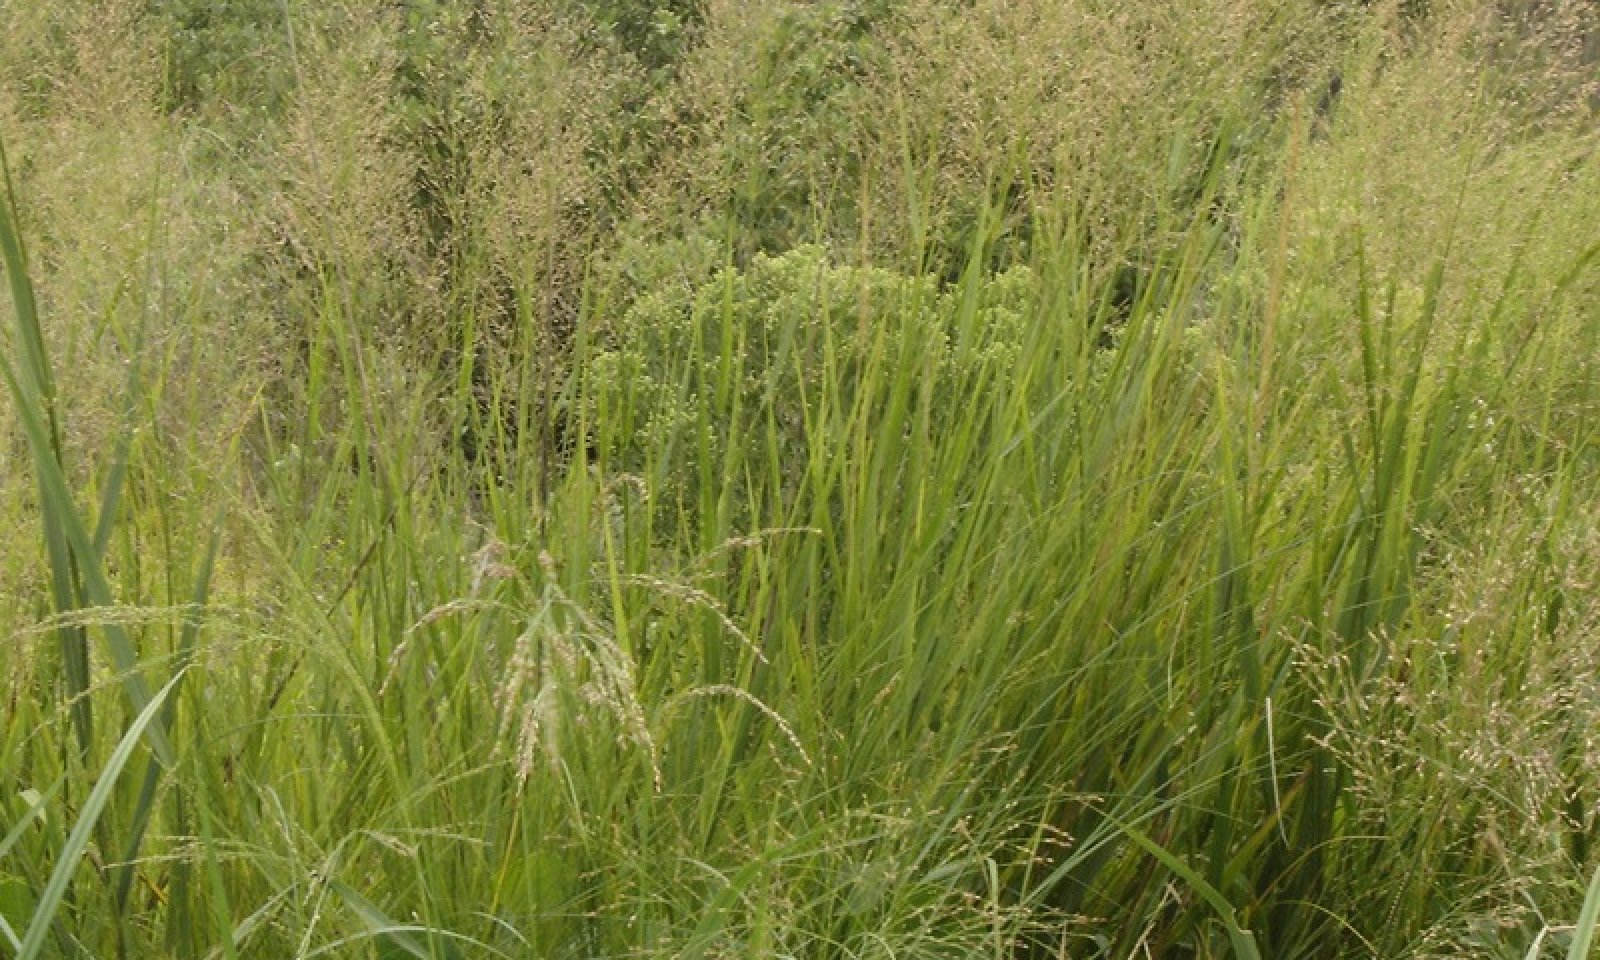
Tallgrass/Gulf Cordgrass Plant Community
Figure 5. Tallgrass/Gulf Cordgrass Plant Community
Documented observations of remnant plant communities in the past suggest that the presumed historic climax vegetation of the Sandy Chenier ecological site is dominated by tallgrasses and gulf cordgrass. The vegetation tends to occur in colonies and has a patchy appearance as the result of subtle changes in elevation and topography. The ridges and mounds on this site are dominated by gulf cordgrass, little bluestem, and gulfdune paspalum. Switchgrass, eastern gamagrass, longtom, and marshhay cordgrass are the dominant species in the depressions.
Perennial native forbs such as Indian blanket, bundleflower, sensitivebriar, goldenrod, and ragweed are a minor component of this site. Trees and shrubs such as liveoak, sugarberry, and wolfberry may occur in minor amounts on this site in pristine condition.
Figure 6. Annual production by plant type (representative values) or group (midpoint values)
Table 5. Annual production by plant type
Plant type Low
(lb/acre)Representative value
(lb/acre)High
(lb/acre)Grass/Grasslike 3000 4000 6000 Forb 50 100 150 Shrub/Vine 5 10 50 Total 3055 4110 6200 Figure 7. Plant community growth curve (percent production by month). LA1511 , Louisiana Gulf Coast Marshes. Fresh, Brackish, and Saline Marshes of the Louisiana Gulf Coast .
Jan Feb Mar Apr May Jun Jul Aug Sep Oct Nov Dec J F M A M J J A S O N D 1 3 13 23 25 10 7 5 5 5 2 1 State 2
Midgrass/Shortgrass StateCommunity 2.1
Gulf Cordgrass Plant Community
Figure 8. Gulf Cordgrass Plant Community
Uncontrolled grazing eventually leads to the drastic reduction or elimination of tallgrass species from this site. As tallgrasses are grazed out, gulf cordgrass becomes the dominant species. Midgrasses and shortgrasses such as gulf muhly, torpedograss, bristlegrass, seashore paspalum, seashore saltgrass, bitter panicum, red lovegrass, and sedges increase to become a significant component of the plant community. Perennial forbs such as ragweed, yankeeweed, and goldenrods increase noticeably in this phase.
When an adequate fuel load exists, prescribed fire can be used on this site as management tool to increase the palatability and accessibility of vegetation. However, this site is already a preferred site for cattle and wildlife because it is higher and drier than surrounding sites. If burning is poorly planned or implemented, it can have a negative effect on the plant community because it will result in higher concentration of grazing animals attracted to the site. This will lead to even greater potential for damage due to overgrazing. Unless burning is followed by proper grazing management, the plant community may change radically from a gulf cordgrass and midgrass dominated community to a community of short sod-forming grasses.
Figure 9. Annual production by plant type (representative values) or group (midpoint values)
Table 6. Annual production by plant type
Plant type Low
(lb/acre)Representative value
(lb/acre)High
(lb/acre)Grass/Grasslike 1000 2500 3000 Forb 1000 1000 1000 Total 2000 3500 4000 Figure 10. Plant community growth curve (percent production by month). LA1511 , Louisiana Gulf Coast Marshes. Fresh, Brackish, and Saline Marshes of the Louisiana Gulf Coast .
Jan Feb Mar Apr May Jun Jul Aug Sep Oct Nov Dec J F M A M J J A S O N D 1 3 13 23 25 10 7 5 5 5 2 1 Community 2.2
Shortgrass Plant Community
Figure 11. Shortgrass Plant Community
Continued uncontrolled heavy grazing by cattle and wildlife (especially geese) grazing of this site eventually will cause the gulf cordgrass plant community to become a community dominated by short sod-forming native grasses, such as seashore saltgrass and seashore paspalum, and non-native grasses such as bermudagrass. Western ragweed, yankeeweed, and many annual forbs increase or invade the site. Huisache, wolfberry, pricklypear, and Chinese tallow begin to invade the site and increase in density and canopy. Gulf cordgrass and scattered individual tallgrass plants may still exist in inaccessible areas or areas protected by shrubs or pricklypear. It is possible that a well-planned grazing management system will allow this plant community to return to the gulf cordgrass/midgrass plant community. Practices such as brush management, weed control, or grass seeding, must be implemented and followed for a period of several years.
Fire is not a major factor in this plant community because of the lack of sufficient fine fuel. This plant community phase is susceptible to erosion because of the relatively high amount of bare ground and the effects of continuous heavy hoof action.
Figure 12. Annual production by plant type (representative values) or group (midpoint values)
Table 7. Annual production by plant type
Plant type Low
(lb/acre)Representative value
(lb/acre)High
(lb/acre)Grass/Grasslike 1500 3500 5000 Forb 300 500 750 Shrub/Vine 0 0 10 Total 1800 4000 5760 Figure 13. Plant community growth curve (percent production by month). LA1511 , Louisiana Gulf Coast Marshes. Fresh, Brackish, and Saline Marshes of the Louisiana Gulf Coast .
Jan Feb Mar Apr May Jun Jul Aug Sep Oct Nov Dec J F M A M J J A S O N D 1 3 13 23 25 10 7 5 5 5 2 1 State 3
Shrub/Shortgrass StateCommunity 3.1
Shrub/Shortgrass Plant Community
Figure 14. Shrub/Shortgrass Plant Community
Continuous, uncontrolled, heavy grazing will eventually cause this site to become a plant community composed almost entirely of short, sod-forming grasses which are able to persist under abusive grazing conditions. At this stage, seashore saltgrass, seashore paspalum, and bermudagrass are the dominant grasses. As perennial plants weaken and decline, bare ground increases, and opportunistic annual grasses and forbs become well established. Invasive plants including huisache, pricklypear, wolfberry, Chinese tallow, rattlebox, and baccharis increase dramatically in density and canopy.
Improved grazing management alone cannot reverse the effects of mismanagement once the site has reached this degraded state. Expensive and extensive mechanical and/or chemical brush management are necessary to control noxious shrubs. Since the tallgrass and midgrass plant communities have been reduced to the point that they are no longer viable, adapted grasses need to be seeded in order to recover from the effects of long-term abusive grazing. Improved grazing management must be implemented along with the brush management and grass seeding treatments to establish and maintain a more desirable plant community for forage production, wildlife habitat, and erosion control
Figure 15. Annual production by plant type (representative values) or group (midpoint values)
Table 8. Annual production by plant type
Plant type Low
(lb/acre)Representative value
(lb/acre)High
(lb/acre)Grass/Grasslike 800 1175 2000 Forb 700 750 800 Shrub/Vine 50 75 100 Total 1550 2000 2900 Figure 16. Plant community growth curve (percent production by month). LA1511 , Louisiana Gulf Coast Marshes. Fresh, Brackish, and Saline Marshes of the Louisiana Gulf Coast .
Jan Feb Mar Apr May Jun Jul Aug Sep Oct Nov Dec J F M A M J J A S O N D 1 3 13 23 25 10 7 5 5 5 2 1 State 4
Converted/Disturbed Land StateBecause of its elevation, the Sandy Chenier ecological site is a preferred site for human activities, livestock grazing, and some wildlife species. It is higher and drier than the adjacent marshes which surround it. Because of its position on the landscape it is used extensively for roads, utilities, pipelines, oil and gas exploration and infrastructure, residential and industrial development, etc. Cattle and some wildlife species tend to concentrate on these areas and use them as bedding grounds. Some areas have been converted to tame pasture and hayland. As a result of these activities, most of this site has been disturbed or converted to other uses. Undisturbed remnants of pristine vegetation are rare.
Additional community tables
Table 9. Community 1.1 plant community composition
Group Common name Symbol Scientific name Annual production () Foliar cover (%) Grass/Grasslike1 Grasses/Grasslike 3000–6000 switchgrass PAVI2 Panicum virgatum 300–800 – Indiangrass SONU2 Sorghastrum nutans 150–600 – eastern gamagrass TRDA3 Tripsacum dactyloides 100–600 – gulf cordgrass SPSP Spartina spartinae 400–600 – big bluestem ANGE Andropogon gerardii 50–600 – saltmeadow cordgrass SPPA Spartina patens 400 – little bluestem SCSC Schizachyrium scoparium 80–400 – seashore paspalum PAVA Paspalum vaginatum 200–300 – common reed PHAU7 Phragmites australis 100–200 – seashore dropseed SPVI3 Sporobolus virginicus 100–200 – broomsedge bluestem ANVI2 Andropogon virginicus 200 – sedge CAREX Carex 0–100 – rush JUNCU Juncus 0–100 – hairawn muhly MUCA2 Muhlenbergia capillaris 0–100 – longtom PADE24 Paspalum denticulatum 40–100 – Florida paspalum PAFL4 Paspalum floridanum 0–100 – longspike tridens TRST2 Tridens strictus 40–100 – bitter panicgrass PAAM2 Panicum amarum 0–60 – brownseed paspalum PAPL3 Paspalum plicatulum 50 – marsh bristlegrass SEPA10 Setaria parviflora 50 – red lovegrass ERSE Eragrostis secundiflora 40 – gulfdune paspalum PAMO4 Paspalum monostachyum 20–40 – torpedo grass PARE3 Panicum repens 0–20 – thin paspalum PASE5 Paspalum setaceum 0–20 – rosette grass DICHA2 Dichanthelium 0–20 – Forb2 Forbs 10–150 goldenrod SOLID Solidago 15–45 – Indian blanket GAPU Gaillardia pulchella 10–40 – Cuman ragweed AMPS Ambrosia psilostachya 5–20 – partridge pea CHFA2 Chamaecrista fasciculata 5–15 – yankeeweed EUCO7 Eupatorium compositifolium 10 – Illinois bundleflower DEIL Desmanthus illinoensis 2–5 – powderpuff MIST2 Mimosa strigillosa 2–5 – Shrub/Vine3 Shrubs 5–50 live oak QUVI Quercus virginiana 0–25 – sugarberry CELA Celtis laevigata 0–15 – Carolina desert-thorn LYCA2 Lycium carolinianum 5–10 – Table 10. Community 2.1 plant community composition
Group Common name Symbol Scientific name Annual production () Foliar cover (%) Table 11. Community 2.2 plant community composition
Group Common name Symbol Scientific name Annual production () Foliar cover (%) Table 12. Community 3.1 plant community composition
Group Common name Symbol Scientific name Annual production () Foliar cover (%) Interpretations
Animal community
Deer, raccoons and other small mammals are transient users of the Sandy Chenier ecological site. The site is also used as a bedding area because it is higher and drier than surrounding sites. It may also provide escape cover for wildlife species in areas which have a significant amount of shrubs. Predators such as coyotes are present on this site.
Geese prefer this site as a landing area because it is higher and drier than the surrounding areas and frequently consists of low growing vegetation. They may feed on seashore paspalum and the shoots of gulf cordgrasss in open areas with very short, tender vegetation. Recently burned areas are favored feeding grounds for geese. After seasonal grazing by geese, these areas are heavily disturbed and often denuded.
This site is a natural concentration point for cattle because of its higher elevation and drier conditions. It is used as an area to escape high concentrations of mosquitoes in the adjacent wetter marsh sites.
Hydrological functions
Of all the marsh sites, the Sandy Chenier ecological site is the least affected by natural surface hydrology. However, transportation, utilities, and oil and gas industry infrastructure can cause changes in hydrology that impact this site. By concentrating water against the cheniers and ridges or cutting through them.
Recreational uses
Recreational use of this site is incidental and is generally associated with hunting on adjacent sites. This site provides limited opportunities for outdoor activities.
Supporting information
Inventory data references
Production and Composition Data for Native Grazing Lands (SCS-RANGE-417) clipping data was reviewed to determine species occurrence and production on soils that are representative of the Sandy Chenier ecological site. In addition vegetation transect data from Cameron and Vermillion Parishes collected from 1991-1995 was used to determine species occurrence and production on typical Sandy Chenier ecological sites
Other references
• Allen, Dr. Charles, Dawn Allen Newman, and Dr. Harry Winters. Grasses of Louisiana, 3rd Edition. Allen’s Native Ventures. Pitkin, LA. 2004.
• Ball, D.M., C.S. Hoveland, and G.D. Lacefield. Southern Forages, Third Edition. Potash and Phosphate Institute and Foundation for Agronomic Research. Norcross, GA. 2002.
• Brown, Clair A. Wildflowers of Louisiana and Adjoining States. Louisiana State University Press. Baton Rouge, LA. 1991.
• Chabreck, Robert H. and R.E. Condrey. Common Vascular Plants of the Louisiana Marsh. Sea Grant Publication No. LSU-T-79-003. Louisiana State University Center for Wetland Resources. Baton Rouge, LA. 1979.
• Chabreck, Robert H. Vegetation, Water and Soil Characteristics of the Louisiana Coastal Region. Bulletin 664. Louisiana State University. Baton Rouge, LA. 1972.
• Lee, Stuart. The Value of High Ground in a Coastal Landscape. WaterMarks Number 38. September 2008. www.lacoast.gov/newsletter.htm. Louisiana Coastal Wetlands Conservation and Restoration Task Force. Alexandria, LA. 2008.
• Louisiana Department of Wildlife and Fisheries. The Natural Communities of Louisiana. Louisiana Natural Heritage Program. LDWF. Baton Rouge, LA. 2004
• Post, Lauren C. The Old Cattle Industry of Southwest Louisiana. The McNeese Review. Volume 9. 1957.
• Radford, Albert E., Harry E. Ahles and C. Ritchie Bell. Manual of the Vascular Flora of the Carolinas. The University of North Carolina Press. Chapel Hill, NC. 1987.
• Stutzenbaker, Charles D. Aquatic and Wetland Plants of the Western Gulf Coast. Texas Parks and Wildlife Department, Wildlife Division. Austin, TX. 1999.
• Tarver, David P., John A. Rodgers, Michael J. Mahler, and Robert L. Lazor. Aquatic and Wetland Plants of Florida Second Edition. Bureau of Aquatic Plant Research and Control. Florida Department of Natural Resources. 1979.
• Thomas, R. Dale & Charles M. Allen. Atlas of the Vascular Flora of Louisiana, Vol.I: Ferns & Fern Allies, Conifers, & Monocotyledons. Louisiana Department of Wildlife & Fisheries Natural Heritage Program and The Nature Conservancy. Baton Rouge, LA. 1993.
• Thomas, R. Dale & Charles M. Allen. Atlas of the Vascular Flora of Louisiana, Vol.II: Dicotyledons, Acanthaceae – Euphorbiaceae. Louisiana Department of Wildlife & Fisheries Natural Heritage Program and The Nature Conservancy. Baton Rouge, LA. 1996.
• Thomas, R. Dale & Charles M. Allen. Atlas of the Vascular Flora of Louisiana, Vol.III: Dicotyledons, Fabaceae – Zygophyllaceae. Louisiana Department of Wildlife & Fisheries Natural Heritage Program and The Nature Conservancy. Baton Rouge, LA. 1998.
• United States Department of Agriculture Natural Resources Conservation Service. The PLANTS Database http://plants.usda.gov. USDA NRCS National Plant Data Center. Baton Rouge, LA. 2008.
• United States Department of Agriculture Natural Resources Conservation Service. Cameron-Creole Watershed 2003 Vegetative Monitoring Report. USDA NRCS. Alexandria, LA. 2007.
• United States Department of Agriculture Natural Resources Conservation Service. Ag Handbook 296. Land Resource Regions and Major Land Resource Areas of the United States, the Caribbean, and the Pacific Basin. USDA NRCS Soil Survey Division. Washington, DC. 2006.
• United States Department of Agriculture Natural Resources Conservation Service. Production and Composition Record for Native Grazing Lands. SCS-RANGE-417 data from Cameron, Vermillion, Iberia, St. Mary, Terrebonne, and La Fourche Parishes. 1981-1986.
• United States Department of Agriculture Natural Resources Conservation Service. Published Soil Surveys from Cameron, Vermillion, Iberia, St. Mary, Terrebonne, and La Fourche Parishes. Various publication dates.
• United States Department of Agriculture Natural Resources Conservation Service. Web Soil Survey. http://websoilsurvey.nrcs.usda.gov/app. USDA NRCS Soil Survey Division. Washington, DC. 2008.
• United States Department of Agriculture Soil Conservation Service. Louisiana Wetlands Plant List. USDA SCS Louisiana Bulletin No. 190-7-3. USDA SCS. Alexandria, LA. 1986.
• United States Department of Agriculture Soil Conservation Service. Range Site Descriptions for the Gulf Coast Marsh Major Land Resource Area 151. USDA SCS. Alexandria, LA. Various publication dates.
• United States Department of Agriculture Soil Conservation Service. Submerged and Floating Aquatic Plants of South Louisiana. Alexandria, LA. 1988.
• United States Department of Agriculture Soil Conservation Service. Southern Wetland Flora. USDA SCS South National Technical Center, Fort Worth, TX.
• United States Department of Agriculture Soil Conservation Service. Louisiana’s Native Ranges and Their Proper Use. USDA SCS. Alexandria, LA. 1982.
• United States Department of Agriculture Soil Conservation Service. 100 Native Forage Grasses in 11 Southern States. Agriculture Handbook 389. 1971
• United States Department of Agriculture Soil Conservation Service. Louisiana Range Handbook. USDA SCS. Alexandria, LA. 1956.
• United States Department of Agriculture Soil Conservation Service. Results of Plant Analyses From Samples Sent In During 1950 (Louisiana). USDA Soil Conservation Service Operations Laboratory. Soil Conservation Service. Fort Worth, TX. 1951.
• United States Department of Interior Fish and Wildlife Service. Classification of Wetlands and Deepwater Habitats of the United States. USDI FWS. Washington, DC. 1979.
• United States Department of Interior Fish and Wildlife Service. National List of Plant Species That Occur In Wetlands: Southeast Region (Region 2). USDI FWS Biological Report 88. Washington, DC. 1988.
• Yarlett, Lewis A. Common Grasses of Florida and the Southeast. The Florida Native Plant Society. Spring Hill, FL. 1996.
ACKNOWLEDGEMENTS
Johanna Pate, State Grazing Lands Specialist, USDA Natural Resources Conservation Service, Alexandria, LA.
Mike Stellbauer, Zone Rangeland Management Specialist, USDA Natural Resources Conservation Service, Bryan, TX.
Jerry J. Daigle, State Soil Scientist, USDA Natural Resources Conservation Service, Alexandria, LA.
Gerald Trahan, Soil Scientist, USDA Natural Resources Conservation Service, Carencro, LA.
Mike Lindsey, Soil Scientist, USDA Natural Resources Conservation Service, Carencro, LA.
Contributors
Jack Cutshall And Dan Caudle
Approval
Matthew Duvall, 3/24/2025
Rangeland health reference sheet
Interpreting Indicators of Rangeland Health is a qualitative assessment protocol used to determine ecosystem condition based on benchmark characteristics described in the Reference Sheet. A suite of 17 (or more) indicators are typically considered in an assessment. The ecological site(s) representative of an assessment location must be known prior to applying the protocol and must be verified based on soils and climate. Current plant community cannot be used to identify the ecological site.
Author(s)/participant(s) Contact for lead author Date 06/28/2026 Approved by Approval date Composition (Indicators 10 and 12) based on Annual Production Indicators
-
Number and extent of rills:
-
Presence of water flow patterns:
-
Number and height of erosional pedestals or terracettes:
-
Bare ground from Ecological Site Description or other studies (rock, litter, lichen, moss, plant canopy are not bare ground):
-
Number of gullies and erosion associated with gullies:
-
Extent of wind scoured, blowouts and/or depositional areas:
-
Amount of litter movement (describe size and distance expected to travel):
-
Soil surface (top few mm) resistance to erosion (stability values are averages - most sites will show a range of values):
-
Soil surface structure and SOM content (include type of structure and A-horizon color and thickness):
-
Effect of community phase composition (relative proportion of different functional groups) and spatial distribution on infiltration and runoff:
-
Presence and thickness of compaction layer (usually none; describe soil profile features which may be mistaken for compaction on this site):
-
Functional/Structural Groups (list in order of descending dominance by above-ground annual-production or live foliar cover using symbols: >>, >, = to indicate much greater than, greater than, and equal to):
Dominant:
Sub-dominant:
Other:
Additional:
-
Amount of plant mortality and decadence (include which functional groups are expected to show mortality or decadence):
-
Average percent litter cover (%) and depth ( in):
-
Expected annual annual-production (this is TOTAL above-ground annual-production, not just forage annual-production):
-
Potential invasive (including noxious) species (native and non-native). List species which BOTH characterize degraded states and have the potential to become a dominant or co-dominant species on the ecological site if their future establishment and growth is not actively controlled by management interventions. Species that become dominant for only one to several years (e.g., short-term response to drought or wildfire) are not invasive plants. Note that unlike other indicators, we are describing what is NOT expected in the reference state for the ecological site:
-
Perennial plant reproductive capability:
Print Options
Sections
Font
AAAAOther
PrintThe Ecosystem Dynamics Interpretive Tool is an information system framework developed by the USDA-ARS Jornada Experimental Range, USDA Natural Resources Conservation Service, and New Mexico State University.
Accessibility statement