
Natural Resources
Conservation Service
-
Search


Major Land Resource Area or ecological site by name and/or ID.
PreviousSectionsNextGeneral information
Provisional. A provisional ecological site description has undergone quality control and quality assurance review. It contains a working state and transition model and enough information to identify the ecological site.
Click to explore map
Figure 1. Mapped extent
Areas shown in blue indicate the maximum mapped extent of this ecological site. Other ecological sites likely occur within the highlighted areas. It is also possible for this ecological site to occur outside of highlighted areas if detailed soil survey has not been completed or recently updated.
MLRA notes
Major Land Resource Area (MLRA): 106X–Nebraska and Kansas Loess-Drift Hills
Named the “Nebraska and Kansas Loess-Drift Hills,” Major Land Resource Area (MLRA) 106 is divided almost evenly between southeastern Nebraska (52%), and northeastern Kansas, (48%). The approximately seven-million-acre landscape covers all or parts of thirty counties between the two states. The northern border is located on the north end of Saunders County, Nebraska, and the MLRA extends into Douglas County, Kansas in the south. The Nebraska cities of Beatrice and Lincoln are the major population centers in the north, while Topeka and Lawrence in Kansas are the primary cities in the south. The Platte, Little Nemaha, and the North Fork of the Big Nemaha Rivers flow through the Nebraska side of the MLRA, while the Black Vermillion, the Soldier, and the Delaware Rivers are the major waterways on the Kansas side. The Big Blue River runs through both states, while the Salt Creek hydrologic system located near Lincoln, Nebraska provides habitat for the only known population of the Federally listed endangered Salt Creek Tiger Beetle.
This dissected glacial drift plain primarily consists of broad, smooth ridgetops, and slopes ranging from nearly level to steep. The elevation in MLRA 106 decreases from west to east, and ranges from nearly 1,650 feet to less than 790 feet above sea level. Stream valleys in this landscape are narrow and bordered by steep hills, with 10 to 20 feet of local relief. The river valleys are broader and may drop up to over 160 feet below the adjacent hilltops. The uplands are primarily comprised of glacial drift underlying a mantle of loess, while alluvial deposits are found in the stream and river valleys. Limestone and shale quarries are also located in MLRA 106. The predominant soil orders in this MLRA are mesic, udic, Mollisols, Alfisols, and Entisols. Loams and clays are the primary soil textures in this landscape.
Sixty-two percent of the land in this MLRA has been broken out of native prairie and farmed, while only 23 percent of the grasslands remain. Livestock grazing, primarily by cattle, is the main industry on these remnants. Corn, wheat, soybeans, and grain sorghum are the primary commodity crops, but a significant number of acres are also planted to alfalfa for harvest as hay. With annual precipitation averaging from 40 inches in the southeast, to 28 inches in the northwest, irrigation for crop production is not a critical factor in most years.
The historical matrix vegetation type is Tallgrass Prairie, and big and little bluestem, switchgrass, Indiangrass, sideoats, and blue grama make up the bulk of the warm season species. Historically, western wheatgrass was the dominant cool-season grass but today the dominant cool-season grasses are introduced grasses, smooth brome in the north and tall fescue in the south. Large and small patch vegetative communities are found primarily along the riparian zones, and on both upland and lowland saline sites. Woodlands make up about six percent of MLRA 106, consisting primarily of green ash, oak, hackberry, boxelder, and maple trees.
Wildlife flourishes in this combination of crop and grassland environments. In a landscape historically occupied by bison herds, white-tailed deer are now the most abundant wild ungulates. A variety of smaller species, including coyote, raccoon, opossum, porcupines, muskrat, beaver, squirrel, and mink thrive in the region. Native grassland bird populations are limited by the lack of contiguous native prairie and the fragmented habitat created by the farmland. The rivers, streams, and lakes harbor excellent fisheries, and migrating and local waterfowl use the wetland complexes. These complexes provide ideal habitat for wading and shore bird species as well.
This landscape serves as a backdrop for a disturbance driven ecosystem, evolving under the influences of herbivory, fire, and variable climate. Historically, these processes created a heterogeneous mosaic of plant communities and structure heights across the region. Any given site in this landscape experienced fire every three to four years. Fires were caused by lightning strikes and were also set by Native Americans, who used fire for warfare, signaling, and to refresh the native grasses. The Indigenous inhabitants understood the value of fire as a tool and that the highly palatable growth following a fire provided excellent forage for their horses and attracted grazing game animals such as bison and elk.
Land use patterns by post European settlers have fragmented the native grasslands through conversion to cropland, transportation corridors, and other developments. This has significantly altered the natural fire regime allowing encroachment by native and introduced shrubs and trees into the native prairie remnants throughout the MLRA. Aggressive fire suppression policies have exacerbated this process to the point that shrub and tree encroachment is a major ecological threat in the majority of both native and reseeded grasslands. Introduction of eastern red cedar as a windbreak species further facilitates invasion by this species. While eastern red cedar is native to the landscape, the historic population in MLRA 106 was limited to isolated pockets in rugged river drainageways that were protected from fire. Widespread plantings of windbreaks with eastern red cedar as a primary component have provided a seed source for the aggressive woody plant. The ensuing encroachment into the native grasslands degrades the native wildlife habit and causes significant forage loss for domestic livestock. Since it does not sprout from the roots, eastern red cedar is very susceptible to fire when under six feet tall. Management with prescribed fire is exceedingly effective if applied before this stage. Larger eastern red cedars can also be controlled with fire, but successful application requires the use of specifically designed ignition and holding techniques.Classification relationships
►USDA-NRCS (2022)◄
Land Resource Region – M, Central Feed Grains and Livestock Region
Major Land Resource Area (MLRA) – 106
►Fenneman (1916) Physiographic Regions ◄
Division – Interior Plains
Province – Central Lowland
Section – Dissected Till Plains
►USDA-USFS (2007) Ecoregions◄
Domain – Humid Temperate
Division – Prairie
Province – Prairie Parkland (Temperate)
Section – Central Dissected Till Plains (251C)
►EPA Ecoregions (Omernik 1997)◄
I – Great Plains (9)
II – Temperate Prairies (9.2)
III – Western Corn Belt Plains (9.2.3)
IV – Loess and Glacial Drift Hills (47i)
►Associated Counties◄
Nebraska: Butler, Cass, Gage, Jefferson, Johnson, Lancaster, Nemaha, Otoe, Pawnee, Richardson, Saline, Saunders, Seward
Kansas: Atchison, Brown, Doniphan, Douglas, Franklin, Jackson, Jefferson, Johnson, Leavenworth, Marshall, Nemaha, Osage, Pottawatomie, Shawnee, Wabaunsee, Washington, WyandotteEcological site concept
The Savannah ecological site occurs in the southern portion of MLRA 106. It is located on upland landscapes and does not receive additional moisture from runoff or overflow. The typical slope range is from 4 to 20 percent. Soils are deep (greater than 36 inches) with surface textures ranging from fine sandy loam to loamy sand that are 10 to 20 inches thick. These well drained soils are formed in sandy and loamy eolian materials and glacial fluvial deposits over till. The vegetation of the Reference Community consists of a mix of warm-season tall and mid grasses under an open woody deciduous canopy. The woody canopy cover is approximately 25 percent. Big bluestem, little bluestem, and sideoats grama are the dominant grasses. Oak, elm, and hickory are the major tree species. This site is more intact than many other upland sites within the MLRA and is better suited to grazing than to farming.
Associated sites
R106XY068NE Loamy Floodplain
The Loamy Floodplain ecological site is a run-on site often positioned down slope of the Savannah ecological site.
R106XY075NE Loamy Upland
Loamy Upland ecological site is often located adjacent to the Savannah ecological site.
Similar sites
R106XY075NE Loamy Upland
Loamy Upland ecological site is often found in a landscape position similar to that of the Savannah ecological site. The surface textures of the Savannah site are sandier than those of the Loamy Upland site . The Savannah site supports a higher percentage of deciduous woody species in the Reference State.
Table 1. Dominant plant species
Tree (1) Quercus
(2) UlmusShrub (1) Symphoricarpos
(2) Rhus glabraHerbaceous (1) Andropogon gerardii
(2) Schizachyrium scopariumPhysiographic features
The Savannah ecological site occur on hillslopes of uplands. Slopes range from 4 to 20 percent.
Table 2. Representative physiographic features
Landforms (1) Upland > Hillslope
Runoff class Medium to high Flooding frequency None Ponding frequency None Elevation 750 – 1310 ft Slope 4 – 20 % Water table depth 72 – 0 in Aspect Aspect is not a significant factor Climatic features
Like most Great Plains landscapes, the climate in this MLRA is under the sway of the continental effect. This creates a regime of extremes, with summer highs often in the triple digits and winter lows plunging well below zero. Blizzards can occur anytime between early fall and late spring, dropping the temperature more than 50 degrees in just a few hours. These events can pile up several feet of snow, often driven by winds in excess of 50 miles an hour. The resulting huge snow drifts can cause serious hardship for livestock, wildlife, and humans. Winters can be open, with bare ground for most of the season, or closed, with several feet of snow persisting until March. Most winters have a number of warm days interspersed with dropping temperatures, usually associated with approaching cold fronts. Spring brings violent thunderstorms, hail, and high winds. Tornadoes occur frequently.
About three-fourths of the precipitation falls as high intensity, convective thunderstorms from late spring through early autumn. The average annual precipitation gradient trends higher from northwest (28”) to southeast (40”), and the average annual temperature gradient trends higher from north (50°F) to south (55°F). Daily winds range from an average of 14 miles per hour during the spring to 11 miles per hour during the late summer. Occasional strong storms may bring brief periods of high winds with gusts to more than 80 miles per hour.
Native cool-season plants begin growth in early April and continue to about mid-June. Native warm season plants begin growth in early June and continue to early August. Green up of cool season plants may occur in September and October.Table 3 Representative climatic features
Frost-free period (characteristic range) 140-150 days Freeze-free period (characteristic range) 190-190 days Precipitation total (characteristic range) 40-40 in Frost-free period (actual range) 140-170 days Freeze-free period (actual range) 180-200 days Precipitation total (actual range) 40-40 in Frost-free period (average) 150 days Freeze-free period (average) 190 days Precipitation total (average) 40 in Characteristic rangeActual rangeBarLineFigure 2. Monthly precipitation range
Characteristic rangeActual rangeBarLineFigure 3. Monthly minimum temperature range
Characteristic rangeActual rangeBarLineFigure 4. Monthly maximum temperature range
BarLineFigure 5. Monthly average minimum and maximum temperature
Figure 6. Annual precipitation pattern
Figure 7 Annual average temperature pattern
Climate stations used
-
(1) HORTON [USC00143810], Horton, KS
-
(2) OSKALOOSA 4 NE [USC00146100], Mc Louth, KS
-
(3) TOPEKA MUNI AP [USW00013996], Topeka, KS
-
(4) CLINTON LAKE [USC00141612], Lawrence, KS
-
(5) HIAWATHA 9 ESE [USC00143634], Robinson, KS
-
(6) LAWRENCE [USC00144559], Lawrence, KS
-
(7) PERRY LAKE [USC00146333], Perry, KS
-
(8) BONNER SPRINGS [USC00140957], Bonner Springs, KS
-
(9) HOLTON [USC00143759], Holton, KS
">Influencing water features
This site is not influenced by groundwater.
Soil features
The soils associated with the Savannah ecological site are located on uplands with slopes ranging from 4 to 20 percent. These soils were formed in both sandy and loamy eolian material and glacial fluvial deposits over till. Soils are very deep (greater than 60 inches) with fine sandy loam to loamy sand surface textures which are typically 10 to 20 inches thick. Soils are well drained to excessively drained. The saturated hydraulic conductivity ranges from moderately high to very high. The clay content in the particle size control section (weighted average) ranges from 1 to 35 percent while the sand content ranges from 75 to 98 percent.
Falleaf and Grinter are the major soil series associated with this ecological site; other soils correlated to the site include Konawa and Welda. Additional information can be found in the various soil survey reports. Contact the local USDA Service Center for soil survey reports that include more detail specific to your location or visit Web Soil Survey (https://websoilsurvey.sc.egov.usda.gov).
Figure 8. Falleaf series profile for the Savannah Ecological Site in MLRA 106.
Table 4. Representative soil features
Parent material (1) Glaciofluvial deposits
(2) Eolian deposits
Surface texture (1) Fine sandy loam
(2) Loamy sand
Drainage class Well drained to excessively drained Permeability class Moderate to rapid Soil depth 60 – 80 in Surface fragment cover <=3" Not specified Surface fragment cover >3" Not specified Available water capacity
(0-40in)3 – 7.7 in Calcium carbonate equivalent
(0-40in)Not specified Electrical conductivity
(0-40in)Not specified Sodium adsorption ratio
(0-40in)Not specified Soil reaction (1:1 water)
(0-40in)4.5 – 7.8 Subsurface fragment volume <=3"
(0-40in)Not specified Subsurface fragment volume >3"
(0-40in)Not specified Ecological dynamics
The Savannah ecological site developed under Central Great Plains climatic conditions, light to severe grazing by bison and other large herbivores, sporadic natural or man caused wildfire, and other biotic and abiotic factors that typically influence soil and site development. This continues to be a disturbance driven site by herbivory, fire, and variable climate. Changes occur in the plant communities due to short term weather variations, impacts of native and exotic plant and animal species, and management actions. The landscape position and association with streams make this site somewhat less susceptible to fire, allowing woody species to become more abundant than less sheltered sites in the MLRA.
One of the primary impacts to this site introduced by European settlers is season long, continuous grazing by domestic livestock. This management practice causes the repeated removal of the growing point and excessive defoliation of the leaf area of individual warm-season tall grasses. The resulting reduction of the plants ability to harvest sunlight depletes the root reserves, subsequently decreasing the root mass. This negatively impacts the ability of plants to compete for life sustaining nutrients resulting in declining vigor and eventual mortality. The space created in the vegetative community is then occupied by a species that avoids the negative grazing impacts by a growing season adaptation such as a cool-season, shorter structure, or reduced palatability mechanism.
The State and Transition Model (STM) is depicted below and includes a Reference State (1), a Native/Invaded State (2), and a Sod-busted State (3). Each state represents the crossing of a major ecological threshold due to alteration of the functional dynamic properties of the ecosystem. The main properties observed to determine this change are the soil and vegetative communities, and the hydrologic cycle. The STM illustrates the common plant communities that can occur on the site and the transition pathways between communities (Bestelmeyer, 2010). The ecological processes will be discussed in more detail in the plant community descriptions following the diagram.
Each state may have one or more vegetative communities that fluctuate in species composition and abundance within the normal parameters of the state. Within each state, communities may degrade or recover in response to natural and man caused disturbances such as variation in the degree and timing of herbivory, presence or absence of fire, and climatic and local fluctuations in the precipitation regime.
Interpretations are primarily based on the Reference State and have been determined by study of rangeland relic areas, areas protected from excessive disturbance, and areas under long term rotational grazing regimes. Trends in plant community dynamics have been interpreted from observation of heavily grazed to lightly grazed areas, seasonal use pastures, and historical accounts, as have plant communities, states, transitional pathways, and thresholds.State and transition model
More interactive model formats are also available. View Interactive Models
Click on state and transition labels to scroll to the respective textEcosystem states
T1A - Heavy, continuous, season long grazing with no fire or woody species management. T1B - Tillage to facilitate production agriculture. T2A - Tillage to facilitate production agriculture. State 1 submodel, plant communities
1.1A - Continuous, season long grazing with inadequate recovery periods. 1.1B - Prolonged absence of herbivory and fire. 1.2A - Prescribed grazing with adequate growing season recovery periods. 1.2B - Long term, continuous, season long grazing or haying with inadequate recovery periods 1.2C - Prolonged absence of herbivory and fire. 1.3A - Prescribed grazing early and late in the growing season. 1.3B - Prolonged absence of herbivory and fire. 1.4A - Reintroduction of herbivory and fire. 1.4B - Reintroduction of herbivory and fire. 1.4C - Reintroduction of herbivory and fire. State 2 submodel, plant communities
2.1A - No fire or woody species management. 2.2A - Prescribed burning and woody species management. State 3 submodel, plant communities
State 1
Reference StateThe Reference State (1) describes the range of vegetative community phases that occur on the Savannah ecological site where the natural processes are mostly intact. The Reference Community (1.1) is a representation of the native plant community phase that occupies a site that has been minimally altered by management. The Degraded Native (1.2), the At-Risk (1.3), and the Excessive Litter (1.4) Communities result from management decisions that are unfavorable for a healthy Reference Community (1.1). High perennial grass cover and production allows for increased soil moisture retention, vegetative production, and overall soil quality.
Dominant plant species
-
oak (Quercus), tree
-
hybrid hickory (Carya), tree
-
elm (Ulmus), tree
-
roughleaf dogwood (Cornus drummondii), shrub
-
snowberry (Symphoricarpos), shrub
-
smooth sumac (Rhus glabra), shrub
-
big bluestem (Andropogon gerardii), grass
-
little bluestem (Schizachyrium scoparium), grass
-
sideoats grama (Bouteloua curtipendula), grass
-
hairy grama (Bouteloua hirsuta), grass
Community 1.1
Reference Community
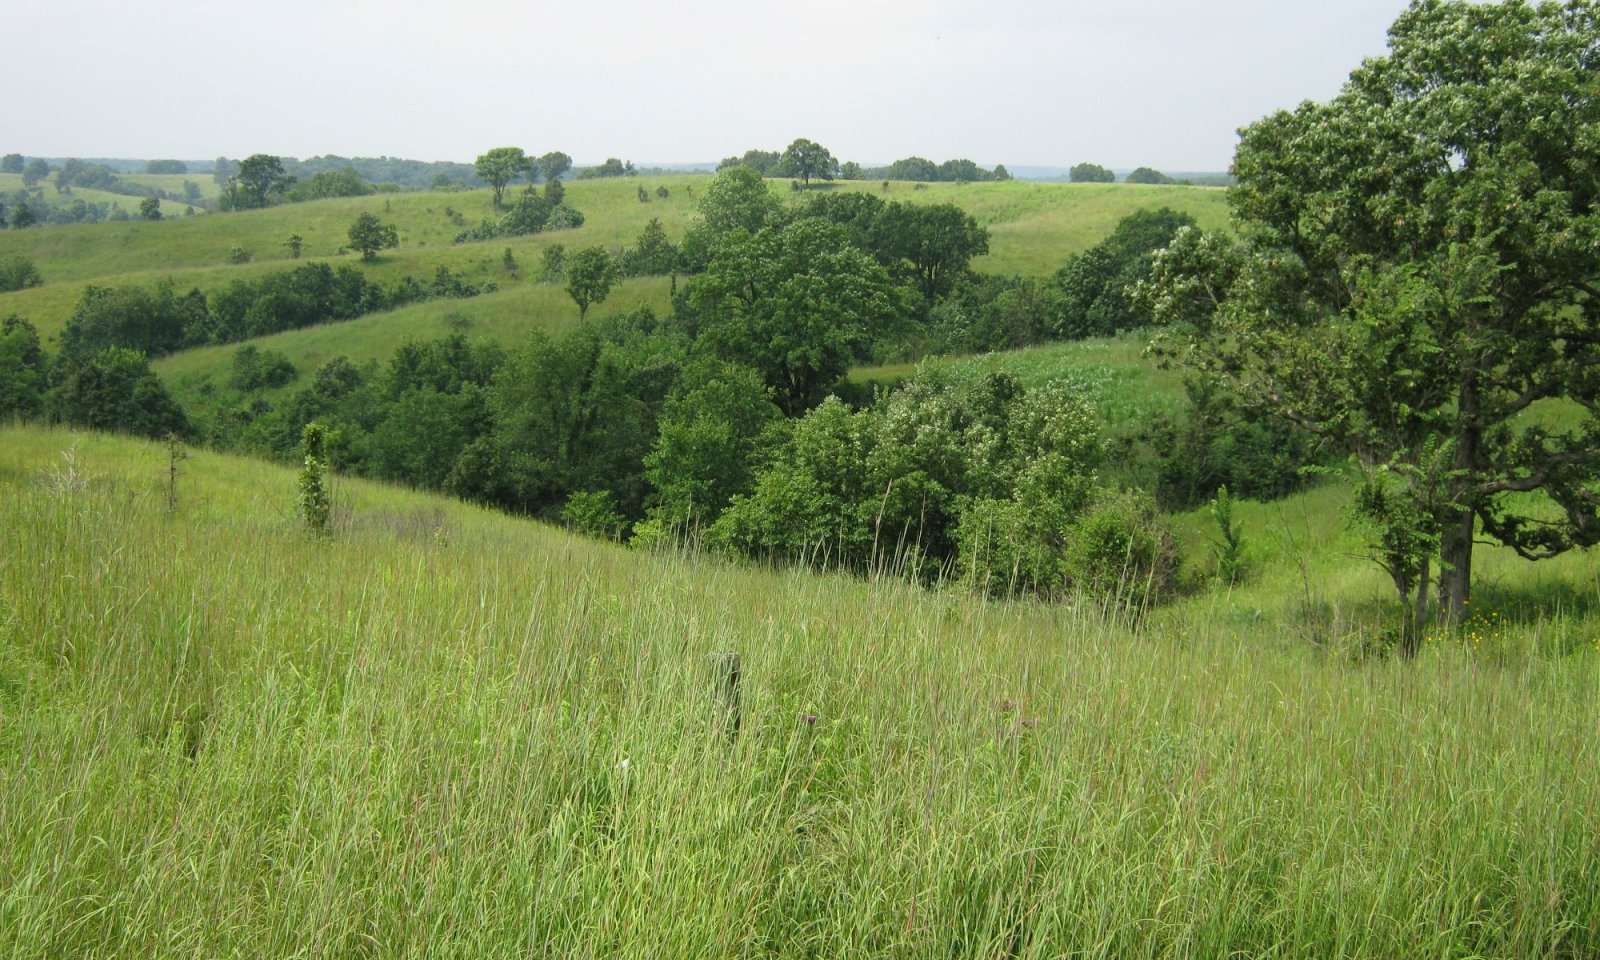
Figure 9. Savannah ecological site, Reference Community (1.1), MLRA 106.
The Reference or Native Tallgrass Savannah Community (1.1) is comprised of tall and mid grass native prairie species under a scattered canopy of deciduous trees, primarily oak, hickory, and elm. This community serves as a description of the native plant community that naturally occurs on the site when the natural disturbance regimes are intact or closely mimicked by management practices. This phase is dynamic, with fluid relative abundance and spatial boundaries between the dominant structural vegetative groups. These fluctuations are primarily driven by different responses of the species to changes in precipitation timing and abundance, and fire and grazing events.
The potential vegetation consists of approximately 65 to 75 percent grasses and grass-likes, 5 to 10 percent forbs, 5 to 10 percent shrubs, and 10 to 20 percent deciduous trees. Big and little bluestem are the primary grass species in this community. Secondary species include switchgrass, Indiangrass, and sideoats grama. The site has a moderately diverse forb population, including catclaw sensitive briar, sunflowers, and lespedezas.
This is a diverse, highly productive, resilient community that is resistant to short term stresses such as drought and short periods of heavy stocking. The well-developed root systems support this resiliency when allowed adequate recovery periods between grazing events. When exposed to long term or frequent over grazing events without adequate rest, this plant community will degrade.
The annual forage production of this community averages about 4,250 lbs per acre.Dominant plant species
-
oak (Quercus), tree
-
hybrid hickory (Carya), tree
-
elm (Ulmus), tree
-
roughleaf dogwood (Cornus drummondii), shrub
-
snowberry (Symphoricarpos), shrub
-
smooth sumac (Rhus glabra), shrub
-
big bluestem (Andropogon gerardii), grass
-
little bluestem (Schizachyrium scoparium), grass
Figure 10. Plant community growth curve (percent production by month). NE1061 , Mid and Tall Warm Season Grasses. This plant community is dominated by warm-season, tall and midgrasses in MLRA 106.
Jan Feb Mar Apr May Jun Jul Aug Sep Oct Nov Dec J F M A M J J A S O N D 0 0 0 5 25 35 20 10 5 0 0 0 Community 1.2
Degraded Native Community
Figure 11. Savannah Ecological Site, Degraded Native Community (1.2), eastern Kansas, MLRA 106.
The Degraded Native Community (1.2) signals a reduction in the amount of big bluestem, little bluestem, and sideoats grama in the community and a resulting loss of productive capacity due to reduced vigor and reproductive potential. While little bluestem and sideoats grama are the dominant grass species, big bluestem has been reduced to a secondary species, and switchgrass and Indiangrass are reduced to remnants. As growing season defoliation continues, the more grazing tolerant species such as hairy grama, muhly, and composite dropseed increase and introduced grasses, such as Kentucky bluegrass, begin to invade the community. The woody component becomes more prominent, causing additional shade over the understory.
This community phase signals a significant loss of production. The change results from continuous season long grazing or heavy rotational grazing with inadequate growing season recovery periods. The composition of the forb component is dominated by less palatable species and lespedeza and cuman ragweed increase. Fewer high biomass producing deep rooted species result in a reduced fire friendly fuel load.
While this plant community is less productive and less diverse than the representative plant community, it remains sustainable in regard to site and soil stability, watershed function, and biologic integrity.Dominant plant species
-
oak (Quercus), tree
-
hybrid hickory (Carya), tree
-
elm (Ulmus), tree
-
roughleaf dogwood (Cornus drummondii), shrub
-
smooth sumac (Rhus glabra), shrub
-
snowberry (Symphoricarpos), shrub
-
little bluestem (Schizachyrium scoparium), grass
-
sideoats grama (Bouteloua curtipendula), grass
-
lespedeza (Lespedeza), other herbaceous
-
Cuman ragweed (Ambrosia psilostachya), other herbaceous
Community 1.3
At-Risk Community
Figure 12. Savannah ecological site, At Risk Community (1.3), eastern Kansas, MLRA 106.
In the At-Risk Community (1.3), warm-season tall grasses have been reduced to a minor component of the plant community due to continued defoliation during their critical growth periods. Grazing tolerant grasses increase significantly. Composite dropseed and warm-season short grasses become dominant. Kentucky bluegrass may be present as a minor component. Shade tolerant annuals increase. Sedges, rosette grass, and snowberry populations expand while the palatable forb component is only a trace.
Soil health is affected by reduced efficiency in the nutrient, mineral, and hydrologic cycles as a result of decreases in plant litter and rooting depths. This may result in formation of a compacted layer in the pockets of deeper soil, and total annual vegetative production declines significantly. Without a management change, this community is at-risk to degrade to the Native/Invaded State (2).Dominant plant species
-
oak (Quercus), tree
-
hybrid hickory (Carya), tree
-
elm (Ulmus), tree
-
roughleaf dogwood (Cornus drummondii), shrub
-
snowberry (Symphoricarpos), shrub
-
smooth sumac (Rhus glabra), shrub
-
composite dropseed (Sporobolus compositus), grass
-
hairy grama (Bouteloua hirsuta), grass
Figure 13. Plant community growth curve (percent production by month). NE1069 , MLRA 106 Warm/cool-season mix.
Jan Feb Mar Apr May Jun Jul Aug Sep Oct Nov Dec J F M A M J J A S O N D 0 1 4 10 23 26 17 8 6 4 1 0 Community 1.4
Excessive Litter CommunityThe Excessive Litter Community (1.4) develops when the natural disturbances of herbivory and fire are removed from the system for extended periods of time (five years or more). Litter significantly exceeds the amount expected on the site and the species present can tolerate a thatch layer. Individual plants tend to be clumped and there is an excessive amount of litter. Species that cannot tolerate an extensive litter layer have low vigor and reduced productivity.
Once the undisturbed litter layer develops to a certain level, a significant amount of precipitation is held in this layer increasing evaporation, limiting soil available moisture, and simulating drought conditions. If herbivory or fire are not reintroduced, the plant community will experience a significant amount of death loss.Dominant plant species
-
oak (Quercus), tree
-
hybrid hickory (Carya), tree
-
elm (Ulmus), tree
-
roughleaf dogwood (Cornus drummondii), shrub
-
smooth sumac (Rhus glabra), shrub
-
big bluestem (Andropogon gerardii), grass
Pathway 1.1A
Community 1.1 to 1.2
Reference Community
Degraded Native CommunityA shift from the Reference Community (1.1) to the Degraded Native Community (1.2) occurs with continuous, season long grazing or rotational grazing with inadequate recovery periods (deferment) during the growing season. This shift will also occur when the site is hayed with inadequate time for recovery between cuttings.
Pathway 1.1B
Community 1.1 to 1.4Prolonged interruption of the natural disturbances of herbivory and fire will result in conversion of the Reference Community (1.1) to the Excessive Litter Community (1.4).
Pathway 1.2A
Community 1.2 to 1.1
Degraded Native Community
Reference CommunityA shift from the Degraded Native Community (1.2) toward the Reference Community (1.1) can be achieved through prescribed grazing. Applying grazing pressure during the growth period of the undesirable cool-season grasses and allowing adequate recovery time (deferment) during the warm season growing period favors the warm-season, tall and mid grasses. This grazing strategy will enable the more deeply rooted warm-season, tall grasses to out compete the shallow rooted grazing tolerant, warm-season, short grasses and the cool-season grasses. Appropriately timed prescribed fire will accelerate this process.
Conservation practices
Prescribed Burning Prescribed Grazing Pathway 1.2B
Community 1.2 to 1.3
Degraded Native Community
At-Risk CommunityLong term, continuous, season long grazing or haying with inadequate recovery periods during the growing season further degrades the Degraded Native Community (1.2) to the At-Risk Community (1.3).
Pathway 1.2C
Community 1.2 to 1.4Prolonged interruption of the natural disturbances of herbivory and fire will result in conversion of the At-Risk Community (1.3) to the Excessive Litter Community (1.4).
Pathway 1.3A
Community 1.3 to 1.2
At-Risk Community
Degraded Native CommunityThe At-Risk Community (1.3) and the downward trend which produced that community can be reversed, resulting in a shift to the Degraded Native Community (1.2). This can be achieved with prescribed grazing early and late in the growing season to reduce undesirable cool-season grasses. Targeting the peak growth period of cool-season grasses with high intensity grazing events followed by rest will allow the native, warm-season tall grasses to rejuvenate. Appropriately timed prescribed fire will accelerate this process.
Conservation practices
Prescribed Burning Prescribed Grazing Pathway 1.3B
Community 1.3 to 1.4Prolonged interruption of the natural disturbances of herbivory and fire will result in conversion of the At-Risk Community (1.3) to the Excessive Litter Community (1.4).
Pathway 1.4A
Community 1.4 to 1.1Reintroduction of the natural processes of herbivory and fire will allow the Excessive Litter Community (1.4) to return to the Reference Community (1.1).
Conservation practices
Prescribed Burning Prescribed Grazing Pathway 1.4B
Community 1.4 to 1.2Reintroduction of the natural processes of herbivory and fire will allow the Excessive Litter Community (1.4) to return to the Degraded Native Community (1.2).
Conservation practices
Prescribed Burning Prescribed Grazing Pathway 1.4C
Community 1.4 to 1.3Reintroduction of the natural processes of herbivory and fire will allow the Excessive Litter Community (1.4) return to the At-Risk Community (1.3).
Conservation practices
Prescribed Burning Prescribed Grazing State 2
Native/Invaded StateThe Native/Invaded State (2) has been degraded from the Reference State (1) and much of the native, warm-season tall and mid grass community has been replaced by warm-season short grasses and cool-season grasses. The loss of warm-season, tall and mid grasses has negatively impacted energy flow and nutrient cycling. The woody component has expanded significantly and shading by the overstory has also increased. Water infiltration is reduced due to the shallow root system and rapid runoff characteristics of the invaded plant communities. Alterations to the soil and the hydrological processes make return to the Reference State (1) unlikely. The Native/Invaded State (2) includes the Invaded Woody Community (2.1) and the Eastern Red Cedar Community (2.2).
Dominant plant species
-
oak (Quercus), tree
-
eastern redcedar (Juniperus virginiana), tree
-
composite dropseed (Sporobolus compositus), grass
-
rosette grass (Dichanthelium), grass
-
hairy grama (Bouteloua hirsuta), grass
-
Kentucky bluegrass (Poa pratensis), grass
Community 2.1
Invaded Woody Community
Figure 14. Savannah ecological site, Invaded Woody Community (2.1), MLRA 106.
The Invaded Woody Community (2.1) represents a shift from the Reference State (1) across a plant community threshold. The plant community is dominated by sod forming, cool-season grasses and grass-likes with a significant increase in deciduous tree overstory. With continued grazing pressure hairy grama, Kentucky bluegrass, tall fescue, sedges, and dropseeds will become the dominant herbaceous species, with only trace remnants of the more palatable warm-season grasses such as little bluestem and sideoats grama. Continuous and heavy grazing pressure will maintain this plant community in a sod bound condition.
Forb richness and diversity has decreased. Without focused management, the woody component will become dominant. The increased light interception from the overstory creates a more shade tolerant environment. Kentucky bluegrass, sedges, broomsedge bluestem, and purpletop tridens will become the dominant herbaceous species.
With the decline and loss of deeper penetrating root systems, a compacted layer may form in the soil profile below the shallower replacement root systems.Dominant plant species
-
dogwood (Cornus), tree
-
bur oak (Quercus macrocarpa), tree
-
Kentucky bluegrass (Poa pratensis), grass
-
purpletop tridens (Tridens flavus), grass
-
broomsedge bluestem (Andropogon virginicus), grass
Community 2.2
Eastern Redcedar CommunityIn the Eastern Redcedar Community (2.2), eastern redcedar has increased and dominates the understory, eventually replacing the native deciduous trees and creating a monoculture that eliminates most of the herbaceous understory and the deciduous overstory.
Dominant plant species
-
eastern redcedar (Juniperus virginiana), tree
-
Kentucky bluegrass (Poa pratensis), other herbaceous
Pathway 2.1A
Community 2.1 to 2.2Interruption of the natural fire regime with the absence of woody species management can allow eastern red cedar to dominate eventually becoming a monoculture moving the Invaded Woody Community (2.1) to the Eastern Redcedar Community (2.2).
Pathway 2.2A
Community 2.2 to 2.1The Eastern Redcedar Community (2.2) can be shifted to the Invaded Woody Community (2.1) with the implementation of an aggressive prescribed burning program will eliminate the encroaching eastern redcedar. Mechanical removal will also aid in reversing the invasion.
Conservation practices
Brush Management Prescribed Burning State 3
Sod-busted StateThe threshold to the Sod-busted State (3) is crossed as a result of mechanical disturbance to facilitate production agriculture. If farming operations are suspended, the site can be abandoned or seeded. Abandonment results in the Natural Reclamation Community (3.3). Seedings are either a tame pasture forage mixture, the Seeded Pasture Community (3.2), or a mixture of native grasses and forbs, the Reseeded Native Grass Community (3.1).
Permanent alterations of the soil community and the hydrologic cycle make restoration to the Reference State (1) extremely difficult, if not impossible. Formation of a compacted plow pan in the soil profile is likely.Community 3.1
Reseed Native Grass CommunityThe Reseeded Native Grass Community (3.1) does not contain native remnants, and varies considerably depending upon the seed mixture, the degree of soil erosion, the age of the stand, fertility management, and past grazing management. Prescribed grazing with adequate recovery periods will be required to maintain productivity and desirable species.
Native range and grasslands seeded to native species are ecologically different and should be managed separately. Factors such as functional group, species, stand density, and improved varieties all impact the production level and palatability of the seedings. Species diversity is often limited, and when grazed in conjunction with native rangelands, uneven forage utilization may occur.
Total annual production during an average year varies significantly depending upon precipitation, management, and grass species seeded.Community 3.2
Seeded Pasture CommunityThe Seeded Pasture Community (3.2) does not contain native remnants and varies considerably depending upon the extent of soil erosion, the species seeded, the quality of the stand that was established, the age of the stand, and management of the stand since establishment.
There are several factors that make seeded tame pasture a different grazing resource than native rangeland and land seeded to a native grass mixture. Factors such as species selected, stand density, improved varieties, and harvest efficiency all impact production levels and palatability. Species diversity on seeded tame pasture is often limited to a few species. When seeded pasture and native rangelands or seeded pasture and seeded rangeland are in the same grazing unit, uneven forage utilization will occur. Improve forage utilization and stand longevity by managing this community separately from native rangelands or land seeded to native grass species.
Total annual production during an average year varies significantly depending on the level of management and species seeded. Improved varieties of warm-season or cool-season grasses are recommended for optimum forage production.Community 3.3
Natural Reclamation CommunityThe Natural Reclamation Community (3.3) consists of annual and perennial weeds and less desirable grasses. These sites have been farmed and abandoned without being reseeded. Soil organic matter and carbon reserves are reduced, soil structure is changed, and a plowpan or compacted layer can form, which decreases water infiltration. Residual synthetic chemicals may remain from farming operations. In early successional stages, this community is not stable. The hazard of erosion is a concern.
Total annual production during an average year varies significantly depending on the succession stage of the plant community and any management applied to the system.Transition T1A
State 1 to 2Heavy, continuous, season long grazing, rotational grazing with inadequate growing season recovery periods (deferment), or haying with inadequate recovery periods will cause the Reference State (1) to lose a significant proportion of warm-season, tall and mid grass species and cross a threshold to the Native/Invaded State (2). Water infiltration and other hydrologic functions will be reduced due to the root matting presence of sod forming grasses. With the decline and loss of deeper penetrating root systems, soil structure and biological integrity are catastrophically degraded to the point that recovery is unlikely. Additionally, increasing woody encroachment also occurs due to overgrazing and lack of fire and woody species management. The expansion of the overstory blocks more sunlight, creating a more competitive environment for a shade tolerant understory. Mechanical removal with follow up stump treatment of the root sprouting species and implementation of a prescribed burning regime will limit the encroachment of woody species. Once this transition occurs, it is highly unlikely that grazing management and woody species management alone will return the community to the Reference State (1).
Transition T1B
State 1 to 3The threshold to the Sod-busted State (3) is crossed as a result of mechanical disturbance to facilitate production agriculture. If farming operations are suspended, the site can be abandoned, which will result in the Natural Reclamation Community (3.3), or be seeded to a tame pasture forage mixture, the Seeded Pasture Community (3.2) or to a mixture of native grasses and forbs, the Reseeded Native Grass Community (3.1).
Transition T2A
State 2 to 3The threshold to the Sod-busted State (3) is crossed as a result of mechanical disturbance to facilitate production agriculture. If farming operations are suspended, the site can be abandoned, which will result in the Natural Reclamation Community (3.3), or be seeded to a tame pasture forage mixture, the Seeded Pasture Community (3.2) or to a mixture of native grasses and forbs, the Reseeded Native Grass Community (3.1).
Additional community tables
Table 5. Community 1.1 plant community composition
Group Common name Symbol Scientific name Annual production () Foliar cover (%) Table 6. Community 1.2 plant community composition
Group Common name Symbol Scientific name Annual production () Foliar cover (%) Table 7. Community 1.3 plant community composition
Group Common name Symbol Scientific name Annual production () Foliar cover (%) Table 8. Community 1.4 plant community composition
Group Common name Symbol Scientific name Annual production () Foliar cover (%) Table 9. Community 2.1 plant community composition
Group Common name Symbol Scientific name Annual production () Foliar cover (%) Table 10. Community 2.2 plant community composition
Group Common name Symbol Scientific name Annual production () Foliar cover (%) Table 11. Community 3.1 plant community composition
Group Common name Symbol Scientific name Annual production () Foliar cover (%) Table 12. Community 3.2 plant community composition
Group Common name Symbol Scientific name Annual production () Foliar cover (%) Table 13. Community 3.3 plant community composition
Group Common name Symbol Scientific name Annual production () Foliar cover (%) Interpretations
Animal community
Animal Community
LIVESTOCK – GRAZING INTERPRETATIONS:
Grazing by domestic livestock, primarily cattle, is one of the primary uses of the native grasslands. Rangeland in this area may provide yearlong forage. These sites are also hayed. During the dormant period, the protein levels of the forage may be lower than the minimum needed to meet livestock requirements and added protein will allow ruminants to better utilize the energy stored in grazed plant materials. A forage quality test (either directly or through fecal sampling) should be used to determine the level of supplementation needed. Stocking rates should be determined after a field visit to document plant composition and production. Carrying capacity estimates should be calculated using this information along with animal preference data, particularly when grazers other than cattle are involved. Under continuous, season long grazing, carrying capacity and stocking rates based upon a harvest efficiency of 25 percent is recommended. More intensive grazing management may result in improved harvest efficiencies and increased carrying capacities may be feasible.
Production and Carrying Capacity*
Community 1.1, Reference Community: 4,250 lbs/acre, 1.34 AUM/acre
*Based upon the following conditions: continuous season long grazing with cattle under average growing conditions, 25 percent harvest efficiency. Air dry forage requirements are based on 3 percent of animal body weight or 790 lbs per animal unit (AU) per month (M). An AU is generally one mature cow of approximately 1,000 pounds and a calf as old as 6 months or their equivalent.
WILDLIFE INTERPRETATIONS:
Major Land Resource Area (MLRA) 106 lies primarily within the tall grass prairie ecosystem. Prior to European settlement of North America, this area consisted of diverse grassland habitats interspersed with varying densities of depressional wetlands and limited woody riparian corridors. These habitats provided critical life cycle components for the grassland birds, prairie dogs, and herds of roaming bison, elk, and pronghorn that historically occupied this landscape. Diverse populations of small mammals and insects provided a bountiful prey base for raptors and omnivores such as coyotes, foxes, raccoons, and opossums. Bobcats, wolves, and mountain lions occupied the apex predator niche. In addition, a wide variety of reptiles and amphibians thrived in this landscape.
The tall grass prairie was a disturbance driven ecosystem with fire, herbivory, and climate functioning as the primary disturbances. Following European settlement of North America, elimination of fire, widespread conversion to cropland, and other sources of habitat fragmentation significantly altered the appearance and functionality of the entire ecosystem. The reduced stability of the system is reflected by major changes in the composition and abundance of the native flora and fauna. Introduced and invading species further degrade the ecological integrity of the plant and animal communities. Bison and prairie dogs were historically keystone species, but free roaming bison herds and nearly all prairie dogs have been extirpated in this region. The loss of bison and fire as ecological drivers greatly influenced the character of the remaining native grasslands and the habitats they provide.
Historically, an ecological mosaic of the sites provided habitat for species requiring unfragmented grasslands. Important habitat features and components found commonly or exclusively on modern day remnants include upland nesting habitat for grassland birds and game birds; nesting and escape cover for waterfowl; forbs and insects for brood rearing habitat; and a forage source for small and large herbivores. Fragmentation has reduced habitat quality for numerous area sensitive species, as highlighted by the decline of the greater prairie chicken. Grassland nesting bird populations such as dickcissel and Henslow's sparrow are also declining. In this fragmented landscape, native grassland bird populations face increasing competition from the opportunistic European starlings and house sparrows and are subject to nest parasitism from brown headed cowbirds. Tree encroachment creates habitat that favors generalist species such as American robin and mourning dove, and provides perches for raptors, increasing the predation mortality. Introduced species such as smooth bromegrass, reed canary grass, Kentucky bluegrass, nodding plumeless thistle (musk thistle), and Canada thistle further degrade the biological integrity of many of these remnant prairies.
1. REFERENCE STATE: The predominance of tall grasses and forbs in this community makes it ideal for grazers and mixed feeders. Pollinating insects play a significant role in maintaining the forb community and provide a food source for birds and other grassland dependent species. The vegetative structural diversity provides habitat for reptiles, amphibians, and a wide array of native and introduced bird species. The abundant prey base supports populations of Swainson’s hawk, short eared and great horned owls, and other raptors. The grasses, forbs, and shrubs provide high nutrition levels for small and large herbivores including moles, mice, ground squirrels, and white-tail deer. The structure of this plant community provides suitable thermal, protective, and escape cover for small herbivores and birds. Many wide-ranging predators utilize this plant community, including coyote, badger, red fox, and least and long tailed weasels. As the plant community degrades to more mid grasses and fewer tall grasses, less winter and escape cover are provided.Hydrological functions
The very deep, well drained soils of the Savannah ecological site, along with the low run off potential, place it in classes A and C of the hydrological rating scale. These soils can be susceptible to serious erosion. Please refer to the NRCS National Engineering Handbook Section 4 (NEH-4) for runoff quantities and hydrologic curves when making hydrology determinations.
Recreational uses
This site provides hunting for upland game species and white-tailed deer, along with hiking, photography, and bird watching. The wide varieties of plants which bloom from spring until fall have an aesthetic value that appeals to visitors.
Wood products
A mature overstory can provide a limited amount of timber, posts, and firewood.
Other products
No appreciable other products.
Other information
Site Development and Testing Plan:
Future work is needed to validate the information in this Provisional Ecological Site Description. Additional data collection and evaluation may also be needed to develop this ESD to the Approved, then Correlated level. This could include field activities to collect low, medium, and high intensity sampling, soil correlations, and analysis of that data. Field reviews of the project plan should be done by soil scientists and vegetation specialists. A final field review, peer review, quality control, and quality assurance reviews of the ESD will be needed to produce the final document.Supporting information
Inventory data references
Historical accounts and data are supplemented by expert opinions from resource professionals.
Other references
Harms, R. 2009. Recovery Outline for the Salt Creek tiger beetle (Cicindela nevadica lincolniana). Available online. http://www.fws.gov/mountain-prairie/species/invertebrates/saltcreektiger/FinalRecoveryOutlineFeb2009.pdf. Accessed 1/02/2018.
High Plains Regional Climate Center, University of Nebraska. Available online. http://hpcc.unl.edu. Accessed 12/05/16.
Johnsgaard, P.A. 2001. “The Nature of Nebraska.” University of Nebraska Press.
Muhs, Daniel R., E. Bettis III, J. Aleinikoff, J. McGeehin, J. Beann, G. Skipp, B. Marshall, H. Roberts, W. Johnson, and R. Benton. "Origin and paleoclimatic significance of late Quaternary loess in Nebraska: Evidence from stratigraphy, chronology, sedimentology, and geochemistry" (2008). USGS Staff -- Published Research, Paper 162. Available online. http://digitalcommons.unl.edu/usgsstaffpub/162. Accessed 12/05/16.
Personal communications with professional ecologists and wildlife experts.
Rolfsmeier, S.B. and G. Steinauer. 2010. "Terrestrial Ecological Systems and Natural Communities of Nebraska", (version IV). Nebraska Natural Heritage Program.
Spomer, S. and L. Higley. 2001. The Salt Creek Tiger Beetle. Bio-graphica International. Available online. http://drshigley.com/lgh/sctb/default.htm. Accessed 1/02/2018.
U.S. Dept. of Agriculture. NRCS National Ecological Site Handbook. Available online. https://www.nrcs.usda.gov/wps/portal/nrcs/detailfull/soils/ref/?cid=nrcseprd1291232 Accessed January, 2014.
U.S. Dept. of Agriculture. NRCS National Engineering Handbook, Section 4. Available online. https://directives.sc.egov.usda.gov/viewerFS.aspx?hid=21422. Accessed August, 2011
USDA, NRCS. National Water and Climate Center, Portland, OR. Available online. http://wcc.nrcs.usda.gov. Accessed 12/05/16.
USDA, NRCS.1997. National Range and Pasture Handbook.
USDA, NRCS. National Soil Information System, Information Technology Center, Fort Collins, CO. Available online. http://nasis.nrcs.usda.gov. Accessed 12/05/16.
USDA, NRCS. 2002. The PLANTS Database, Version 3.5. Available online. http://plants.usda.gov. Accessed 12/05/16.
USDA, NRCS Soil Surveys from: Butler, Saunders, Lancaster, Cass, Otoe, Nemaha, Johnson, Gage, Pawnee, Saline, Seward, Saunders and Richardson Counties in Nebraska; and Atchison, Brown, Doniphan, Douglas, Franklin, Jackson, Jefferson, Johnson, Leavenworth, Marshall, Nemaha, Osage, Pottawatomie, Shawnee, Wabaunsee, Washington, Wyandotte Counties in Kansas.Contributors
Doug Whisenhunt
Nadine BishopApproval
Suzanne Mayne-Kinney, 6/09/2025
Rangeland health reference sheet
Interpreting Indicators of Rangeland Health is a qualitative assessment protocol used to determine ecosystem condition based on benchmark characteristics described in the Reference Sheet. A suite of 17 (or more) indicators are typically considered in an assessment. The ecological site(s) representative of an assessment location must be known prior to applying the protocol and must be verified based on soils and climate. Current plant community cannot be used to identify the ecological site.
Author(s)/participant(s) Anna Ferguson, Aaron Hird, Justin Linder, Dusty Schwandt, Doug Spencer, Chris Tecklenburg, Nadine Bishop, Jeff Nichols Contact for lead author jeffrey.nichols@usda.gov Date 11/30/2024 Approved by Approval date Composition (Indicators 10 and 12) based on Annual Production Indicators
-
Number and extent of rills:
None. Rills are not expected on this site. -
Presence of water flow patterns:
Typically, none. Water flow patterns are not expected on this site except on slopes exceeding 15 percent. When present, water flow patterns will be rare, short (6 to 12 inches or 15 to 30 cm) and disrupted by perennial vegetation. -
Number and height of erosional pedestals or terracettes:
None. Pedestals and terracettes are not expected to occur on this site. -
Bare ground from Ecological Site Description or other studies (rock, litter, lichen, moss, plant canopy are not bare ground):
Bare ground is 5 percent or less. Bare ground is exposed mineral soil that is not covered by vegetation (basal and/or foliar canopy), litter, standing dead vegetation, gravel/rock, and visible biological crust (e.g., lichen, mosses, algae). -
Number of gullies and erosion associated with gullies:
None. Gullies are not expected on this site. -
Extent of wind scoured, blowouts and/or depositional areas:
None. Wind scoured and/or depositional areas are not expected on this site. -
Amount of litter movement (describe size and distance expected to travel):
Typically, none. Litter movement is not expected on this site except on slopes exceeding 15 percent and due to high intensity storms. In this case, fine litter movement will be short distances of 6 to 12 inches (15 to 30 cm) and be associated with water flow patterns. -
Soil surface (top few mm) resistance to erosion (stability values are averages - most sites will show a range of values):
Soil stability ratings will be 5 to 6, typically 6. High root content and organic matter will be present in the soil surface. -
Soil surface structure and SOM content (include type of structure and A-horizon color and thickness):
The A-horizon ranges from 10 to 20 inches thick. Soil colors in the surface horizon are typically very brown, dark brown, or very dark grayish brown (hue: 10YR, value: 2 to 5, chroma: 2 or 3) when moist and brown, grayish brown, or pinkish gray (hue: 7.5YR or 10YR, value: 3 to 6, chroma: 2 or 3) when dry. Soil structure in the upper horizon typically ranges from weak fine granular to weak medium granular to moderate fine granular. See Official Soils Descriptions for additional details. The primary soil series correlated to the site include Falleaf and Grinter. Other series include Konawa and Welda. -
Effect of community phase composition (relative proportion of different functional groups) and spatial distribution on infiltration and runoff:
Plant community composition of 60 to 75 percent grasses and grass-likes, 5 to 10 percent forbs, 5 to 10 percent shrubs, and 10 to 20 percent trees, will optimize infiltration on the site. The grass and grass-like portion are composed of warm-season, tall grass; warm-season, mid grass; cool-season grass; warm-season, short grass; and grass-likes. Infiltration can be adversely impacted by the invasion of Kentucky bluegrass, smooth brome, tall fescue, and trees when present above 25 percent (dominant designation). -
Presence and thickness of compaction layer (usually none; describe soil profile features which may be mistaken for compaction on this site):
None. No compaction layers are expected for this site. -
Functional/Structural Groups (list in order of descending dominance by above-ground annual-production or live foliar cover using symbols: >>, >, = to indicate much greater than, greater than, and equal to):
Dominant:
Phase 1.1: 1. Native, perennial, warm-season, tall grass (3 species minimum): big bluestem, Indiangrass, eastern gamagrass, switchgrass. 2. Native, perennial, warm season, mid grass (2 species minimum): little bluestem, composite dropseed, sideoats grama, purple lovegrass. Phase 1.2: 1. Native, perennial, warm season, mid grass (3 species minimum): little bluestem, composite dropseed, sideoats grama, purple lovegrass. Phase 1.3: 1. Native, perennial, warm season, mid grass (2 species minimum): little bluestem, composite dropseed, sideoats grama, purple lovegrass. 2. Native, perennial, warm-season, short grass (1 species minimum): blue grama, hairy grama.Sub-dominant:
Phase 1.1: 1. Native, deciduous trees (2 species minimum): oak, hickory, elm. and other trees which vary from location to location. Phase 1.2: 1. Native, perennial, warm season, tall grass (2 species minimum): big bluestem, Indiangrass, eastern gamagrass, switchgrass. 2. Native, deciduous trees (2 species minimum): oak, hickory, elm and other trees which vary from location to location. Phase 1.3: 1. Native, deciduous trees (2 species minimum): oak, hickory, elm and other trees that vary from location to location. 2. Shrubs (2 species minimum): coralberry, smooth sumac, prairie rose, western snowberry. 3. Native, perennial, cool-season grass (2 species minimum): porcupinegrass, Canada wildrye, prairie junegrass, western wheatgrass, Scribner rosette grass, fall rosette grass.Other:
Minor - Phase 1.1: 1. Shrubs: smooth sumac, rough leaf dogwood, snowberry, leadplant, jersey tea and other shrubs that vary from location to location. 2. Native forbs: forbs present vary from location to location. 3. Native, perennial, warm-season, short grass: blue grama, hairy grama. 4. Native, perennial, cool-season grass: porcupinegrass, Canada wildrye, prairie junegrass, western wheatgrass, Scribner rosette grass, fall rosette grass. Minor - Phase 1.2: 1. Native, perennial, warm-season, short grass: blue grama, hairy grama. 2. Native, perennial, cool-season grass: porcupinegrass, Canada wildrye, prairie junegrass, western wheatgrass, Scribner rosette grass, fall rosette grass. 3. Native forbs: forbs present vary from location to location. 4. Grass-likes: sedges. 5. Shrubs: smooth sumac, prairie rose, western snowberry, rough leaf dogwood and other shrubs that vary from location to location. Minor - Phase 1.3: 1. Native, perennial, warm-season, tall grass: big bluestem, switchgrass. 2. Non-native, cool-season grass: Kentucky bluegrass, smooth brome, tall fescue. 3. Native forbs: forbs present vary from location to location. 4. Grass-likes: sedges. Trace - Phase 1.2: 1. Non-native, cool-season grass: Kentucky bluegrass, tall fescue, smooth brome.Additional:
The Reference Community (1.1) includes eight F/S groups. These groups in order of abundance are native, perennial, warm-season, tall grass; native, perennial, warm-season, mid grass; native, deciduous trees; shrubs; forbs; native, perennial, warm-season, short grass; native, perennial, cool-season grass; grass-likes. The Degraded Native Community (1.2) includes nine F/S groups. These groups are native, perennial, warm-season, mid grass; native, perennial, warm-season, tall grass; native, deciduous trees; shrubs; native, perennial, warm-season, short grass; native, perennial, cool-season grass; forbs; grass-likes; non-native, cool-season grass. The At-Risk Community (1.3) includes nine F/S groups. These groups are native, perennial, warm-season, mid grass; native, perennial, warm-season, short grass; native, deciduous trees; shrubs; native, perennial, cool-season grass; native, perennial, warm-season, tall grass; non-native, cool-season grass; forbs; grass-likes. -
Amount of plant mortality and decadence (include which functional groups are expected to show mortality or decadence):
Recruitment of plants is occurring; there is a diverse mixture of age classes among the plants. A few (less than 3 percent) dead centers may occur in bunch grasses. Shrubs may show some dead branches (less than 5 percent) as plants age. Plant mortality may increase to 10 to 15 percent following a multi-year drought, wildfire, or a combination of the two events. -
Average percent litter cover (%) and depth ( in):
Plant litter is expected to be 70 to 80 percent cover, at a depth of approximately 0.5 inch (1.25 cm) and evenly distributed throughout the site. Kentucky bluegrass is known to produce excessive litter accumulations that negatively impact site functionality. -
Expected annual annual-production (this is TOTAL above-ground annual-production, not just forage annual-production):
Production is shown in air-dry values. Representative Value (RV) = 3,800 pounds per acre. Low production years = 2,812 pounds per acre. High production years = 4,940 pounds per acre. -
Potential invasive (including noxious) species (native and non-native). List species which BOTH characterize degraded states and have the potential to become a dominant or co-dominant species on the ecological site if their future establishment and growth is not actively controlled by management interventions. Species that become dominant for only one to several years (e.g., short-term response to drought or wildfire) are not invasive plants. Note that unlike other indicators, we are describing what is NOT expected in the reference state for the ecological site:
No non-native invasive species are present. Kentucky bluegrass, smooth brome, Caucasian bluestem, tall fescue, eastern red cedar, honey locust, rough leaf dogwood, Siberian elm, Osage orange, leafy spurge, and sericea lespedeza are known invasives that have the potential to be dominant or co-dominant on the site. Consult the state noxious weed and state watch lists for potential invasive species on each ecological site. NOTE: Invasive plants (for the purposes of the IIRH protocol) are plant species that are typically not found on the ecological site or should only be in trace or minor categories under the natural disturbance regime and have the potential to become a dominant or co-dominant species on the site if their establishment and growth are not actively controlled by natural disturbances or management interventions. Species listed characterize degraded states AND have the potential to become a dominant or co-dominant species. -
Perennial plant reproductive capability:
All perennial species exhibit high vigor relative to climatic conditions. Perennial grasses should have vigorous rhizomes or tillers; vegetative and reproductive structures are not stunted. All perennial species should be capable of reproducing annually.
Print Options
Sections
Font
AAAAOther
PrintThe Ecosystem Dynamics Interpretive Tool is an information system framework developed by the USDA-ARS Jornada Experimental Range, USDA Natural Resources Conservation Service, and New Mexico State University.
Accessibility statement


