
Natural Resources
Conservation Service
Ecological site F099XY013MI
Wet Lake Plain Flats
Last updated: 6/04/2024
Accessed: 08/16/2026
-
Search


Major Land Resource Area or ecological site by name and/or ID.
PreviousSectionsNextGeneral information
Provisional. A provisional ecological site description has undergone quality control and quality assurance review. It contains a working state and transition model and enough information to identify the ecological site.
Click to explore map
Figure 1. Mapped extent
Areas shown in blue indicate the maximum mapped extent of this ecological site. Other ecological sites likely occur within the highlighted areas. It is also possible for this ecological site to occur outside of highlighted areas if detailed soil survey has not been completed or recently updated.
MLRA notes
Major Land Resource Area (MLRA): 099X–Erie-Huron Lake Plain
This area is in the Eastern Lake Section of the Central Lowland Province of the Interior Plains (USDA-NRCS, 2022). It is a nearly level glacial lake plain with a few scattered ridges of sand that represent past shorelines and moraines. The Saginaw, Clinton, and Huron Rivers empty into the Great Lakes in the part of the area in Michigan. The southern half of this area is covered with glacial deposits of till, lake sediments, and outwash from the Wisconsin and older glacial periods. The area also has some low moraines. Mississippian- to Silurian-age shale, limestone, and dolomite rocks are at or near the surface close to Lake Erie and Lake Huron. Sandstone comes near the surface in the Thumb area east of Saginaw Bay, and a sandstone headland exists on a short stretch of Lake Huron shoreline. An extensive swamp in proximity the Maumee River prevented overland travel prior to its drainage by early settlers. Remnant marshes are near the Lake Erie shore.
The dominant soils in this MLRA are Alfisols, Inceptisols, Mollisols, and Spodosols. The soils in the area dominantly have a mesic soil temperature regime, an aquic soil moisture regime, and mixed or illitic mineralogy. Most soils in MLRA 99 are very deep, generally somewhat poorly drained to very poorly drained, and loamy or clayey. Epiaqualfs (Blount, Hoytville, Nappanee, and Shebeon series) and Glossudalfs (Capac series) formed in till (some of which is dense) on till plains, moraines, and lake plains. Epiaquepts formed in loamy till on till plains and moraines (Kilmanagh series) and in lacustrine deposits on lake plains (Lenawee and Paulding series). Endoaquepts formed in lacustrine deposits on lake plains (Latty and Toledo series) and in loamy till on moraines (Parkhill series). Endoaquolls formed in outwash deposits on outwash plains and lake plains, in drainageways (Granby series), and in loamy till on till plains and moraines (Tappan series). Endoaquods (Pipestone series) formed in outwash deposits on outwash plains, lake plains, and beach ridges. Epiaquods (Wixom series) formed in sandy sediments over till or lacustrine deposits on till plains, outwash plains, and lake plains.
Broad flat areas of somewhat poorly drained soils support Landfire (2017) systems: North-Central Interior Beech-Maple Forest, with wetter patches of North-Central Interior Wet Flatwoods, and Central Interior and Appalachian Swamp. Sandy beach ridges and thin sand flats have Landfire (2017) systems: North-Central Interior Dry-Mesic Oak Forest and Woodland and Great Lakes Wet-Mesic Lakeplain Prairie. Central Interior and Appalachian Floodplain Systems occur adjacent to rivers that flow through the area. To the north, oak systems decline in coverage. Thin sandy flats in the north have Laurentian-Acadian Pine-Hemlock-Hardwood Forest. The north and south are best separated as ecological inference areas due to floristic and dominant vegetation contrasts which also correspond to generally lower summer and winter temperatures northward. This north-south break is approximated by the drainage divide between the Lake Huron and Lake Erie/Lake St. Clair basins.
Nearly three-fourths of this MLRA is in farms. About three-fifths of the area is cropland. The rest of the farmland is mostly in small farm woodlots, but some of the farmland is used for permanent pasture or other purposes. Cash crops are important. Corn, winter wheat, soybeans, and hay are the major crops. Sugar beets and canning crops also are important. Some fruit and truck crops are grown on the coarse textured soils. Dairying is an important enterprise on some farms near the larger cities. Almost one-fifth of the area is used for urban development. Shiawassee National Wildlife Refuge, Cedar Point National Wildlife Refuge, Oak Openings Preserve Metropark (Ohio) are among the more notable conservation lands.
Summary of existing land use (South):
Upland Forest (7%)
Hardwood (6%)
Agricultural (60%)
Developed (28%)
Summary of existing land use (North):
Upland Forest (14%)
Hardwood (13%)
Agricultural (58%)
Developed (13%)
Swamps and Marshes (13%)Classification relationships
The USFS ecoregion classification (Cleland et al., 2007) for the majority of MLRA 99 is the Humid Temperate, Hot Continental Division, Midwest Broadleaf Forest Province 222, Lake Whittlesey Glaciolacustrine Plain Section 222U. The ecoregion subsection composition is 222Ud (Sandusky Lake Plain) and 222Ue (Saginaw Clay Lake and Till Plain) in the north near Lake Huron and Saginaw Bay. In the south near Lake Erie, the area is composed of subsections 222Ua (Maumee Lake Plain), 222Ub (Paulding Plains), and 222Uc (Marblehead Drift/Limestone Plain). A mix of interlobate deposits extends into MLRA 99 as subsection 222Jf (Lum Interlobate Moraine) of South Central Great Lakes Section 222J. Sandy deposits extend south from adjacent MLRA are part the Warm Continental Division, Laurentian Mixed Forest Province 212, Northern Lower Peninsula Section 212H, subsection 212Hh (Gladwin Silty Lake Plain).
The Saginaw Bay and Lake Huron lake plains is coextensive with EPA ecoregion 57e (Saginaw Lake Plain) (Omernik and Griffith, 2014). The majority of the Lake Erie or Maumee Lake Plain includes EPA ecoregion 57a (Maumee Lake Plain), extending east to include 57d (Marblehead Drift/Limestone Plain). Large inclusions of sand are delineated as ecoregion 57b (Oak Openings). A significant area of higher clay is designated as 57c (Paulding Plains).Ecological site concept
The central concept of the Wet Lake Plain Flats is loamy to clayey wave worked till and lacustrine deposits with a persistently high water table, often with a horizon of very low saturated hydraulic conductivity within 100 cm of the surface. Site is generally found in depressions or extensive flats and is poorly drained or very poorly drained. Due to very low saturated conductivity, some depressional locations are subject to ponding from local rainfall events, but with little groundwater input. Therefore vegetation is potentially similar to that of a floodplain forest in that it is subject to periodic inundation followed by periods of dryness.
Associated sites
F099XY007MI Lake Plain Flats
Similar sites
F098XA012MI Wet Loamy Depressions
Table 1. Dominant plant species
Tree (1) Acer saccharinum
(2) Ulmus americanaShrub (1) Cephalanthus occidentalis
Herbaceous Not specified
Physiographic features
Site occurs on extensive flats on wave reworked till or lacustrine deposits.
Table 2. Representative physiographic features
Landforms (1) Lake plain
(2) Flat
Runoff class Negligible to low Elevation 571 – 896 ft Water table depth 0 – 10 in Aspect Aspect is not a significant factor Climatic features
This ecological site experiences a humid continental climate with mild summers and cold winters. Precipitation is moderately well distributed through the year with higher amounts during the growing season than the winter.
Temperature extremes are moderated in immediate proximity to the Great Lakes, but this moderation has minimal effect inland due to prevailing winds blowing mainly offshore. Mean annual extreme minimum temperatures range from -26.6 to -18.8 °C (-16 to -2 °F), which falls within hardiness zones 5a to 6a (USDA, 2009). In general, temperatures are cooler northward, though local city heat island effects may interrupt this pattern.
The lack of significant topographic relief and general downwind direction to the Great Lakes likely contribute to this MLRA having lower annual precipitation and snowfall compared to the MLRA to the west. Mean annual snowfall ranges from 0.7 to 1.5 m (25 to 55 in). In general, snowfall is highest northward.Table 3 Representative climatic features
Frost-free period (characteristic range) 130-150 days Freeze-free period (characteristic range) 160-190 days Precipitation total (characteristic range) 810-890 in Frost-free period (actual range) 110-150 days Freeze-free period (actual range) 150-190 days Precipitation total (actual range) 810-940 in Frost-free period (average) 140 days Freeze-free period (average) 170 days Precipitation total (average) 860 in Characteristic rangeActual rangeBarLineFigure 2. Monthly precipitation range
Characteristic rangeActual rangeBarLineFigure 3. Monthly minimum temperature range
Characteristic rangeActual rangeBarLineFigure 4. Monthly maximum temperature range
BarLineFigure 5. Monthly average minimum and maximum temperature
Figure 6. Annual precipitation pattern
Figure 7 Annual average temperature pattern
Climate stations used
-
(1) MT CLEMENS ANG BASE [USW00014804], Harrison Township, MI
-
(2) GLADWIN [USW00014828], Beaverton, MI
-
(3) ALMA [USC00200146], Alma, MI
-
(4) MONROE [USC00205558], Monroe, MI
-
(5) SAGINAW #3 [USC00207222], Saginaw, MI
-
(6) PANDORA [USC00336405], Pandora, OH
-
(7) PAULDING [USC00336465], Paulding, OH
-
(8) TIFFIN [USC00338313], Tiffin, OH
-
(9) SAGINAW MBS INTL AP [USW00014845], Freeland, MI
-
(10) ESSEXVILLE [USC00202631], Bay City, MI
-
(11) STANDISH 5SW [USC00207820], Bentley, MI
-
(12) YALE 1 NNW [USC00209188], Yale, MI
-
(13) FINDLAY WPCC [USC00332791], Findlay, OH
-
(14) SANDUSKY [USW00014846], Sandusky, OH
-
(15) TOLEDO EXPRESS AP [USW00094830], Monclova, OH
-
(16) BAD AXE [USC00200417], Bad Axe, MI
-
(17) CASS CITY 1 SSW [USC00201361], Cass City, MI
-
(18) MIDLAND [USC00205434], Midland, MI
-
(19) FREMONT [USC00332974], Fremont, OH
-
(20) FREMONT AG STN [USC00332976], Fremont, OH
-
(21) NAPOLEON [USC00335669], Napoleon, OH
-
(22) DETROIT METRO AP [USW00094847], Romulus, MI
-
(23) CARO WWTP [USC00201299], Caro, MI
-
(24) DEARBORN [USC00202015], Dearborn, MI
-
(25) SANDUSKY [USC00207350], Sandusky, MI
-
(26) HOYTVILLE 2 NE [USC00333874], Cygnet, OH
-
(27) WAUSEON WTP [USC00338822], Wauseon, OH
">Influencing water features
Site has seasonal high water table within 0-25 cm of the surface. Some sites may have a perched water table or ponding due to the impermeability of finer textures.<br />
Soil features
Soils are poorly drained to very poorly drained fine loam and clay. They are commonly classified Mollic Epiaquepts, Mollic Epiaqualfs, and Typic Epiaquolls, and commonly mapped as Hoytville, Parkhill, and Tappan series or components.
Table 4. Representative soil features
Parent material (1) Lacustrine deposits
(2) Till
Surface texture (1) Loam
(2) Clay
Drainage class Poorly drained to very poorly drained Permeability class Very slow to moderately rapid Soil depth 79 – 0 in Surface fragment cover <=3" 0 – 1 % Surface fragment cover >3" Not specified Available water capacity
(0-39.4in)5.12 – 8.66 in Soil reaction (1:1 water)
(0-19.7in)5.5 – 7 Subsurface fragment volume <=3"
(0-59.1in)0 – 35 % Subsurface fragment volume >3"
(0-59.1in)0 – 15 % Ecological dynamics
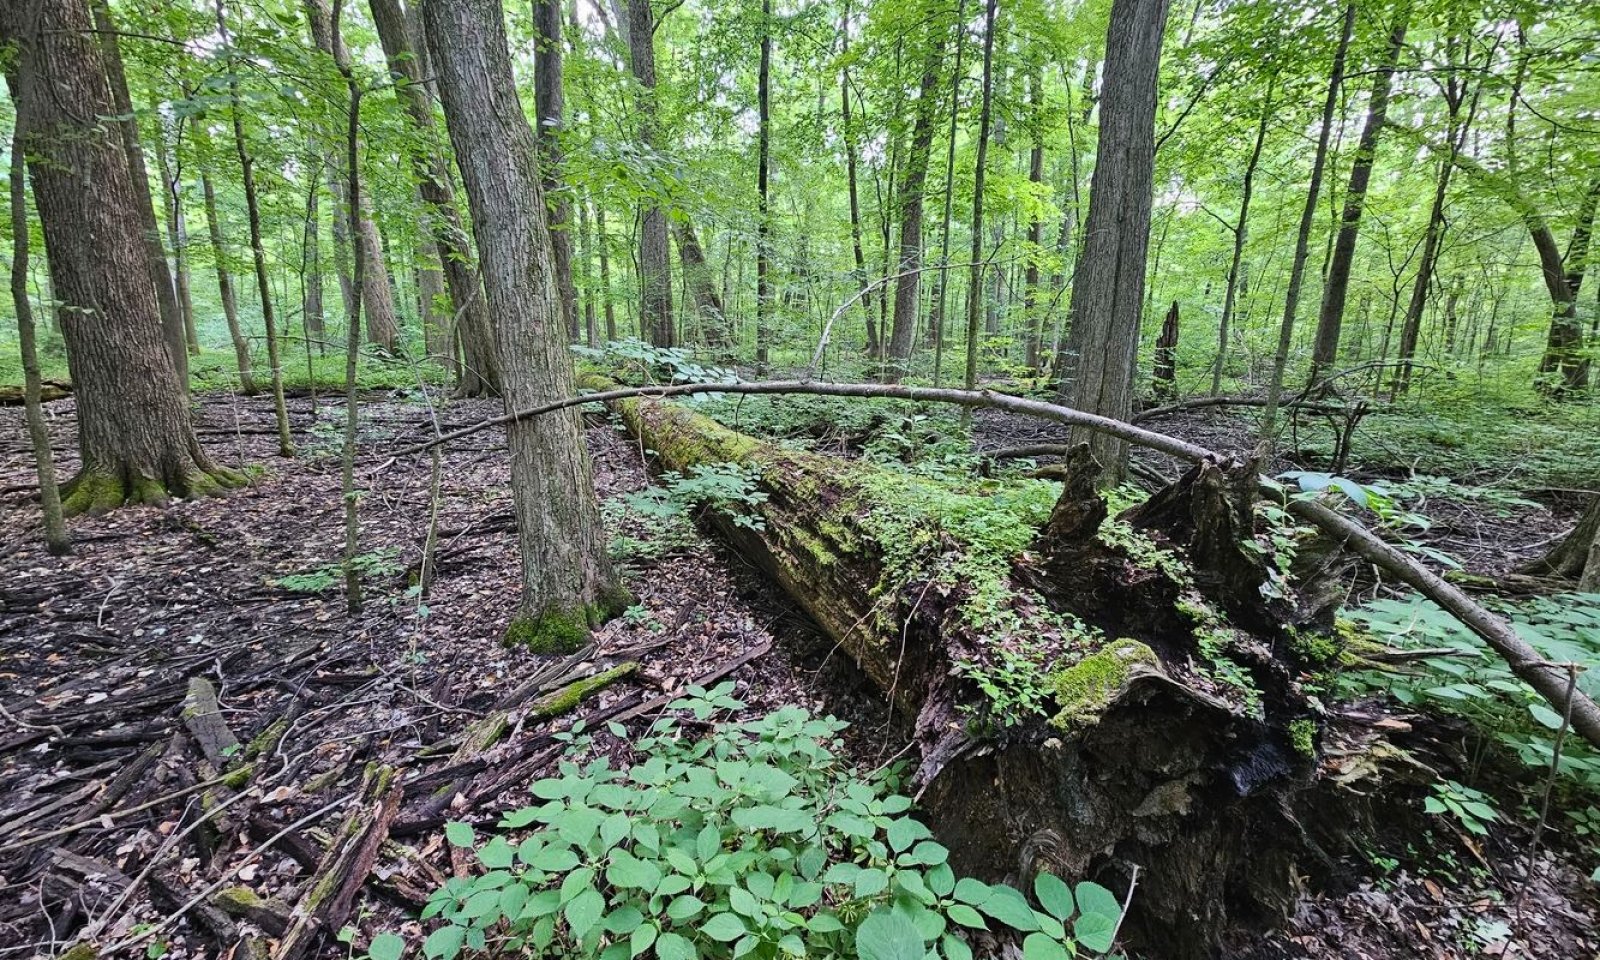
The reference community of Wet Lake Plain Flats is swamp forest dominated by Acer saccharinum (silver maple), Fraxinus pennsylvanica (green ash), Ulmus americana (American elm), Quercus bicolor (swamp white oak), and Populus deltoides (eastern cottonwood), with an understory of Onoclea sensibilis (sensitive fern), Carex grayi (Gray's sedge), Glyceria striata (fowl mannagrass), and Boehmeria cylindrica (smallspike false nettle). Quercus shumardii (Shumard's oak) is an uncommon, but distinctive associate of the reference swamp forest community in the southern half of the extent of this ecological site concept in southeast Michigan and northwest Ohio (Kost et al., 2010). The high fertility and seasonal ponding of this mineral soil site results in a species composition similar to that of floodplains. Wet anoxic soils favor facultative and obligate wetland species.
Hydrology affects the spatial zonation while changes in precipitation patterns and beaver flooding affects community dynamics. Windthrow is a frequent disturbance due to shallow rooting of tree in wet soils, but usually consists of single tree gaps, favoring the already established young, mainly intermediate to shade tolerant species to fill the gaps. Fire occurs infrequently in swamp forest where fuels are typically discontinuous, and adjacent uplands are mesophytic forest. In some landscape settings adjacent to oak savanna, fires may carry into a wet meadow community phase. The degree of permeability of deeper soil layers affects the degree to which the hydrology is dominated by a steady water table or more subjected to short term droughts and surface runoff events.
The speed of succession in wet meadows and shrub thickets is slowed by wet hydrology. But because these sites are only seasonally wet, most instances of open communities in this ecological site will quickly succeed to swamp forest.
Sedge dominated wet meadow may dominate the site for the first 10 years after a tree and shrub mortality event such as from fire (every 1000 years) or ponding (every 300 years). Shrub thickets may dominate the site for up to 30 years before conversion to forest. Trees establishing under shrubs surpass the shrubs at 3-5 m tall. At 30-80 years, the canopy will exceed 10 m. In absence of disturbance the forest at 80-400 years may exceed 30 m tall. As a tree approaches the maximum height of the forest, it is at constant risk of being toppled by windthrow, especially with shallower rooting depths in hydric mineral soils (this effect is even worse for structurally weak organic soils). Shade intolerant and fast-growing species like Populus deltoides and Salix nigra may persist to 100 years, but earlier canopy emergence, lower density wood (increased wood-rot) all conspire to more quickly thin these species without replacement, due to shade. Longer lived trees may persist but will also tend to replace themselves with understory recruitment (advanced regeneration), having seedlings and saplings able to tolerate moderate amounts of shade. Upland species (e.g. species from adjacent upland forests: Acer saccharum, Tilia americana, Quercus rubra, Quercus macrocarpa, and Fagus grandifolia) may also be present on tip-up mounds, where roots are elevated above the water table. Transitional to wet sandy depressions and mucky depressions in more permeable substrates and less dynamic water tables, the overstory composition shifts towards species less tolerant of long period inundation such as Acer rubrum and Fraxinus nigrum.
For most of the flora there is a tradeoff between shade tolerance and flood tolerance (Niinemets and Valladares, 2006). Consequently, some of the species most tolerant of wetness are among the least shade tolerant. The hydric species Acer saccharinum, Fraxinus pennsylvanica, Ulmus americana, and Quercus bicolor are all intermediate in shade tolerance, but are the most tolerant among the hydric species (especially Acer saccharinum). Populus deltoides and most Salix spp. Cephalanthus occidentalis and Alnus rugosa are very shade intolerant. Acer saccharinum, Populus deltoides, Salix nigra, and Cephalanthus occidentalis can persist long periods in standing water. The understory of a ponded swamp forest tends to be sparse, whereas less inundated areas may have thick understory intermediately shade tolerant Lindera benzoin, Ilex verticillata, Zanthoxylum americanum, Sambucus canadensis, and Sambucus racemosa, species which may also occur in open shrub thickets. Open shrub thickets have a variable composition of shade intolerant shrubs: Cornus obliqua, Cornus racemosa, Cornus sericea, Salix interior, Salix petiolaris, Salix eriocephala, Salix sericea.
The seeds of swamp species often lack dormancy because they must be able to germinate mid-growing season while water tables are low, and not be washed away during the winter. Because the sites tend to maintain surface moisture throughout the growing season, seedlings of many genera (Acer, Fraxinus, Ulmus, and Populus) do not need the extra provisions for quickly establishing deep taproots, enabling a strategy of small, prolific winged fruits or seeds capable dispersing longer distances to smaller wetland patches. Nevertheless, the site supports the coexistence of the large-seeded genera (e.g. Quercus and Carya), as reproductive tradeoffs are not absolute.
Invasive plants like Frangula alnus, Alliaria petiolata, Berberis thunbergii, and Rosa multiflora have greatly affected the dominant species composition. More than a few percentages of these species render the stand semi-natural. The introduction of Dutch elm disease and emerald ash borer have substantially reduced the importance of Ulmus americana and Fraxinus pennsylvanica. It is common to find snags associated with dead Ulmus and Fraxinus, as well has extensive down woody debris in stands where dominance of Fraxinus was more recent. Ulmus has been able to sexually reproduce and maintain itself decades after the initial disease introduction. The current flux of Fraxinus seedlings and saplings is apparently remnant reproduction from trees that managed to reach maturity prior to arrival of the invasive borer.State and transition model
More interactive model formats are also available. View Interactive Models
Click on state and transition labels to scroll to the respective textEcosystem states
SWAPAEHSWAPAEHSWAPAEHSWAPAEHSWAPAEHStates 1 and 5 (additional transitions)
SWAPAEHSWAPAEHState 1 submodel, plant communities
SWAPAEHSWAPAEHSWAPAEHSWAPAEHSWAPAEHCommunities 2 and 5 (additional pathways)
SWAPAEHSWAPAEHState 2 submodel, plant communities
State 3 submodel, plant communities
State 4 submodel, plant communities
State 5 submodel, plant communities
SWAPAEHState 1
Reference State
Dominant plant species
-
silver maple (Acer saccharinum), tree
-
American elm (Ulmus americana), tree
-
common buttonbush (Cephalanthus occidentalis), shrub
Community 1.1
Swamp Forest
Figure 8. Old growth swamp forest in Goll Woods State Nature Preserve, Fulton County, Ohio, rare remnant of the "Black Swamp" of northwestern Ohio.

Figure 9. Old growth swamp forest in Goll Woods State Nature Preserve, Fulton County, Ohio, rare remnant of the "Black Swamp" of northwestern Ohio.
Dominant plant species
-
silver maple (Acer saccharinum), tree
-
American elm (Ulmus americana), tree
Table 5. Canopy structure (% cover)
Height Above Ground (ft) Tree Shrub/Vine Grass/
GrasslikeForb <0.5 – 0-1% 0% 0-4% >0.5 <= 1 0-1% 0-8% 2-29% 3-18% >1 <= 2 0-1% 0-7% 1-29% 2-13% >2 <= 4.5 0% 0-1% – – >4.5 <= 13 0-12% 0-6% – – >13 <= 40 56-90% 0-2% – – >40 <= 80 65-91% – – – >80 <= 120 45-91% – – – >120 – – – – Community 1.2
Wet Meadow
Figure 10. Unspecified wet meadow showing representative variability in structure.
Table 6. Canopy structure (% cover)
Height Above Ground (ft) Tree Shrub/Vine Grass/
GrasslikeForb <0.5 – 0-1% 31-75% 16-47% >0.5 <= 1 – 0-1% 31-75% 16-47% >1 <= 2 16-48% 1-4% – – >2 <= 4.5 17-53% 1-4% – – >4.5 <= 13 5-15% 0% – – >13 <= 40 5-15% – – – >40 <= 80 5-15% – – – >80 <= 120 – – – – >120 – – – – Community 1.3
Shrub-Thicket
Figure 11. Unspecified shrub thicket showing representative structure.
Community 1.4
Emergent Marsh
Figure 12. Unspecified marsh showing structure.
Dominant plant species
-
broadleaf cattail (Typha latifolia), grass
-
woolgrass (Scirpus cyperinus), grass
Community 1.5
Inundated Shrub Swamp
Figure 13. Unspecified inundated (button bush) shrub swamp showing representative structure.
Forest overstory.Overstory is minimal except as edge of adjacent forest stands.
Forest understory. Composition typically consists of Cephalanthus occidentalis.
Dominant plant species
-
common buttonbush (Cephalanthus occidentalis), shrub
Table 7. Canopy structure (% cover)
Height Above Ground (ft) Tree Shrub/Vine Grass/
GrasslikeForb <0.5 – – – 5-5% >0.5 <= 1 – – 2-2% 5-5% >1 <= 2 – – 2-2% – >2 <= 4.5 – 95-95% – – >4.5 <= 13 – 95-95% – – >13 <= 40 – – – – >40 <= 80 – – – – >80 <= 120 – – – – >120 – – – – Pathway 1.1A
Community 1.1 to 1.2
Swamp Forest
Wet MeadowTemporary prolonged inundation.
Pathway 1.1B
Community 1.1 to 1.3
Swamp Forest
Shrub-ThicketClearcut/Blowdown.
Conservation practices
Early Successional Habitat Development/Management Forest Stand Improvement Pathway 1.2A
Community 1.2 to 1.1
Wet Meadow
Swamp ForestSuccession.
Conservation practices
Tree/Shrub Site Preparation Tree/Shrub Establishment Pathway 1.2B
Community 1.2 to 1.3
Wet Meadow
Shrub-ThicketSuccession.
Conservation practices
Tree/Shrub Site Preparation Tree/Shrub Establishment Pathway 1.2D
Community 1.2 to 1.4
Wet Meadow
Emergent MarshPermanent inundation.
Pathway 1.2E
Community 1.2 to 1.5
Wet Meadow
Inundated Shrub SwampShrub establishment; permanent inundation.
Conservation practices
Tree/Shrub Establishment Pathway 1.3A
Community 1.3 to 1.1
Shrub-Thicket
Swamp ForestSuccession.
Conservation practices
Tree/Shrub Site Preparation Tree/Shrub Establishment Pathway 1.3B
Community 1.3 to 1.2
Shrub-Thicket
Wet MeadowTemporary prolonged inundation.
Pathway 1.3C
Community 1.3 to 1.4
Shrub-Thicket
Emergent MarshPermanent inundation.
Pathway 1.3C
Community 1.3 to 1.5
Shrub-Thicket
Inundated Shrub SwampPermanent inundation.
Pathway 1.4A
Community 1.4 to 1.2
Emergent Marsh
Wet MeadowDrop water table.
Pathway 1.4C
Community 1.4 to 1.5
Emergent Marsh
Inundated Shrub SwampTemporary drop water table; shrub establishment.
Pathway 1.5A
Community 1.5 to 1.2
Inundated Shrub Swamp
Wet MeadowDrop water table; shrub mortality.
Conservation practices
Brush Management Pathway 1.5C
Community 1.5 to 1.4
Inundated Shrub Swamp
Emergent MarshTemporary drought; shrub mortality.
State 2
Cultural State
Community 2.1
Sustainable Crop, Pasture, or PlantationCommunity 2.2
Unsustainable Cultural PhaseCommunity 2.3
Conservation FeatureCan be a grassed waterway, conservation reserve, a small patch pollinator garden, or other land taken out of its primary cultural production to mitigate or reduce impacts of adjacent land use, and is not by itself a permanent restoration of a complete native biological community and associated ecosystem services.
Pathway 2.1A
Community 2.1 to 2.2Revert to unsustainable cultural practices.
Pathway 2.1B
Community 2.1 to 2.3Establish conservation feature.
Conservation practices
Conservation Cover Grassed Waterway Pathway 2.2A
Community 2.2 to 2.1Implement sustainable cultural practices.
Conservation practices
Conservation Crop Rotation Cover Crop Nutrient Management Integrated Pest Management (IPM) Pathway 2.2B
Community 2.2 to 2.3Establish conservation feature.
Conservation practices
Conservation Cover Grassed Waterway Pathway 2.3A
Community 2.3 to 2.1Implement sustainable cultural practices.
Conservation practices
Conservation Crop Rotation Cover Crop Nutrient Management Integrated Pest Management (IPM) Pathway 2.3B
Community 2.3 to 2.2Revert to unsustainable cultural practices.
State 3
Seminatural Drained State
Community 3.1
Ruderal Drained Meadow & Shrub
Figure 14. Ruderal drained meadow and shrub.
Table 8. Canopy structure (% cover)
Height Above Ground (ft) Tree Shrub/Vine Grass/
GrasslikeForb <0.5 – – 0% 0% >0.5 <= 1 0% – 66-96% 23-72% >1 <= 2 0% – 66-96% 23-72% >2 <= 4.5 0-1% – – – >4.5 <= 13 0-1% – – – >13 <= 40 – – – – >40 <= 80 – – – – >80 <= 120 – – – – >120 – – – – Community 3.2
Exotic Ruderal Drained Forest
Figure 15. Exotic Ruderal Drained Forest
Table 9. Canopy structure (% cover)
Height Above Ground (ft) Tree Shrub/Vine Grass/
GrasslikeForb <0.5 – 0-3% – 0-6% >0.5 <= 1 0-1% 0-14% 4-42% 1-29% >1 <= 2 0-1% 0-5% 4-42% 1-20% >2 <= 4.5 – 0-8% – – >4.5 <= 13 0-17% 11-49% – – >13 <= 40 70-84% 11-22% – – >40 <= 80 60-75% – – – >80 <= 120 0-21% – – – >120 – – – – Pathway 3.1A
Community 3.1 to 3.2
Ruderal Drained Meadow & Shrub
Exotic Ruderal Drained ForestSuccession
Pathway 3.2A
Community 3.2 to 3.1
Exotic Ruderal Drained Forest
Ruderal Drained Meadow & ShrubBlowdown/clearcut.
Conservation practices
Early Successional Habitat Development/Management Forest Stand Improvement State 4
Seminatural State
Community 4.1
Ruderal Wet Meadow & Shrub Swamp
Figure 16. Representative reed canary grass wet meadow.
Table 10. Canopy structure (% cover)
Height Above Ground (ft) Tree Shrub/Vine Grass/
GrasslikeForb <0.5 – 0-1% – – >0.5 <= 1 0% 0-2% 2-91% 2-48% >1 <= 2 0% 0-1% 76-96% 11-64% >2 <= 4.5 – 0-1% 0-15% 0-5% >4.5 <= 13 0-4% 0-13% – – >13 <= 40 0-10% 0-1% – – >40 <= 80 – – – – >80 <= 120 – – – – >120 – – – – Community 4.2
Exotic Ruderal Swamp ForestTable 11. Canopy structure (% cover)
Height Above Ground (ft) Tree Shrub/Vine Grass/
GrasslikeForb <0.5 – 13-13% – 1-1% >0.5 <= 1 25-25% 34-34% – 60-60% >1 <= 2 25-25% 24-24% – 60-60% >2 <= 4.5 – 16-16% – – >4.5 <= 13 13-13% 20-20% – – >13 <= 40 96-96% 4-4% – – >40 <= 80 95-95% – – – >80 <= 120 – – – – >120 – – – – Pathway 4.1A
Community 4.1 to 4.2Succession.
Pathway 4.2A
Community 4.2 to 4.1Blowdown/clearcut.
Conservation practices
Early Successional Habitat Development/Management Forest Stand Improvement State 5
Native Drained State
Community 5.1
Native Drained Forest
Figure 17. Mesophytic hardwood forest, hydrologically equivalent to native drained forest.
Transition T1A
State 1 to 2
Reference State
Cultural StateDrain; clear vegetation; cultivate domesticated species.
Transition T1B
State 1 to 3
Reference State
Seminatural Drained StateDrain; clear vegetation, invasive species introduced.
Transition T1C
State 1 to 4
Reference State
Seminatural StateClear vegetation, invasive species introduced.
Transition T1D
State 1 to 5
Reference State
Native Drained StateDrain. Succession towards non-hydric shade tolerant species.
Restoration pathway R2
State 2 to 1
Cultural State
Reference StateRestore hydrology; remove domesticated species; restore native species.
Conservation practices
Brush Management Restoration and Management of Rare and Declining Habitats Wetland Wildlife Habitat Management Wetland Restoration Herbaceous Weed Control Transition T2A
State 2 to 3
Cultural State
Seminatural Drained StateAbandon, succession.
Transition T2B
State 2 to 4
Cultural State
Seminatural StateRestore hydrology; abandon; succession.
Conservation practices
Wetland Restoration Restoration pathway R3
State 3 to 1
Seminatural Drained State
Reference StateRestore hydrology; control invasive species; restore native species
Conservation practices
Brush Management Restoration and Management of Rare and Declining Habitats Wetland Wildlife Habitat Management Wetland Restoration Herbaceous Weed Control Transition T3A
State 3 to 2
Seminatural Drained State
Cultural StateClear vegetation; cultivate domesticated species.
Transition T3B
State 3 to 4
Seminatural Drained State
Seminatural StateRestore hydrology.
Conservation practices
Wetland Restoration Restoration pathway R4
State 4 to 1
Seminatural State
Reference StateControl invasive species; restore native species.
Conservation practices
Brush Management Restoration and Management of Rare and Declining Habitats Wetland Wildlife Habitat Management Herbaceous Weed Control Transition T4A
State 4 to 2
Seminatural State
Cultural StateDrain; clear vegetation; cultivate domesticated species.
Transition T4B
State 4 to 3
Seminatural State
Seminatural Drained StateDrain.
Restoration pathway R5
State 5 to 1
Native Drained State
Reference StateRestore hydrology. Differential mortality of non-hydric species. Succession towards hydric species.
Conservation practices
Wetland Restoration Additional community tables
Table 12. Community 1.1 plant community composition
Group Common name Symbol Scientific name Annual production () Foliar cover (%) Table 13. Community 1.1 forest overstory composition
Common name Symbol Scientific name Nativity Height ft Canopy cover (%) Diameter in Basal area (square ft/acre) Treesilver maple ACSA2 Acer saccharinum Native 42.3-94.5 57.4-68 9.4-20.9 0 American elm ULAM Ulmus americana Native 16.7-35.4 5.9-29.8 2.8-7.9 0 American basswood TIAM Tilia americana Native 38.7-80.1 0-16.7 – 0 bur oak QUMA2 Quercus macrocarpa Native 41-93.2 0-12.7 15-26.8 0 eastern cottonwood PODE3 Populus deltoides Native 58.7-92.2 0-8.8 18.5-28.7 0 shagbark hickory CAOV2 Carya ovata Native 11.2-22 0.4-5.6 – 0 American elm ULAM Ulmus americana Native 36.4-77.1 0-5.1 8.3 0 shellbark hickory CALA21 Carya laciniosa Native 19.7-39.4 0-5 – 0 shagbark hickory CAOV2 Carya ovata Native 58.4-92.5 0-4.6 – 0 American hornbeam CACA18 Carpinus caroliniana Native 14.4-29.2 0-3.8 – 0 chinquapin oak QUMU Quercus muehlenbergii Native 45.9-95.1 0-2.1 – 0 green ash FRPE Fraxinus pennsylvanica Native 40.4-84 0-1.9 – 0 sugar maple ACSA3 Acer saccharum Native 19.4-38.7 0-1.8 – 0 northern red oak QURU Quercus rubra Native 37.1-84 0-1.5 20.5 0 silver maple ACSA2 Acer saccharinum Native 24.6-49.2 0-1.1 – 0 American basswood TIAM Tilia americana Native 24.6-48.9 0-0.8 – 0 black maple ACNI5 Acer nigrum Native 24.6-49.2 0-0.6 – 0 green ash FRPE Fraxinus pennsylvanica Native 18.7-39 0-0.5 – 0 bur oak QUMA2 Quercus macrocarpa Native 24.6-49.2 0.4 – 0 bitternut hickory CACO15 Carya cordiformis Native 39.4-82 0-0.4 – 0 black cherry PRSE2 Prunus serotina Native 39.4-82 0-0.3 – 0 American beech FAGR Fagus grandifolia Native 39.4-82 0-0.3 – 0 American beech FAGR Fagus grandifolia Native 24.3-49.2 0-0.3 – 0 bitternut hickory CACO15 Carya cordiformis Native 24.6-49.2 0-0.2 – 0 pawpaw ASTR Asimina triloba Native 19.7-39.4 0-0.1 – 0 Shumard's oak QUSH Quercus shumardii Native 39.4-114.8 0-0.1 42.1 0 Vine/Lianaeastern poison ivy TORA2 Toxicodendron radicans Native 17.4-35.1 0.2-0.4 – 0 Table 14. Community 1.1 forest understory composition
Common name Symbol Scientific name Nativity Height (ft) Canopy cover (%) Grass/grass-like (Graminoids)Gray's sedge CAGR5 Carex grayi Native 0.7–1.6 0–7.4 whitegrass LEVI2 Leersia virginica Native 0.7–1.6 0–5.9 reed canarygrass PHAR3 Phalaris arundinacea Native 0.7–1.6 0–5.9 sweet woodreed CIAR2 Cinna arundinacea Native 1–2 0–5.3 fowl mannagrass GLST Glyceria striata Native 0.7–1.6 1–3 Virginia wildrye ELVI3 Elymus virginicus Native 0.7–1.6 0–2.1 sedge CAREX Carex Native 0.7–1.3 0–1.3 brome-like sedge CABR14 Carex bromoides Native 0.3–1 0–0.8 hop sedge CALU4 Carex lupulina Native 0.7–1.6 0.2–0.5 eastern bottlebrush grass ELHY Elymus hystrix Native 0.7–2 0.2–0.5 Bebb's sedge CABE2 Carex bebbii Native 0.7–1.6 0–0.2 greater bladder sedge CAIN12 Carex intumescens Native 0.7–1.6 0–0.2 bluegrass POA Poa Native 0.3–1 0–0.2 nodding fescue FESU3 Festuca subverticillata Native 1–2 0–0.1 grove bluegrass POAL3 Poa alsodes Native 1–2 0–0.1 Forb/Herbsmallspike false nettle BOCY Boehmeria cylindrica Native 0.3–1.3 0–9.5 Canadian woodnettle LACA3 Laportea canadensis Native 0.7–1.6 0–8.7 Canadian clearweed PIPU2 Pilea pumila Native 0.3–1 0–5.1 jumpseed POVI2 Polygonum virginianum Native 0.7–1.6 0–4.7 devil's beggartick BIFR Bidens frondosa Native 0.7–1.6 0–2.7 bottomland aster SYON2 Symphyotrichum ontarionis Native 0.7–1.6 0–1.5 Canadian honewort CRCA9 Cryptotaenia canadensis Native 0.7–1 0–1.4 spotted geranium GEMA Geranium maculatum Native 0.3–0.7 0–1.3 bristly buttercup RAHI Ranunculus hispidus Native 0.3–1 0–1 Canadian wildginger ASCA Asarum canadense Native 0–0.3 0–0.9 swamp smartweed POHY2 Polygonum hydropiperoides Native 0.7–1.6 0–0.8 jewelweed IMCA Impatiens capensis Native 0.3–1.3 0–0.8 largefruit blacksnakeroot SATR4 Sanicula trifoliata Native 0.3–1 0–0.8 Jack in the pulpit ARTR Arisaema triphyllum Native 0.3–1 0–0.7 white panicle aster SYLA6 Symphyotrichum lanceolatum Native 0.7–1.6 0–0.5 clustered blacksnakeroot SAOD Sanicula odorata Native 0.3–1 0–0.5 white avens GECA7 Geum canadense Native 0.7–1.6 0–0.5 threelobe beggarticks BITR Bidens tripartita Native 0.7–1.6 0.2–0.5 enchanter's nightshade CIIN4 Circaea ×intermedia Native 0.3–1 0–0.3 butterweed PAGL17 Packera glabella Native 0.3–1 0–0.2 feathery false lily of the valley MARA7 Maianthemum racemosum Native 0.3–0.7 0–0.2 violet VIOLA Viola Native 0–0.3 0–0.2 common blue violet VISO Viola sororia Native 0–0.3 0–0.2 blue skullcap SCLA2 Scutellaria lateriflora Native 0.7–1.6 0–0.1 twoleaf miterwort MIDI3 Mitella diphylla Native 0.3–0.7 0–0.1 phlox PHLOX Phlox Native 0.3–0.7 0–0.1 hairy Solomon's seal POPU4 Polygonatum pubescens Native 0.3–0.7 0–0.1 nodding wakerobin TRFL6 Trillium flexipes Native 0.3–0.7 0–0.1 Clayton's sweetroot OSCL Osmorhiza claytonii Native 0–0.3 0–0.1 eastern waterleaf HYVI Hydrophyllum virginianum Native 0.3–0.7 0–0.1 Fern/fern allyspinulose woodfern DRCA11 Dryopteris carthusiana Native 0.7–1.6 0–1.1 sensitive fern ONSE Onoclea sensibilis Native 0.7–1.3 0–0.4 cutleaf grapefern BODI2 Botrychium dissectum Native 0–0.3 0–0.1 Shrub/Subshrubnorthern spicebush LIBE3 Lindera benzoin Native 0.7–1.6 0–4.2 northern spicebush LIBE3 Lindera benzoin Native 1.6–3.3 0–3.4 common pricklyash ZAAM Zanthoxylum americanum Native 7.2–14.8 0–3.1 northern spicebush LIBE3 Lindera benzoin Native 6.6–12.8 0–2.3 black raspberry RUOC Rubus occidentalis Native 0.7–1.6 0–0.7 common buttonbush CEOC2 Cephalanthus occidentalis Native 8.2–16.4 0–0.6 black raspberry RUOC Rubus occidentalis Native 1.6–3 0.6 currant RIBES Ribes Native 0.7–1.3 0–0.4 common winterberry ILVE Ilex verticillata Native 8.2–16.4 0–0.2 black elderberry SANI4 Sambucus nigra Native 0.7–1.6 0–0.2 common winterberry ILVE Ilex verticillata Native 3.3–6.6 0.1 eastern prickly gooseberry RICY Ribes cynosbati Native 0.7–1.6 0–0.1 Treegreen ash FRPE Fraxinus pennsylvanica Native 8.2–16.4 0–5 black ash FRNI Fraxinus nigra Native 6.6–13.1 0–2.2 shellbark hickory CALA21 Carya laciniosa Native 8.2–16.4 0–1.7 American beech FAGR Fagus grandifolia Native 8.2–16.4 0–1.4 green ash FRPE Fraxinus pennsylvanica Native 0.7–1.6 0–1.2 American hornbeam CACA18 Carpinus caroliniana Native 8.2–16.4 0–0.7 silver maple ACSA2 Acer saccharinum Native 0.7–1.6 0–0.7 American elm ULAM Ulmus americana Native 8.2–16.4 0–0.4 shagbark hickory CAOV2 Carya ovata Native 8.2–16.4 0–0.4 common hackberry CEOC Celtis occidentalis Native 8.2–16.4 0–0.4 bitternut hickory CACO15 Carya cordiformis Native 8.2–16.4 0–0.3 green ash FRPE Fraxinus pennsylvanica Native 1.6–3.3 0–0.3 American elm ULAM Ulmus americana Native 0.7–1.6 0–0.1 bur oak QUMA2 Quercus macrocarpa Native 0.7–1.6 0–0.1 pawpaw ASTR Asimina triloba Native 0.7–1.6 0–0.1 Vine/LianaVirginia creeper PAQU2 Parthenocissus quinquefolia Native 0.3–0.7 0–11.8 eastern poison ivy TORA2 Toxicodendron radicans Native 0.3–0.7 0–9.6 American hogpeanut AMBR2 Amphicarpaea bracteata Native 0.7–1.6 0–5.1 riverbank grape VIRI Vitis riparia Native 8.2–16.4 0–1.8 riverbank grape VIRI Vitis riparia Native 0.7–1.6 0–1 eastern poison ivy TORA2 Toxicodendron radicans Native 8.2–16.4 0.1–0.8 common moonseed MECA3 Menispermum canadense Native 0.7–1.6 0–0.2 stickywilly GAAP2 Galium aparine Native 0.3–0.7 0–0.2 eastern poison ivy TORA2 Toxicodendron radicans Native 1.6–3.3 0–0.1 Virginia creeper PAQU2 Parthenocissus quinquefolia Native 3.3–6.2 0–0.1 Biological CrustsAlga 2ALGA Alga Native – 0–0.1 NonvascularMoss 2MOSS Moss Native – 0–0.1 Table 15. Community 1.2 plant community composition
Group Common name Symbol Scientific name Annual production () Foliar cover (%) Table 16. Community 1.2 forest overstory composition
Common name Symbol Scientific name Nativity Height ft Canopy cover (%) Diameter in Basal area (square ft/acre) Treeeastern cottonwood PODE3 Populus deltoides Native 39.4-82 18.9 – 0 Vine/Lianariverbank grape VIRI Vitis riparia Native 24.6-49.2 0.2 – 0 Table 17. Community 1.2 forest understory composition
Common name Symbol Scientific name Nativity Height (ft) Canopy cover (%) Grass/grass-like (Graminoids)rice cutgrass LEOR Leersia oryzoides Native 0.7–1.6 0–10.6 sweet woodreed CIAR2 Cinna arundinacea Native 0.7–1.6 0–5.6 fowl mannagrass GLST Glyceria striata Native 0.7–1.6 5–5.1 hairy sedge CALA16 Carex lacustris Native 0.7–1.6 4.7 reed canarygrass PHAR3 Phalaris arundinacea Native 0.7–1.6 0–1.6 sedge CAREX Carex Native 0.7–1.6 0–0.3 hop sedge CALU4 Carex lupulina Native 0.7–1.6 0–0.3 Forb/Herbjewelweed IMCA Impatiens capensis Native 0.7–1.6 0–3 bottomland aster SYON2 Symphyotrichum ontarionis Native 0.7–1.6 0–3 devil's beggartick BIFR Bidens frondosa Native 0.7–1.6 0–1.6 smallspike false nettle BOCY Boehmeria cylindrica Native 0.7–1.6 0–0.7 purpleleaf willowherb EPCO Epilobium coloratum Native 0.7–1.6 0–0.7 giant goldenrod SOGI Solidago gigantea Native 0.7–1.6 0–0.7 ditch stonecrop PESE6 Penthorum sedoides Native 0.7–1.6 0–0.3 white vervain VEUR Verbena urticifolia Native 0.7–1.6 0–0.3 jumpseed POVI2 Polygonum virginianum Native 0.7–1.6 0.2 white avens GECA7 Geum canadense Native 0.7–1.6 0.2 Shrub/Subshrubcommon pricklyash ZAAM Zanthoxylum americanum Native 8.2–16.4 4.7 Treegreen ash FRPE Fraxinus pennsylvanica Native 8.2–16.4 60.3 Vine/Lianariverbank grape VIRI Vitis riparia Native 0.7–1.6 0.9 eastern poison ivy TORA2 Toxicodendron radicans Native 0.7–1.6 0.2 Table 18. Community 1.3 plant community composition
Group Common name Symbol Scientific name Annual production () Foliar cover (%) Table 19. Community 1.4 plant community composition
Group Common name Symbol Scientific name Annual production () Foliar cover (%) Table 20. Community 1.5 plant community composition
Group Common name Symbol Scientific name Annual production () Foliar cover (%) Table 21. Community 1.5 forest understory composition
Common name Symbol Scientific name Nativity Height (ft) Canopy cover (%) Grass/grass-like (Graminoids)fowl mannagrass GLST Glyceria striata Native 0.7–1.6 1 whitegrass LEVI2 Leersia virginica Native 0.7–1.6 1 Forb/HerbCanadian clearweed PIPU2 Pilea pumila Native 0.3–1 5 Shrub/Subshrubcommon buttonbush CEOC2 Cephalanthus occidentalis Native 8.2–16.4 95 Table 22. Community 2.1 plant community composition
Group Common name Symbol Scientific name Annual production () Foliar cover (%) Table 23. Community 2.2 plant community composition
Group Common name Symbol Scientific name Annual production () Foliar cover (%) Table 24. Community 2.3 plant community composition
Group Common name Symbol Scientific name Annual production () Foliar cover (%) Table 25. Community 3.1 plant community composition
Group Common name Symbol Scientific name Annual production () Foliar cover (%) Table 26. Community 3.1 forest understory composition
Common name Symbol Scientific name Nativity Height (ft) Canopy cover (%) Grass/grass-like (Graminoids)fowl bluegrass POPA2 Poa palustris Native 0.7–1.6 83 timothy PHPR3 Phleum pratense Introduced 0.7–1.6 18.3–60.5 quackgrass ELRE4 Elymus repens Introduced 0.7–1.6 19.1 smooth brome BRIN2 Bromus inermis Introduced 0.7–1.6 3.6 Forb/HerbIndianhemp APCA Apocynum cannabinum Native 0.7–1.6 36.1 Canada goldenrod SOAL6 Solidago altissima Native 0.7–1.6 36.1 Queen Anne's lace DACA6 Daucus carota Introduced 0.7–1.6 19.1 Fuller's teasel DIFU2 Dipsacus fullonum Introduced 0.7–1.6 1.8 hairy white oldfield aster SYPI2 Symphyotrichum pilosum Native 0.7–1.6 1.8 annual ragweed AMAR2 Ambrosia artemisiifolia Native 0.7–1.6 0–0.7 lesser burdock ARMI2 Arctium minus Introduced 0.7–1.6 0–0.1 Treegreen ash FRPE Fraxinus pennsylvanica Native 8.2–16.4 3.6 Table 27. Community 3.2 plant community composition
Group Common name Symbol Scientific name Annual production () Foliar cover (%) Table 28. Community 3.2 forest overstory composition
Common name Symbol Scientific name Nativity Height ft Canopy cover (%) Diameter in Basal area (square ft/acre) Treegreen ash FRPE Fraxinus pennsylvanica Native 24.6-49.2 1.6-40.3 – 0 silver maple ACSA2 Acer saccharinum Native 39-80.7 36.5-37.9 7.1-21.3 0 bur oak QUMA2 Quercus macrocarpa Native 39.4-82 23.6 15.4-22.8 0 pin oak QUPA2 Quercus palustris Native 39.4-82 12.1 14.2 0 shellbark hickory CALA21 Carya laciniosa Native 24.6-49.2 12.1 3.1 0 American elm ULAM Ulmus americana Native 24.6-49.2 8.6 – 0 American basswood TIAM Tilia americana Native 39.4-82 6.3 16.5 0 American basswood TIAM Tilia americana Native 24.6-49.2 6.3 – 0 eastern cottonwood PODE3 Populus deltoides Native 24.6-49.2 0.1-4.4 – 0 bitternut hickory CACO15 Carya cordiformis Native 39.4-82 2.3 – 0 Vine/Lianaeastern poison ivy TORA2 Toxicodendron radicans Native 16.4-32.8 0.2 – 0 Table 29. Community 3.2 forest understory composition
Common name Symbol Scientific name Nativity Height (ft) Canopy cover (%) Grass/grass-like (Graminoids)graceful sedge CAGR2 Carex gracillima Native 0.7–1.6 0.4–11.1 rough bluegrass POTR2 Poa trivialis Introduced 0.7–1.6 0.4–11.1 eastern woodland sedge CABL Carex blanda Native 0.7–1.6 0.6 Forb/Herbavens GEUM Geum Native 0.7–1.6 0.1–4.4 Canada goldenrod SOAL6 Solidago altissima Native 0.7–1.6 0.1–4.4 jumpseed POVI2 Polygonum virginianum Native 0.7–1.6 0.4–2.3 agrimony AGRIM Agrimonia Native 0.7–1.6 0.1–2.2 Philadelphia fleabane ERPH Erigeron philadelphicus Native 0.7–1.6 0.1–2.2 white panicle aster SYLA6 Symphyotrichum lanceolatum Native 0.7–1.6 0.1–2.2 Virginia strawberry FRVI Fragaria virginiana Native 0.3–0.7 0.1–2.2 white avens GECA7 Geum canadense Native 0.7–1.6 0.2 spotted geranium GEMA Geranium maculatum Native 0.3–1 0.2 Fern/fern allysensitive fern ONSE Onoclea sensibilis Native 0.7–1.3 0.1–4.4 Shrub/Subshrubcommon buckthorn RHCA3 Rhamnus cathartica Introduced 8.2–16.4 22.4 multiflora rose ROMU Rosa multiflora Introduced 4.6–9.5 1–21.6 silky dogwood COOB9 Cornus obliqua Native 5.9–11.5 0.4–11.1 northern spicebush LIBE3 Lindera benzoin Native 6.6–13.1 7.5 common pricklyash ZAAM Zanthoxylum americanum Native 8.2–16.4 1.7 gray dogwood CORA6 Cornus racemosa Native 4.9–9.8 0.2 currant RIBES Ribes Native 3.6–7.5 0.2 Treegreen ash FRPE Fraxinus pennsylvanica Native 8.2–16.4 1.7–41.6 American hornbeam CACA18 Carpinus caroliniana Native 8.2–16.4 1.7 northern red oak QURU Quercus rubra Native 8.2–16.4 0.6 common hackberry CEOC Celtis occidentalis Native 0.7–1.6 0.2 green ash FRPE Fraxinus pennsylvanica Native 0.7–1.6 0.2 bitternut hickory CACO15 Carya cordiformis Native 8.2–16.4 0.2 bitternut hickory CACO15 Carya cordiformis Native 0.7–1.6 0.2 Vine/Lianaeastern poison ivy TORA2 Toxicodendron radicans Native 0.7–1.6 1.3–11.3 riverbank grape VIRI Vitis riparia Native 8.2–16.4 0.4–11.1 Virginia creeper PAQU2 Parthenocissus quinquefolia Native 0.3–1 7.5 common moonseed MECA3 Menispermum canadense Native 8.2–16.4 0.6 limber honeysuckle LODI2 Lonicera dioica Native 8.2–16.4 0.2 riverbank grape VIRI Vitis riparia Native 0.7–1.6 0.2 Table 30. Community 4.1 plant community composition
Group Common name Symbol Scientific name Annual production () Foliar cover (%) Table 31. Community 4.1 forest overstory composition
Common name Symbol Scientific name Nativity Height ft Canopy cover (%) Diameter in Basal area (square ft/acre) Treenorthern red oak QURU Quercus rubra Native 39.4-82 0-2.8 – 0 tuliptree LITU Liriodendron tulipifera Native 39.4-82 0-0.8 – 0 shagbark hickory CAOV2 Carya ovata Native 24.6-49.2 0-0.8 – 0 American elm ULAM Ulmus americana Native 24.6-49.2 0-0.8 – 0 American hornbeam CACA18 Carpinus caroliniana Native 24.6-49.2 0-0.2 – 0 green ash FRPE Fraxinus pennsylvanica Native 19.7-39.4 0-0.1 – 0 Table 32. Community 4.1 forest understory composition
Common name Symbol Scientific name Nativity Height (ft) Canopy cover (%) Grass/grass-like (Graminoids)reed canarygrass PHAR3 Phalaris arundinacea Native 1.6–3.3 55.3–60.3 redtop AGGI2 Agrostis gigantea Introduced 0.7–1.6 0–15.9 fox sedge CAVU2 Carex vulpinoidea Native 0.7–1.6 0–15.1 Kentucky bluegrass POPR Poa pratensis Native 0.7–1.6 0–14.6 tall fescue SCAR7 Schedonorus arundinaceus Introduced 0.7–1.6 0–11.2 hop sedge CALU4 Carex lupulina Native 0.7–1.6 0–8.2 whitegrass LEVI2 Leersia virginica Native 0.7–1.6 0–8.1 fowl mannagrass GLST Glyceria striata Native 0.7–1.6 0–4.5 timothy PHPR3 Phleum pratense Introduced 0.7–1.6 0–3.1 fowl bluegrass POPA2 Poa palustris Native 0.7–1.6 0–3.1 Crawford's sedge CACR4 Carex crawfordii Native 0.7–1.6 0–1.7 squarrose sedge CASQ2 Carex squarrosa Native 0.7–1.6 0–1.7 sweet woodreed CIAR2 Cinna arundinacea Native 0.7–1.6 0–1.7 green bulrush SCAT2 Scirpus atrovirens Native 2.3–4.6 0–1 crested sedge CACR7 Carex cristatella Native 0.7–2 0–0.6 smooth brome BRIN2 Bromus inermis Introduced 0.7–1.6 0–0.6 awlfruit sedge CAST5 Carex stipata Native 0.7–1.6 0–0.6 fall panicgrass PADI Panicum dichotomiflorum Native 0.7–1.6 0–0.6 Virginia wildrye ELVI3 Elymus virginicus Native 1.3–2.3 0–0.4 sedge CAREX Carex Native 0.7–1.6 0–0.3 Greene's rush JUGR Juncus greenei Native 0.7–1.6 0–0.3 knotsheath sedge CARE4 Carex retrorsa Native 1.6–3.3 0–0.1 rush JUNCU Juncus Native 1–2 0–0.1 Gray's sedge CAGR5 Carex grayi Native 0.7–1.6 0–0.1 Canada bluegrass POCO Poa compressa Introduced 0.7–1.6 0–0.1 rufous bulrush SCPE4 Scirpus pendulus Native 0.7–1.6 0–0.1 narrowleaf cattail TYAN Typha angustifolia Introduced 0.7–1.6 0–0.1 barnyardgrass ECCR Echinochloa crus-galli Introduced 0.7–1.6 0–0.1 Forb/Herbgiant goldenrod SOGI Solidago gigantea Native 1.6–3.6 0–33.4 Canada goldenrod SOCA6 Solidago canadensis Native 1.6–3.3 0–12.6 jewelweed IMCA Impatiens capensis Native 0.7–1.6 0–11.1 Canada goldenrod SOAL6 Solidago altissima Native 0.7–1.6 0–8.1 Indianhemp APCA Apocynum cannabinum Native 0.7–1.6 0–5.9 white panicle aster SYLA6 Symphyotrichum lanceolatum Native 1.3–2.6 0–5 Queen Anne's lace DACA6 Daucus carota Introduced 1.6–3.3 0–4.2 Canada thistle CIAR4 Cirsium arvense Introduced 1.3–3 0–3.4 common boneset EUPE3 Eupatorium perfoliatum Native 0.7–1.6 0–3.4 great ragweed AMTR Ambrosia trifida Native 1.6–3.3 0–2.2 bottomland aster SYON2 Symphyotrichum ontarionis Native 1.3–2.6 0–1.7 big devils beggartick BIVU Bidens vulgata Native 0.7–1.6 0–1.7 purpleleaf willowherb EPCO Epilobium coloratum Native 0.7–1.6 0–1.7 Canadian clearweed PIPU2 Pilea pumila Native 0.3–1 0–1.7 stinging nettle URDI Urtica dioica Native 3.3–6.6 0–1.4 jumpseed POVI2 Polygonum virginianum Native 0.7–1.6 0.1–0.7 giant sunflower HEGI Helianthus giganteus Native 1.6–3.3 0–0.6 purplestem aster SYPU Symphyotrichum puniceum Native 0.7–1.6 0–0.6 red clover TRPR2 Trifolium pratense Introduced 0.7–1.6 0–0.6 flat-top goldentop EUGR5 Euthamia graminifolia Native 1–2.3 0–0.4 bull thistle CIVU Cirsium vulgare Introduced 2–3.9 0–0.3 harvestlice AGPA6 Agrimonia parviflora Native 0.7–1.6 0–0.3 smallspike false nettle BOCY Boehmeria cylindrica Native 0.7–1.6 0–0.3 white avens GECA7 Geum canadense Native 0.7–1.6 0–0.3 cardinalflower LOCA2 Lobelia cardinalis Native 0.7–1.6 0–0.3 Indian-tobacco LOIN Lobelia inflata Native 0.7–1.6 0–0.3 ditch stonecrop PESE6 Penthorum sedoides Native 0.7–1.6 0–0.3 American pokeweed PHAM4 Phytolacca americana Native 0.7–1.6 0–0.3 blue skullcap SCLA2 Scutellaria lateriflora Native 0.7–1.6 0–0.3 calico aster SYLA4 Symphyotrichum lateriflorum Native 0.7–1.6 0–0.3 Virginia strawberry FRVI Fragaria virginiana Native 0.3–1 0–0.3 violet VIOLA Viola Native 0.3–0.7 0–0.3 purple loosestrife LYSA2 Lythrum salicaria Introduced 1.6–3.3 0–0.1 spotted ladysthumb POPE3 Polygonum persicaria Introduced 1.6–3.3 0–0.1 longleaf groundcherry PHLO4 Physalis longifolia Native 1.3–2.6 0–0.1 swamp milkweed ASIN Asclepias incarnata Native 0.7–1.6 0–0.1 common milkweed ASSY Asclepias syriaca Native 0.7–1.6 0–0.1 Fuller's teasel DIFU2 Dipsacus fullonum Introduced 0.7–1.6 0–0.1 Philadelphia fleabane ERPH Erigeron philadelphicus Native 0.7–1.6 0–0.1 spotted joe pye weed EUMA9 Eutrochium maculatum Native 0.7–1.6 0–0.1 avens GEUM Geum Native 0.7–1.6 0–0.1 dames rocket HEMA3 Hesperis matronalis Introduced 0.7–1.6 0–0.1 spotted St. Johnswort HYPU Hypericum punctatum Native 0.7–1.6 0–0.1 Shrub/Subshrubsandbar willow SAIN3 Salix interior Native 8.2–16.4 0–26.6 gray dogwood CORA6 Cornus racemosa Native 4.9–9.8 0–5.9 multiflora rose ROMU Rosa multiflora Introduced 4.6–9.5 0–3.4 Missouri River willow SAER Salix eriocephala Native 8.2–16.4 0–1.1 black raspberry RUOC Rubus occidentalis Native 1.6–3.3 0–0.8 red elderberry SARA2 Sambucus racemosa Native 8.2–16.4 0–0.3 multiflora rose ROMU Rosa multiflora Introduced 0.7–1.6 0–0.3 black raspberry RUOC Rubus occidentalis Native 0.7–1.6 0–0.2 Treegreen ash FRPE Fraxinus pennsylvanica Native 8.2–16.4 0–6.2 black maple ACNI5 Acer nigrum Native 8.2–16.4 0–1.7 black ash FRNI Fraxinus nigra Native 8.2–16.4 0–1.7 bur oak QUMA2 Quercus macrocarpa Native 3.3–6.6 0–0.8 peachleaf willow SAAM2 Salix amygdaloides Native 3.3–6.6 0–0.6 sugar maple ACSA3 Acer saccharum Native 8.2–16.4 0–0.3 black cherry PRSE2 Prunus serotina Native 0.7–1.6 0–0.3 green ash FRPE Fraxinus pennsylvanica Native 2.6–4.9 0–0.3 northern red oak QURU Quercus rubra Native 0.7–1.6 0–0.3 tuliptree LITU Liriodendron tulipifera Native 8.2–16.4 0–0.3 tuliptree LITU Liriodendron tulipifera Native 0.7–1.6 0–0.3 green ash FRPE Fraxinus pennsylvanica Native 0.7–1.6 0–0.1 eastern cottonwood PODE3 Populus deltoides Native 1.6–3.3 0–0.1 staghorn sumac RHTY Rhus typhina Native 0.7–1.6 0–0.1 Vine/LianaVirginia creeper PAQU2 Parthenocissus quinquefolia Native 0.3–1 0–2.2 eastern poison ivy TORA2 Toxicodendron radicans Native 0.7–1.3 0–0.7 riverbank grape VIRI Vitis riparia Native 8.2–16.4 0–0.1 Table 33. Community 4.2 plant community composition
Group Common name Symbol Scientific name Annual production () Foliar cover (%) Table 34. Community 4.2 forest overstory composition
Common name Symbol Scientific name Nativity Height ft Canopy cover (%) Diameter in Basal area (square ft/acre) Treesugar maple ACSA3 Acer saccharum Native 32.8-65.6 95 – 0 sugar maple ACSA3 Acer saccharum Native 19.7-39.4 10 – 0 Vine/Lianaeastern poison ivy TORA2 Toxicodendron radicans Native 16.4-32.8 0.2 – 0 Virginia creeper PAQU2 Parthenocissus quinquefolia Native 9.5-18 0.2 – 0 Table 35. Community 4.2 forest understory composition
Common name Symbol Scientific name Nativity Height (ft) Canopy cover (%) Forb/Herbwhite avens GECA7 Geum canadense Native 0.7–1.6 38 jumpseed POVI2 Polygonum virginianum Native 0.7–1.6 25 giant goldenrod SOGI Solidago gigantea Native 0.7–1.6 13 white panicle aster SYLA6 Symphyotrichum lanceolatum Native 0.7–1.6 0.5 Virginia strawberry FRVI Fragaria virginiana Native 0.3–0.7 0.5 Shrub/Subshrubmultiflora rose ROMU Rosa multiflora Introduced 4.6–9.5 16 multiflora rose ROMU Rosa multiflora Introduced 0.7–1.6 13 common pricklyash ZAAM Zanthoxylum americanum Native 8.2–16.4 4 Morrow's honeysuckle LOMO2 Lonicera morrowii Introduced 4.9–9.8 0.8 Treegreen ash FRPE Fraxinus pennsylvanica Native 0.7–1.6 25 green ash FRPE Fraxinus pennsylvanica Native 8.2–16.4 8 American elm ULAM Ulmus americana Native 8.2–16.4 4 hawthorn CRATA Crataegus Native 8.2–16.4 0.8 bur oak QUMA2 Quercus macrocarpa Native 8.2–16.4 0.2 Vine/Lianaeastern poison ivy TORA2 Toxicodendron radicans Native 0.7–1.6 13 Virginia creeper PAQU2 Parthenocissus quinquefolia Native 0.3–1 13 NonvascularMoss 2MOSS Moss Native – 40 climacium moss CLIMA2 Climacium Native – 0.2 Table 36. Community 5.1 plant community composition
Group Common name Symbol Scientific name Annual production () Foliar cover (%) Table 37. Community 5.1 forest overstory composition
Common name Symbol Scientific name Nativity Height ft Canopy cover (%) Diameter in Basal area (square ft/acre) Treebur oak QUMA2 Quercus macrocarpa Native 39.7-82 2.7-52.7 21.7-22.4 0 American basswood TIAM Tilia americana Native 36.1-72.5 1.2-51.2 10.6-26 0 sugar maple ACSA3 Acer saccharum Native 22.6-45.3 0-34.4 – 0 shagbark hickory CAOV2 Carya ovata Native 39-81.7 0.1-30.2 16.5-22 0 red maple ACRU Acer rubrum Native 38.1-77.8 0-29.1 13-13.8 0 black cherry PRSE2 Prunus serotina Native 39.4-82 0-27.1 – 0 northern red oak QURU Quercus rubra Native 39.7-82.3 2.8-26.8 12.6-20.5 0 swamp white oak QUBI Quercus bicolor Native 39.4-82 0-20.4 – 0 black cherry PRSE2 Prunus serotina Native 24.6-49.2 0-20.4 – 0 silver maple ACSA2 Acer saccharinum Native 39.4-82 0-13.8 23.6 0 slippery elm ULRU Ulmus rubra Native 19.7-39.4 0-13.8 – 0 American elm ULAM Ulmus americana Native 20.3-41 3.7-12.7 5.5 0 bitternut hickory CACO15 Carya cordiformis Native 36.7-73.2 5.4-9 13.4 0 red maple ACRU Acer rubrum Native 24.6-49.2 0-7.3 – 0 sugar maple ACSA3 Acer saccharum Native 39.4-81.7 0-5.8 7.1 0 black maple ACNI5 Acer nigrum Native 24.6-49.2 0-4.9 – 0 American elm ULAM Ulmus americana Native 38.7-80.7 0-4.2 – 0 American hornbeam CACA18 Carpinus caroliniana Native 24.6-49.2 0-3.8 – 0 American sycamore PLOC Platanus occidentalis Native 39.4-82 0-3.8 – 0 pin oak QUPA2 Quercus palustris Native 39.4-82 0-3.5 – 0 green ash FRPE Fraxinus pennsylvanica Native 49.2-98.4 0-0.2 32.7 0 Vine/LianaVirginia creeper PAQU2 Parthenocissus quinquefolia Native 26.2-52.5 0-0.1 – 0 Table 38. Community 5.1 forest understory composition
Common name Symbol Scientific name Nativity Height (ft) Canopy cover (%) Grass/grass-like (Graminoids)eastern star sedge CARA8 Carex radiata Native 0–0.3 0–5.2 pubescent sedge CAHI5 Carex hirtifolia Native 0.3–0.7 0–0.7 fowl mannagrass GLST Glyceria striata Native 0.7–1.6 0–0.4 graceful sedge CAGR2 Carex gracillima Native 0.7–1.3 0–0.1 sedge CAREX Carex Native 0.7–1.6 0–0.1 Bebb's sedge CABE2 Carex bebbii Native 0.7–1.6 0–0.1 hop sedge CALU4 Carex lupulina Native 0.7–1.6 0–0.1 Forb/Herbenchanter's nightshade CIIN4 Circaea ×intermedia Native 0.3–0.7 2.4–12.4 Jack in the pulpit ARTR Arisaema triphyllum Native 0.3–0.7 0–2.7 jumpseed POVI2 Polygonum virginianum Native 0.7–1.6 0–0.9 mayapple POPE Podophyllum peltatum Native 0.3–1 0–0.6 spotted geranium GEMA Geranium maculatum Native 0.3–0.7 0–0.6 eastern waterleaf HYVI Hydrophyllum virginianum Native 0.3–0.7 0–0.5 green dragon ARDR3 Arisaema dracontium Native 0.3–0.7 0–0.5 white avens GECA7 Geum canadense Native 0.7–1.6 0–0.3 beggarslice HAVI2 Hackelia virginiana Native 0.7–1.6 0–0.1 feathery false lily of the valley MARA7 Maianthemum racemosum Native 0.3–0.7 0–0.1 Fern/fern allyspinulose woodfern DRCA11 Dryopteris carthusiana Native 0.7–1.6 0–0.2 Shrub/Subshrubnorthern spicebush LIBE3 Lindera benzoin Native 8.2–16.4 0–26.6 common pricklyash ZAAM Zanthoxylum americanum Native 3.3–6.6 0–5.2 multiflora rose ROMU Rosa multiflora Introduced 4.3–8.9 0–2.3 Amur honeysuckle LOMA6 Lonicera maackii Introduced 8.2–16.4 0–2.1 dogwood CORNU Cornus Native 0.3–0.7 0–0.5 glossy buckthorn FRAL4 Frangula alnus Introduced 8.2–16.4 0–0.1 northern spicebush LIBE3 Lindera benzoin Native 0.7–1.6 0–0.1 Treegreen ash FRPE Fraxinus pennsylvanica Native 8.2–16.4 0.9–13 bitternut hickory CACO15 Carya cordiformis Native 8.2–16.4 0–2.6 American hornbeam CACA18 Carpinus caroliniana Native 8.2–16.4 0–0.6 bitternut hickory CACO15 Carya cordiformis Native 0.7–1.6 0–0.5 northern red oak QURU Quercus rubra Native 0.7–1.6 0–0.5 sugar maple ACSA3 Acer saccharum Native 8.2–16.4 0–0.3 green ash FRPE Fraxinus pennsylvanica Native 0.7–1.6 0–0.3 northern catalpa CASP8 Catalpa speciosa Native 8.2–16.4 0–0.1 alternateleaf dogwood COAL2 Cornus alternifolia Native 0.7–1.6 0–0.1 shagbark hickory CAOV2 Carya ovata Native 0.7–1.6 0–0.1 American elm ULAM Ulmus americana Native 0.7–1.6 0–0.1 Vine/LianaVirginia creeper PAQU2 Parthenocissus quinquefolia Native 0.3–1 0.3–58.3 eastern poison ivy TORA2 Toxicodendron radicans Native 0.7–1.6 2.4–12.4 eastern poison ivy TORA2 Toxicodendron radicans Native 8.2–16.4 0–0.6 Virginia creeper PAQU2 Parthenocissus quinquefolia Native 1.6–3 0–0.6 wild yam DIVI4 Dioscorea villosa Native 1.6–3.3 0–0.5 running strawberry bush EUOB8 Euonymus obovatus Native 0.7–1.6 0–0.4 Interpretations
Supporting information
Inventory data references
In the years 2011-2023, 74 vegetation observations were made on hydric loamy sites within MLRAs 97, 98, and 99 for various purposes such as wetland reconsiderations. Due to its greater level of disturbance only 4 observations were made in MLRA 99. However, these three MLRAs generally overlap in flora for the dominant species, and are expected to respond similarly in community composition to soil and disturbance regimes. Therefore, the data from these MLRAs were pooled to retain adequate samples of each community type. Where available, the data were weighted to emphasize MLRA 99 composition and deemphasize more remote MLRA 97 and northern MLRA 98 plots. The distribution of plots by community type is as follows: 1.1 Swamp Forest, 41; 1.2 Wet Meadow, 2; 1.5 Inundated Shrub Swamp, 1; 3.1 Exotic Drained Meadow & Shrub, 4; 3.2 Exotic Drained Forest 4; 4.1 Exotic Wet Meadow & Shrub, 9; 4.2 Exotic Swamp Forest, 1; 5.1 Native Drained Forest, 12.
Other references
References consulted for MLRA 99 PES:
Albert, D. A. et al., 1995. Vegetation circa 1800 of Michigan. Michigan's native landscape as interpreted from the General Land Office Surveys 1816-1856 (digital map), Lansing: Michigan Natural Features Inventory.
Barnes, B. V. and Wagner, W. H., 2004. Michigan trees: a guide to the trees of the Great Lakes region. Ann Arbor (Michigan): University of Michigan Press.
Brewer, L.G. and Vankat, J.L., 2004. Description of Vegetation of the Oak Openings of Northwestern Ohio at the Time of Euro-American Settlement1. The Ohio Journal of Science, 104(4):76-85.
Forsyth, J.L., 1970. A geologist looks at the natural vegetation map of Ohio. Ohio Journal of Science 70(3): 180-190.
GHCN, 2016. Global Historical Climatology Network Monthly Versions 2 and 3 (temperature and precipitation data). NOAA. https://www.ncdc.noaa.gov/ghcnm/
Knopp, P.D., 2012. The Distribution of Quercus rubra in the Maumee Lake Plain of Southeastern Michigan. The American Midland Naturalist, 168(1):70-92.
Kost, M. A. et al., 2010. Natural Communities of Michigan: Classification and Description, Lansing, MI: Michigan Natural Features Inventory.
Niinemets, Ü. and Valladares, F., 2006. Tolerance to shade, drought, and waterlogging of temperate northern hemisphere trees and shrubs. Ecological monographs, 76(4), pp.521-547.
Landfire, 2017. Landfire Biophysical Settings Review Site. Accessed May, 2017 http://www.landfirereview.org/descriptions.html.
PRISM Climate Group. 2013. Gridded 30 Year Normals, 1981-2010. Oregon State University, http://prism.oregonstate.edu
Shanks, R.E., 1953. Forest Composition and Species Association in the Beech-Maple Forest Region of Western Ohio. Ecology, 34(3), pp.455-466.
USDA-NRCS, 2022. Land resource regions and major land resource areas of the United States, the Caribbean, and the Pacific Basin. U.S. Department of Agriculture, Agriculture Handbook 296.
USDA, 2009. Plant Hardiness Zone Map, Agricultural Research Service, U.S. Department of Agriculture.
U.S. Department of the Interior, Geological Survey, 2011. LANDFIRE: LANDFIRE 1.1.0 Existing Vegetation Type layer. http://landfire.cr.usgs.gov/viewer/Contributors
Greg J. Schmidt
Approval
Nels Barrett, 6/04/2024
Rangeland health reference sheet
Interpreting Indicators of Rangeland Health is a qualitative assessment protocol used to determine ecosystem condition based on benchmark characteristics described in the Reference Sheet. A suite of 17 (or more) indicators are typically considered in an assessment. The ecological site(s) representative of an assessment location must be known prior to applying the protocol and must be verified based on soils and climate. Current plant community cannot be used to identify the ecological site.
Author(s)/participant(s) Contact for lead author Date 01/25/2024 Approved by Approval date Composition (Indicators 10 and 12) based on Annual Production Indicators
-
Number and extent of rills:
-
Presence of water flow patterns:
-
Number and height of erosional pedestals or terracettes:
-
Bare ground from Ecological Site Description or other studies (rock, litter, lichen, moss, plant canopy are not bare ground):
-
Number of gullies and erosion associated with gullies:
-
Extent of wind scoured, blowouts and/or depositional areas:
-
Amount of litter movement (describe size and distance expected to travel):
-
Soil surface (top few mm) resistance to erosion (stability values are averages - most sites will show a range of values):
-
Soil surface structure and SOM content (include type of structure and A-horizon color and thickness):
-
Effect of community phase composition (relative proportion of different functional groups) and spatial distribution on infiltration and runoff:
-
Presence and thickness of compaction layer (usually none; describe soil profile features which may be mistaken for compaction on this site):
-
Functional/Structural Groups (list in order of descending dominance by above-ground annual-production or live foliar cover using symbols: >>, >, = to indicate much greater than, greater than, and equal to):
Dominant:
Sub-dominant:
Other:
Additional:
-
Amount of plant mortality and decadence (include which functional groups are expected to show mortality or decadence):
-
Average percent litter cover (%) and depth ( in):
-
Expected annual annual-production (this is TOTAL above-ground annual-production, not just forage annual-production):
-
Potential invasive (including noxious) species (native and non-native). List species which BOTH characterize degraded states and have the potential to become a dominant or co-dominant species on the ecological site if their future establishment and growth is not actively controlled by management interventions. Species that become dominant for only one to several years (e.g., short-term response to drought or wildfire) are not invasive plants. Note that unlike other indicators, we are describing what is NOT expected in the reference state for the ecological site:
-
Perennial plant reproductive capability:
Print Options
Sections
Font
AAAAOther
PrintThe Ecosystem Dynamics Interpretive Tool is an information system framework developed by the USDA-ARS Jornada Experimental Range, USDA Natural Resources Conservation Service, and New Mexico State University.
Accessibility statement


