
Natural Resources
Conservation Service
Ecological site F094AB028MI
Dry Sandy Slopes
Last updated: 5/13/2025
Accessed: 08/21/2026
-
Search


Major Land Resource Area or ecological site by name and/or ID.
PreviousSectionsNextGeneral information
Provisional. A provisional ecological site description has undergone quality control and quality assurance review. It contains a working state and transition model and enough information to identify the ecological site.
MLRA notes
Major Land Resource Area (MLRA): 094A–Northern Michigan Sandy Highlands
"This area is dominated by outwash plains and moraines. The terrain can be steep on the moraines and flat in the areas of outwash. Elevation ranges from 177 to 520 m (580 to 1705 ft). Local topographic relief averages 14 m and ranges up to 188 m (45 to 615 ft). This area is covered entirely by drift. Bedrock consisting of Devonian limestone and dolomite with interbedded shale, chert, and anhydrite stringers is at various depths below the surface because of the curvature of the Michigan basin. However, bedrock exposures completely absent, as the depth of glacial drift ranges from 60 to 300 m (200-1000 ft). The Au Sable, Manistee, Au Gres, and Pine Rivers are the major streams draining this MLRA, in both the Lake Michigan and Lake Huron watersheds. The Muskegon River has its headwaters in this area.
About 70 percent of this area is forested, and about 15 percent is cropland or hayland. About one-third of the area is in small, privately owned holdings, and another one-third consists of national and State forests. The forests are used mainly for timber production and recreation. Dairy and beef operations are very important enterprises in the area. Forage and feed grains for dairy cattle and other livestock are the principal crops. Wheat, oats, corn, potatoes, and hay also are grown in the area. The Huron and Manistee National Forests, Hartwick Pines State Park, Camp Grayling (Department of Defense), Pigeon River Country State Forest are among the most notable conservation lands in the area. Reaches of the Au Sable and Pine Rivers are National Wild and Scenic Rivers.
Summary of existing land use:
Upland Forest (58%)
Hardwood (41%)
Conifer (15%)
Swamps and Marshes (14%)
Developed (11%)
Agricultural (10%)
Grassland (5%)
"Classification relationships
According to the USFS (Bailey) system of ecoregions, the site is located mostly within 212Hg (Kirtland's Warbler High Sand Plains) and 212Hh (Gladwin Silty Lake Plain) subsections. According to the EPA (Omernik) system of ecoregions, the site is located in 50ae (Mio Plateau), 50ah (Tawas Lake Plain) and eastern 50ad (Vanderbilt Moraines) level IV ecoregions. This site roughly corresponds to PVCd, in the Kotar system. This site corresponds to the Ice Contact ecological land type 20 in the USFS Ecological Land Type system.
Ecological site concept
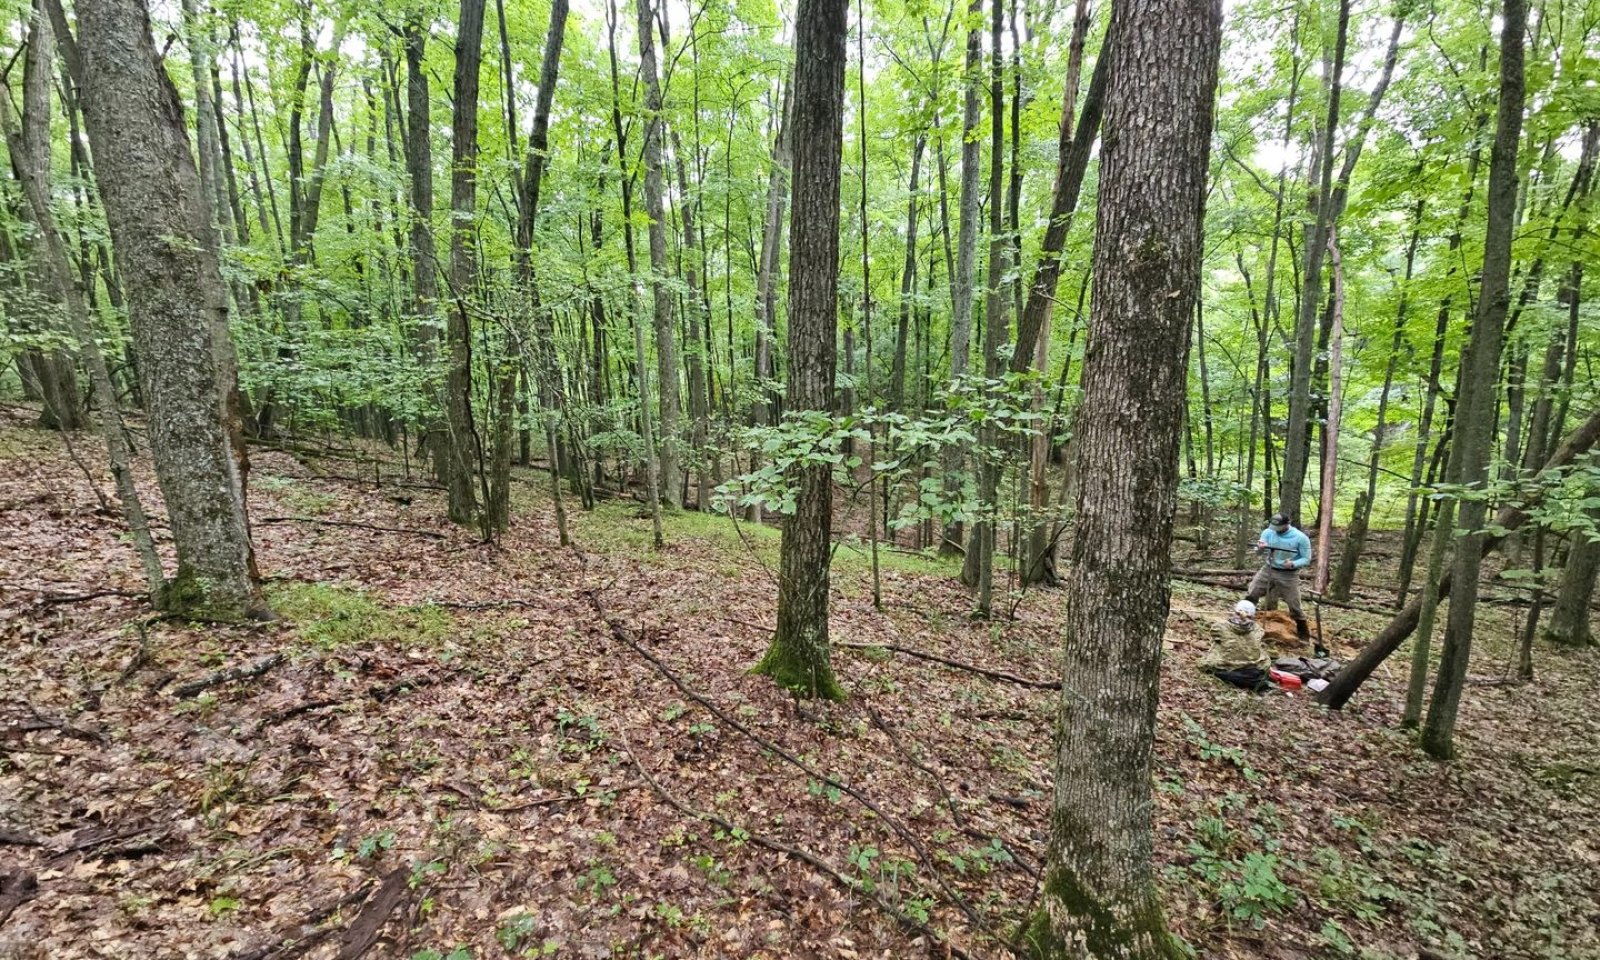
The central concept of Dry Sandy Slopes is uplands lacking a seasonal water table (excessively drained to well drained), lacking significant B horizon development in the soil profile, and on hilly landscapes greater than 15% slopes. Site occurs on sandy drift (outwash, ice contact, or lake plains) where soil textures are sand or loamy sand (upper 50 cm >70% sand). Site is outside the heavy snowfall belt, mostly east of Houghton Lake where fire was frequent. Vegetation trending towards xerophytic forests with a moderately high fire frequency.
Associated sites
F094AB018MI Rich Sandy Drift
Rich Sandy Drift has a greater amount of spodic development, which indirectly indicates higher productivity, or has higher pH, which drives higher productivity. Vegetation is similar.
F094AB019MI Dry Sandy Plains
Dry Sandy Plains has a lower topographic relief which tends to increase the size of wildfires. Consequently, there is more jack pine and less white pine and oak.
F094AB020MI Acidic Sandy Depression
Acidic Sandy Depression has a seasonally high water table, either moderately well drained or somewhat poorly drained. Consequently, there can be a transition to wetland species or higher cover of wintergreen.
Similar sites
F094AA006MI Snowy Sandy Drift
Snowy Sandy Drift has a greater amount of annual snowfall, which leads to longer fire interval. Consequently, there is more white pine and northern hardwoods and less jack pine.
F094AB019MI Dry Sandy Plains
Dry Sandy Plains has a lower topographic relief which tends to increase the size of wildfires. Consequently, there is more jack pine and less white pine and oak.
Table 1. Dominant plant species
Tree (1) Pinus strobus
(2) Quercus rubraShrub Not specified
Herbaceous (1) Pteridium aquilinum
Physiographic features
Site occurs mostly on sandy outwash plains, with minor amounts of coarse textured ice contact, glacial till, and lake plain deposits with similar properties. Landforms are mostly gently sloping, but there are no upper limits to slope defined.
Table 2. Representative physiographic features
Landforms (1) Kame
(2) Ice-contact slope
Runoff class Very low to medium Elevation 581 – 1572 ft Slope 15 – 45 % Water table depth 59 – 0 in Aspect W, NW, N, NE, E, SE, S, SW Climatic features
Mean annual temperatures are 5.7 to 7.6 °C (42 to 46 °F). The warmest six months average 14.3 to 16.1 °C (58 to 61 °F). Mean July temperatures range from 19.1 to 20.8 °C (66 to 69 °F). Mean January temperatures range from -8.2 to -6.0 °C (17 to 21 °F). The maximum monthly average daily highs are 25.9 to 27.7 °C (79 to 82 °F). The minimum monthly average daily lows are -13.2 to -10.7 °C (8 to 13 °F).Temperatures generally decrease with elevation and latitude. Mean annual precipitation ranges from 700 to 870 mm (28 to 34 in). Precipitation decreases from west to east. Average 0 °C (32 °F) frost-free season ranges from 73 to 144 days. Average -2 °C (28 °F) freeze-free season is 106 to 172 days. Mean annual snowfall ranges from 1.1 to 2.9 m (40 to 120 in). Snowfall decreases from northwest to southeast. Mean annual extreme minimum temperatures range from -33.3 to -23.1 °C (-28 to -10 °F), or hardiness zones 4a to 6a.
Table 3 Representative climatic features
Frost-free period (characteristic range) 80-110 days Freeze-free period (characteristic range) 120-140 days Precipitation total (characteristic range) 30-30 in Frost-free period (actual range) 50-110 days Freeze-free period (actual range) 110-150 days Precipitation total (actual range) 30-30 in Frost-free period (average) 90 days Freeze-free period (average) 130 days Precipitation total (average) 30 in Characteristic rangeActual rangeBarLineFigure 1. Monthly precipitation range
Characteristic rangeActual rangeBarLineFigure 2. Monthly minimum temperature range
Characteristic rangeActual rangeBarLineFigure 3. Monthly maximum temperature range
BarLineFigure 4. Monthly average minimum and maximum temperature
Figure 5. Annual precipitation pattern
Figure 6 Annual average temperature pattern
Climate stations used
-
(1) GRAYLING [USC00203391], Grayling, MI
-
(2) MIO HYDRO PLT [USC00205531], Mio, MI
-
(3) VANDERBILT 11ENE [USC00208417], Vanderbilt, MI
-
(4) HOUGHTON LK ROSCOMMON AP [USW00094814], Houghton Lake, MI
-
(5) HALE LOUD DAM [USC00203529], Glennie, MI
-
(6) WEST BRANCH 3SE [USC00208800], West Branch, MI
-
(7) EAST TAWAS [USC00202423], Tawas City, MI
">Influencing water features
Excessively drained to well drained, with typical water tables greater than 450 cm in depth.
Soil features
Soils are well drained to excessively well drained sands. They are commonly classified Lamellic Udipsamments, Typic Udipsamments, and commonly mapped as Graycalm, Grayling series. The top 50 cm has a typical pH of 5 and is 90% sand and 0.8% organic matter. At depth, pH ranges up to 5.8, and texture averages 90% sand and 5% clay. Depth to impeded hydraulic conductivity or root restrictive layers averages >200 cm. Depth to carbonates averages >200 cm.
Table 4. Representative soil features
Parent material (1) Outwash
Surface texture (1) Sand
Drainage class Excessively drained to well drained Permeability class Moderately rapid to rapid Soil depth 79 – 177 in Surface fragment cover <=3" 0 – 1 % Surface fragment cover >3" Not specified Available water capacity
(0-39.4in)1.57 – 3.94 in Soil reaction (1:1 water)
(0-19.7in)3.5 – 6 Subsurface fragment volume <=3"
(0-59.1in)0 – 10 % Subsurface fragment volume >3"
(0-59.1in)0 – 5 % Ecological dynamics
Dry Sandy Slopes tends to share the same ecological dynamics as Natureserve/Landfire system, Laurentian-Acadian Northern Pine(-Oak) Forest. Stand replacing fires occurred every 150-600 years, with light surface fires every 30-115 years. Overstory was dominated by fire dependent, early successional pine (Pinus spp.) or oak (Quercus spp.). Understory is composed of shade-tolerant, acid-tolerant forbs such as Canada mayflower (Maianthemum canadense). Kotar community, PArVVb (Pinus strobus-Acer rubrum/Vaccinium spp.-Viburnum acerifolium), understory indicator species include: Acer saccharum, Aralia nudicaulis, Eurybia macrophylla, Galium triflorum, Gaultheria procumbens, Hamamelis virginiana, Lonicera canadensis, Lysimachia borealis, Maianthemum canadense, Mitchella repens, Polygaloides paucifolia, Polygonatum pubescens, Pteridium aquilinum, Trillium grandiflorum, Vaccinium angustifolium, and Viburnum acerifolium (Sugar Maple, Wild Sarsaparilla, Big-leaved Aster, Fragrant Bedstraw, Teaberry, Witch-hazel, Canadian Fly Honeysuckle, Star-flower, Canada Mayflower, Partridge-berry, Fringed Polygala, Downy Solomon's-seal, Bracken Fern, Great White Trillium, Northern Lowbush Blueberry, and Maple-leaved Viburnum).
State and transition model
More interactive model formats are also available. View Interactive Models
Click on state and transition labels to scroll to the respective textEcosystem states
State 1 submodel, plant communities
State 2 submodel, plant communities
State 1
Reference StateCommunity 1.1
Mesophytic Conifer Forest: Pinus strobus - Tsuga canadensis Great Lakes ForestCommunity 1.2
Dry-Mesophytic Hardwood Forest: Quercus rubra - Quercus alba - (Quercus velutina, Acer rubrum) / Viburnum acerifolium Forest
Resilience management. This is an oak dominated variant which has become more prevalent after harvesting of pine followed by wildfire which kills regenerating pine. Over time, without fire, the stand will gradually become more dominated by red maple through a process of mesophication as it is more shade tolerant and more fire sensitive than oak. Too much maple will render the stand less flammable, crossing a threshold towards an alternative mesophytic state.
Table 5. Canopy structure (% cover)
Height Above Ground (ft) Tree Shrub/Vine Grass/
GrasslikeForb <0.5 – 5-7% 9-13% 0-5% >0.5 <= 1 4-15% 7-24% 9-13% 6-13% >1 <= 2 4-15% 2-22% – 6-13% >2 <= 4.5 0% 0-6% – – >4.5 <= 13 14-27% – – – >13 <= 40 49-65% – – – >40 <= 80 60-70% – – – >80 <= 120 – – – – >120 – – – – Community 1.3
Native Ruderal Forest: Populus (tremuloides, grandidentata) - Betula (populifolia, papyrifera) Ruderal WoodlandCommunity 1.4
Pine Forest: Pinus resinosa - Pinus strobus - (Quercus rubra) / Corylus cornuta ForestPathway 1.1A
Community 1.1 to 1.2Blowdown/clearcut followed by fire a few years after, destroying conifer regeneration, deferentially favoring oak regeneration.
Conservation practices
Prescribed Burning Forest Stand Improvement Pathway 1.1B
Community 1.1 to 1.3Blowdown/clearcut
Conservation practices
Early Successional Habitat Development/Management Forest Stand Improvement Pathway 1.1C
Community 1.1 to 1.4Crown fire, or blowdown/clearcut with fire in close succession.
Conservation practices
Prescribed Burning Forest Stand Improvement Pathway 1.2A
Community 1.2 to 1.1Succession
Pathway 1.2C
Community 1.2 to 1.3Blowdown/clearcut
Pathway 1.2B
Community 1.2 to 1.4Crown fire, or blowdown/clearcut with fire in close succession.
Conservation practices
Prescribed Burning Forest stand improvement for habitat and soil quality Pathway 1.3A
Community 1.3 to 1.1Succession
Conservation practices
Tree/Shrub Site Preparation Tree/Shrub Establishment Pathway 1.3C
Community 1.3 to 1.2Succession if fire consumed any subsequent pine regeneration.
Pathway 1.3B
Community 1.3 to 1.4Light fire removes the leaf litter, allowing for pine seedlings to establish followed by succession.
Pathway 1.4A
Community 1.4 to 1.1Succession.
Pathway 1.4C
Community 1.4 to 1.2Blowdown/clearcut followed by fire a few years after, destroying conifer regeneration, deferentially favoring oak regeneration.
Pathway 1.4B
Community 1.4 to 1.3Blowdown, clearcut, or crown fire, with establishment of clonal tree species.
State 2
Cultivated StateSite is generally undesirable to farm due to steep slopes, short growing season, and infertile soil.
Community 2.1
Conservation AgricultureCommunity 2.2
Conventional AgricultureCommunity 2.3
Conservation Feature.Can be a grassed waterway, conservation reserve, a small patch pollinator garden, or other land taken out of its primary cultural production to mitigate or reduce impacts of adjacent land use, and is not by itself a permanent restoration of a complete native biological community and associated ecosystem services.
Pathway 2.1A
Community 2.1 to 2.2Apply unsustainable farming techniques.
Pathway 2.1B
Community 2.1 to 2.3Establish conservation feature.
Conservation practices
Conservation Cover Grassed Waterway Pathway 2.2A
Community 2.2 to 2.1Apply sustainable farming techniques.
Conservation practices
Conservation Crop Rotation Cover Crop Nutrient Management Integrated Pest Management (IPM) Pathway 2.2B
Community 2.2 to 2.3Establish conservation feature.
Conservation practices
Conservation Cover Grassed Waterway Pathway 2.3A
Community 2.3 to 2.1Revert to sustainable agriculture.
Conservation practices
Conservation Crop Rotation Cover Crop Nutrient Management Integrated Pest Management (IPM) Pathway 2.3B
Community 2.3 to 2.2Revert to unsustainable agriculture.
State 3
Seminatural StateVegetation consists of a mix of native and non-native species.
Community 3.1
Ruderal Meadow & Shrubland: Dactylis glomerata - Festuca spp. - Solidago canadensis Ruderal Mesic Meadow AllianceCommunity 3.2
Exotic Ruderal Forest: Acer platanoides - Ailanthus altissima - Pinus spp. Exotic Ruderal Forest AlliancePathway 3.1A
Community 3.1 to 3.2Succession
Pathway 3.2A
Community 3.2 to 3.1Blowdown/clearcut
Transition T1A
State 1 to 2Clear vegetation; cultivate domesticated species
Transition T1B
State 1 to 3Clear vegetation, invasive species introduced
Restoration pathway R2
State 2 to 1Remove domesticated species; restore native species
Conservation practices
Brush Management Tree/Shrub Site Preparation Tree/Shrub Establishment Restoration and Management of Rare and Declining Habitats Upland Wildlife Habitat Management Herbaceous Weed Control Transition T2A
State 2 to 3Abandoned, succession
Restoration pathway R3
State 3 to 1Control invasive species; restore native species
Conservation practices
Brush Management Tree/Shrub Site Preparation Tree/Shrub Establishment Restoration and Management of Rare and Declining Habitats Upland Wildlife Habitat Management Herbaceous Weed Control Transition T3A
State 3 to 2Clear vegetation; cultivate domesticated species
Additional community tables
Table 6. Community 1.1 plant community composition
Group Common name Symbol Scientific name Annual production () Foliar cover (%) Table 7. Community 1.2 plant community composition
Group Common name Symbol Scientific name Annual production () Foliar cover (%) Table 8. Community 1.2 forest overstory composition
Common name Symbol Scientific name Nativity Height ft Canopy cover (%) Diameter in Basal area (square ft/acre) Treenorthern red oak QURU Quercus rubra Native 45.9-69.2 40.7-58.7 11.4-16.1 0 red maple ACRU Acer rubrum Native 32.8-57.4 3-38.3 5.1-14.6 0 red maple ACRU Acer rubrum Native 19.7-39.4 19.3-24.7 – 0 eastern white pine PIST Pinus strobus Native 6.6-26.2 0-8 – 0 white oak QUAL Quercus alba Native 32.8-62.3 0-5.3 13.8-15 0 Table 9. Community 1.2 forest understory composition
Common name Symbol Scientific name Nativity Height (ft) Canopy cover (%) Grass/grass-like (Graminoids)Pennsylvania sedge CAPE6 Carex pensylvanica Native 0.3–0.7 9.2–10.1 roughleaf ricegrass ORAS Oryzopsis asperifolia Native 0.3–0.7 0–1.5 rosette grass DICHA2 Dichanthelium Native 0.7–1.6 0–0.1 eastern bottlebrush grass ELHY Elymus hystrix Native 0.7–1.6 0–0.1 Forb/Herbstarflower TRBO2 Trientalis borealis Native 0–0.3 0–4.7 Canada mayflower MACA4 Maianthemum canadense Native 0–0.3 0–2.1 wood anemone ANQU Anemone quinquefolia Native 0.7–1.6 0–0.6 narrowleaf cowwheat MELI2 Melampyrum lineare Native 0–0.3 0.1–0.4 bigleaf aster EUMA27 Eurybia macrophylla Native 0.7–1.6 0–0.1 feathery false lily of the valley MARA7 Maianthemum racemosum Native 0.3–0.7 0–0.1 Fern/fern allywestern brackenfern PTAQ Pteridium aquilinum Native 0.7–1.6 7–9.7 Shrub/Subshrublowbush blueberry VAAN Vaccinium angustifolium Native 0.7–1.6 0–24 lowbush blueberry VAAN Vaccinium angustifolium Native 1.3–2.6 0–7.3 eastern teaberry GAPR2 Gaultheria procumbens Native 0.3–0.7 4.3–7 mapleleaf viburnum VIAC Viburnum acerifolium Native 0.7–1.6 0–0.8 black huckleberry GABA Gaylussacia baccata Native 0.7–1.6 0–0.1 Treered maple ACRU Acer rubrum Native 0.7–1.6 0–16 red maple ACRU Acer rubrum Native 8.2–16.4 0–14 eastern white pine PIST Pinus strobus Native 8.2–16.4 0–13.3 American witchhazel HAVI4 Hamamelis virginiana Native 8.2–16.4 0–3.3 common serviceberry AMAR3 Amelanchier arborea Native 0.7–1.6 0–2.3 American witchhazel HAVI4 Hamamelis virginiana Native 0.7–1.6 0–1.5 white oak QUAL Quercus alba Native 0.7–1.6 0.5–1.5 black cherry PRSE2 Prunus serotina Native 0.7–1.6 0.1–0.7 bigtooth aspen POGR4 Populus grandidentata Native 0.7–1.6 0–0.3 red pine PIRE Pinus resinosa Native 8.2–16.4 0–0.1 white ash FRAM2 Fraxinus americana Native 0.7–1.6 0–0.1 red pine PIRE Pinus resinosa Native 0.7–1.6 0–0.1 northern red oak QURU Quercus rubra Native 0.7–1.6 0.1 eastern white pine PIST Pinus strobus Native 0.7–1.6 0–0.1 white oak QUAL Quercus alba Native 8.2–16.4 0–0.1 Vine/Lianalimber honeysuckle LODI2 Lonicera dioica Native 0.7–1.6 0–0.3 NonvascularMoss 2MOSS Moss Native – 0–0.3 Table 10. Community 1.3 plant community composition
Group Common name Symbol Scientific name Annual production () Foliar cover (%) Table 11. Community 1.4 plant community composition
Group Common name Symbol Scientific name Annual production () Foliar cover (%) Table 12. Community 2.1 plant community composition
Group Common name Symbol Scientific name Annual production () Foliar cover (%) Table 13. Community 2.2 plant community composition
Group Common name Symbol Scientific name Annual production () Foliar cover (%) Table 14. Community 2.3 plant community composition
Group Common name Symbol Scientific name Annual production () Foliar cover (%) Table 15. Community 3.1 plant community composition
Group Common name Symbol Scientific name Annual production () Foliar cover (%) Table 16. Community 3.2 plant community composition
Group Common name Symbol Scientific name Annual production () Foliar cover (%) Interpretations
Supporting information
Inventory data references
Medium intensity field data was collected in 2024 from 3 sites representing community phase 1.2. More data are needed from other community phases to verify this provisional ecological site.
Approval
Greg Schmidt, 5/13/2025
Rangeland health reference sheet
Interpreting Indicators of Rangeland Health is a qualitative assessment protocol used to determine ecosystem condition based on benchmark characteristics described in the Reference Sheet. A suite of 17 (or more) indicators are typically considered in an assessment. The ecological site(s) representative of an assessment location must be known prior to applying the protocol and must be verified based on soils and climate. Current plant community cannot be used to identify the ecological site.
Author(s)/participant(s) Contact for lead author Date 02/18/2025 Approved by Approval date Composition (Indicators 10 and 12) based on Annual Production Indicators
-
Number and extent of rills:
-
Presence of water flow patterns:
-
Number and height of erosional pedestals or terracettes:
-
Bare ground from Ecological Site Description or other studies (rock, litter, lichen, moss, plant canopy are not bare ground):
-
Number of gullies and erosion associated with gullies:
-
Extent of wind scoured, blowouts and/or depositional areas:
-
Amount of litter movement (describe size and distance expected to travel):
-
Soil surface (top few mm) resistance to erosion (stability values are averages - most sites will show a range of values):
-
Soil surface structure and SOM content (include type of structure and A-horizon color and thickness):
-
Effect of community phase composition (relative proportion of different functional groups) and spatial distribution on infiltration and runoff:
-
Presence and thickness of compaction layer (usually none; describe soil profile features which may be mistaken for compaction on this site):
-
Functional/Structural Groups (list in order of descending dominance by above-ground annual-production or live foliar cover using symbols: >>, >, = to indicate much greater than, greater than, and equal to):
Dominant:
Sub-dominant:
Other:
Additional:
-
Amount of plant mortality and decadence (include which functional groups are expected to show mortality or decadence):
-
Average percent litter cover (%) and depth ( in):
-
Expected annual annual-production (this is TOTAL above-ground annual-production, not just forage annual-production):
-
Potential invasive (including noxious) species (native and non-native). List species which BOTH characterize degraded states and have the potential to become a dominant or co-dominant species on the ecological site if their future establishment and growth is not actively controlled by management interventions. Species that become dominant for only one to several years (e.g., short-term response to drought or wildfire) are not invasive plants. Note that unlike other indicators, we are describing what is NOT expected in the reference state for the ecological site:
-
Perennial plant reproductive capability:
Print Options
Sections
Font
AAAAOther
PrintThe Ecosystem Dynamics Interpretive Tool is an information system framework developed by the USDA-ARS Jornada Experimental Range, USDA Natural Resources Conservation Service, and New Mexico State University.
Accessibility statement


