
Natural Resources
Conservation Service
Ecological site F094AB019MI
Dry Sandy Plains
Last updated: 2/25/2025
Accessed: 08/18/2026
-
Search


Major Land Resource Area or ecological site by name and/or ID.
PreviousSectionsNextGeneral information
Provisional. A provisional ecological site description has undergone quality control and quality assurance review. It contains a working state and transition model and enough information to identify the ecological site.
Click to explore map
Figure 1. Mapped extent
Areas shown in blue indicate the maximum mapped extent of this ecological site. Other ecological sites likely occur within the highlighted areas. It is also possible for this ecological site to occur outside of highlighted areas if detailed soil survey has not been completed or recently updated.
MLRA notes
Major Land Resource Area (MLRA): 094A–Northern Michigan Sandy Highlands
"This area is dominated by outwash plains and moraines. The terrain can be steep on the moraines and flat in the areas of outwash. Elevation ranges from 177 to 520 m (580 to 1705 ft). Local topographic relief averages 14 m and ranges up to 188 m (45 to 615 ft). This area is covered entirely by drift. Bedrock consisting of Devonian limestone and dolomite with interbedded shale, chert, and anhydrite stringers is at various depths below the surface because of the curvature of the Michigan basin. However, bedrock exposures completely absent, as the depth of glacial drift ranges from 60 to 300 m (200-1000 ft). The Au Sable, Manistee, Au Gres, and Pine Rivers are the major streams draining this MLRA, in both the Lake Michigan and Lake Huron watersheds. The Muskegon River has its headwaters in this area.
About 70 percent of this area is forested, and about 15 percent is cropland or hayland. About one-third of the area is in small, privately owned holdings, and another one-third consists of national and State forests. The forests are used mainly for timber production and recreation. Dairy and beef operations are very important enterprises in the area. Forage and feed grains for dairy cattle and other livestock are the principal crops. Wheat, oats, corn, potatoes, and hay also are grown in the area. The Huron and Manistee National Forests, Hartwick Pines State Park, Camp Grayling (Department of Defense), Pigeon River Country State Forest are among the most notable conservation lands in the area. Reaches of the Au Sable and Pine Rivers are National Wild and Scenic Rivers.
Summary of existing land use:
Upland Forest (58%)
Hardwood (41%)
Conifer (15%)
Swamps and Marshes (14%)
Developed (11%)
Agricultural (10%)
Grassland (5%)
"Classification relationships
According to the USFS (Bailey) system of ecoregions, the site is located mostly within 212Hg (Kirtland's Warbler High Sand Plains) and 212Hh (Gladwin Silty Lake Plain) subsections. According to the EPA (Omernik) system of ecoregions, the site is located in 50ae (Mio Plateau), 50ah (Tawas Lake Plain) and eastern 50ad (Vanderbilt Moraines) level IV ecoregions. This site roughly corresponds to PVCd, in the Kotar system. This site corresponds to the Outwash Plains ecological land type 10 in the USFS Ecological Land Type system.
Ecological site concept
The central concept of Dry Sandy Plains is uplands lacking a seasonal water table (excessively drained to well drained), lacking significant B horizon development in the soil profile, and on broadly flat landscapes with less than 15% slopes. Site occurs on sandy drift (outwash, ice contact, or lake plains) where soil textures are sand or loamy sand (upper 50 cm >70% sand). Site is outside the heavy snowfall belt, mostly east of Houghton Lake where fire was frequent. Vegetation trending towards xerophytic woodlands and barrens with a high fire frequency.
Associated sites
F094AB028MI Dry Sandy Slopes
Dry Sandy Slopes has a greater amount of topographic relief which tends to reduce the size of wildfires. Consequently, there is more white pine, red pine, and oak and less jack pine.
F094AB018MI Rich Sandy Drift
Rich Sandy Drift has a greater amount of spodic development, which indirectly indicates higher productivity, or has higher pH, which drives higher productivity. Consequently, there is more white pine and oak and less jack pine.
F094AB020MI Acidic Sandy Depression
Acidic Sandy Depression has a seasonally high water table, either moderately well drained or somewhat poorly drained. Consequently, there can be a transition to wetland species or higher cover of wintergreen.
Similar sites
F094AA006MI Snowy Sandy Drift
Snowy Sandy Drift has a greater amount of annual snowfall, which leads to longer fire interval. Consequently, there is more white pine and northern hardwoods and less jack pine.
F094AB028MI Dry Sandy Slopes
Dry Sandy Slopes has a greater amount of topographic relief which tends to reduce the size of wildfires. Consequently, there is more white pine, red pine, and oak and less jack pine.
Table 1. Dominant plant species
Tree (1) Pinus banksiana
Shrub Not specified
Herbaceous (1) Carex pensylvanica
(2) Festuca scabrellaPhysiographic features
Site occurs mostly on sandy outwash plains, with minor amounts of coarse textured ice contact, glacial till, and lake plain deposits with similar properties. Landforms are mostly gently sloping.
Table 2. Representative physiographic features
Landforms (1) Outwash plain
(2) Outwash fan
Runoff class Negligible to low Elevation 581 – 1572 ft Slope 0 – 15 % Water table depth 59 – 177 in Aspect Aspect is not a significant factor Climatic features
Mean annual temperatures are 5.7 to 7.6 °C (42 to 46 °F). The warmest six months average 14.3 to 16.1 °C (58 to 61 °F). Mean July temperatures range from 19.1 to 20.8 °C (66 to 69 °F). Mean January temperatures range from -8.2 to -6.0 °C (17 to 21 °F). The maximum monthly average daily highs are 25.9 to 27.7 °C (79 to 82 °F). The minimum monthly average daily lows are -13.2 to -10.7 °C (8 to 13 °F).Temperatures generally decrease with elevation and latitude. Mean annual precipitation ranges from 700 to 870 mm (28 to 34 in). Precipitation decreases from west to east. Average 0 °C (32 °F) frost-free season ranges from 73 to 144 days. Average -2 °C (28 °F) freeze-free season is 106 to 172 days. Mean annual snowfall ranges from 1.1 to 2.9 m (40 to 120 in). Snowfall decreases from northwest to southeast. Mean annual extreme minimum temperatures range from -33.3 to -23.1 °C (-28 to -10 °F), or hardiness zones 4a to 6a.
Table 3 Representative climatic features
Frost-free period (characteristic range) 80-110 days Freeze-free period (characteristic range) 120-140 days Precipitation total (characteristic range) 30-30 in Frost-free period (actual range) 50-110 days Freeze-free period (actual range) 110-150 days Precipitation total (actual range) 30-30 in Frost-free period (average) 90 days Freeze-free period (average) 130 days Precipitation total (average) 30 in Characteristic rangeActual rangeBarLineFigure 2. Monthly precipitation range
Characteristic rangeActual rangeBarLineFigure 3. Monthly minimum temperature range
Characteristic rangeActual rangeBarLineFigure 4. Monthly maximum temperature range
BarLineFigure 5. Monthly average minimum and maximum temperature
Figure 6. Annual precipitation pattern
Figure 7 Annual average temperature pattern
Climate stations used
-
(1) EAST TAWAS [USC00202423], Tawas City, MI
-
(2) GRAYLING [USC00203391], Grayling, MI
-
(3) MIO HYDRO PLT [USC00205531], Mio, MI
-
(4) VANDERBILT 11ENE [USC00208417], Vanderbilt, MI
-
(5) HOUGHTON LK ROSCOMMON AP [USW00094814], Houghton Lake, MI
-
(6) HALE LOUD DAM [USC00203529], Glennie, MI
-
(7) WEST BRANCH 3SE [USC00208800], West Branch, MI
">Influencing water features
Excessively drained to well drained, with typical water tables greater than 450 cm in depth, (Forest Service Ecological Land Type Phases 9, 10, and 11). Areas transitional to wetter sites have a seasonally high water tables as near as 150 cm to the surface (Forest Service Ecological Land Type Phase 12).
Soil features
Soils are well drained to excessively well drained sands. They are commonly classified Typic Udipsamments and Lamellic Udipsamments, and commonly mapped as Grayling and Graycalm series. The top 50 cm has a typical pH of 5.0 and is 90% sand and 0.8% organic matter. At depths greater than 100 cm, pH ranges as high as 5.8, and texture averages 90% sand and 5% clay. Depth to impeded hydraulic conductivity or root restrictive layers is greater than 200 cm. Depth to carbonates averages deeper than 200 cm. Forest Service Ecological Land Type Phases 9, 10, 11, 12 (Cleland, et al., 1994).

Figure 8. Soil profile of Grayling sand.

Figure 9. Soil profile of Grayling sand.
Table 4. Representative soil features
Parent material (1) Outwash
Surface texture (1) Sand
Drainage class Excessively drained to well drained Permeability class Moderately rapid to rapid Soil depth 79 – 0 in Surface fragment cover <=3" 0 – 1 % Surface fragment cover >3" Not specified Available water capacity
(0-39.4in)1.57 – 3.94 in Soil reaction (1:1 water)
(0-19.7in)3.5 – 6 Subsurface fragment volume <=3"
(0-59.1in)0 – 10 % Subsurface fragment volume >3"
(0-59.1in)0 – 5 % Ecological dynamics
Dry Sandy Plains shares the same ecological dynamics as Natureserve/Landfire system, Laurentian-Acadian Jack Pine Barrens and Forest (Landfire, 2017). Stand replacing fires occurred every 10-80 years, with light surface fires every 2-20 years. Overstory was dominated by fire dependent, early successional jack pine (Pinus banksiana), red pine (P. resinosa), and Hill's oak (Quercus ellipsoidalis). Areas with overlapping stand replacement fires at intervals less than 20 years may result a "dry sand prairie" phase due to inadequacy of cone production in younger jack pine stands.
The main overstory tree, jack pine reproduction is dependent on reoccurring crown fire to open its serotinous cones, which releases abundant seeds. The Kirtland's Warbler (Setophaga kirtlandii) is dependent upon the early stages of dense jack pine regeneration. This key stage for nesting habitat is 5-23 years (peak at 8-15 years) from establishment while the trees are 1.7-5 m tall with 35-65% cover (Bocetti, Donner, and Mayfield, 2020). Optimal stem density is 5000-7500 per hectare, but naturally regenerated stands with as low as 2000 per hectare and 20-25% cover can support breeding pairs. As trees reach 5 m tall, the lower limbs tend to die off, making for less optimal habitat for the ground nesting Kirtland's Warbler. Kirtland's Warbler can also nest at low densities in young red pine plantations if it includes some amount of young jack pine. Isolated patch sizes generally need to be greater than 80 ha to support Kirtland's Warbler, but in proximity of other suitable stands, they will nest in patches as small as 12 ha (Bocetti, Donner, and Mayfield, 2020).
Understory is usually graminoid dominated with prairie grasses and forbs. Penn sedge (Carex pensylvanica) may form continuous cover under a moderately open canopy. Occasionally, bracken fern (Pteridium aquilinum) may also dominate. Regular fire is necessary to maintain a wider diversity of prairie forbs and grasses such as big bluestem (Andropogon gerardi), little bluestem (Schizachyrium scoparium), and Indiangrass (Sorghastrum nutans). The prairie forbs feature species disjunct from western North America such as prairie dandelion (Agoseris glauca) and rough fescue (Festuca altaica). Kotar community classification (Burger and Kotar, 2003) occuring within this ecosite include: PVCd (Pinus strobus/Vaccinium spp.-Cladina spp.), understory indicator species include: Arctostaphylos uva-ursi, Cladonia rangiferina, Comptonia peregrina, Pinus banksiana, Pteridium aquilinum, and Vaccinium angustifolium (Kinnikinnick, reindeer lichen, Sweetfern, Jack Pine, Bracken Fern, and Northern Lowbush Blueberry) (Burger, and Kotar, 2003).State and transition model
More interactive model formats are also available. View Interactive Models
Click on state and transition labels to scroll to the respective textEcosystem states
T1A - Clear vegetation; cultivate domesticated species T1B - Clear vegetation, invasive species introduced. T1C - Harvest and Planting R2 - Removal of domesticated species; restore native species. T2A - Abandoned, succession. R3 - Control invasive species; restore native species. T3A - Clear vegetation; cultivate domesticated species. R4A - Wildfire and migration/recolonization of missing native species. State 1 submodel, plant communities
1.1A - Succession. 1.1B - Crown fire followed by intense pine seedling regeneration. 1.2A - Crown fire followed by intense pine seedling regeneration. 1.3A - Succession about 16 years without fire, depending on initial regeneration of jack pine. 1.3B - Aspen established. 1.4A - Succession. 1.4B - Fire, killing regenerating jack pine. 1.5A - Aspen failure to regenerate after a fire. State 2 submodel, plant communities
State 3 submodel, plant communities
State 4 submodel, plant communities
P4.1A - Succession P4.2A - Clear cut; replant. P4.2A - Clearcut; plant red pine. P4.3A - Clearcut, plant jack pine. State 1
Reference State
Figure 10. Jack pine-red pine forests of different ages due to differential survival of wildfire.
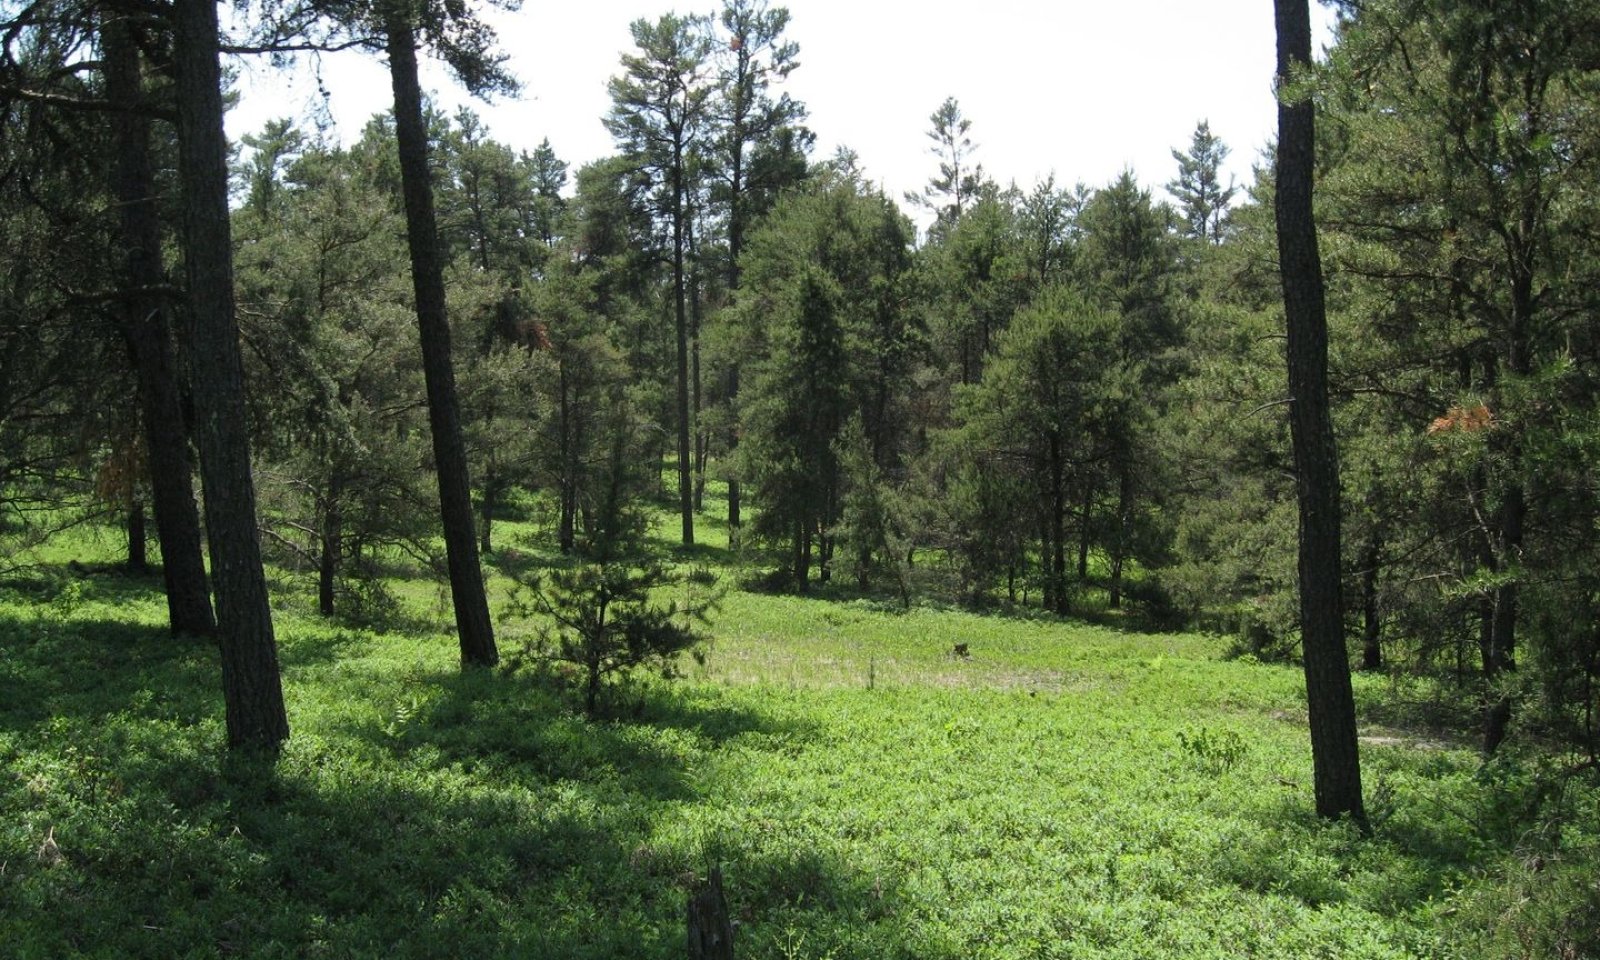
The reference condition consists of a range of open grassy (sedgy) to open jack pine (Pinus banksiana) and red pine (Pinus resinosa) woodlands.
Characteristics and indicators. All taxa are naturally regenerating and adapted to reoccuring fire. Presence of invasive species or trees planted in rows are all signs of alternative states.
Resilience management. Larger patches are still subject to occasional wildfire despite attempts at fire suppression. Low fertility of the site results in slow plant growth and thereby slow rates of mesophication during longer fire intervals and slow spread of invasive species except where soil is disturbed.
Dominant plant species
-
jack pine (Pinus banksiana), tree
-
northern pin oak (Quercus ellipsoidalis), tree
-
red pine (Pinus resinosa), tree
-
lowbush blueberry (Vaccinium angustifolium), shrub
-
Sesquehana sandcherry (Prunus susquehanae), shrub
-
sweet fern (Comptonia peregrina), shrub
-
Pennsylvania sedge (Carex pensylvanica), grass
-
wavy hairgrass (Deschampsia flexuosa), grass
-
little bluestem (Schizachyrium scoparium), grass
-
prairie Junegrass (Koeleria macrantha), grass
-
mountain ricegrass (Piptatheropsis pungens), grass
-
smooth blue aster (Symphyotrichum laeve), other herbaceous
Community 1.1
Mid-Successional Forest: Pinus banksiana - (Pinus resinosa) - Quercus ellipsoidalis / Carex pensylvanica ForestThis phase has a canopy closure of 25-65% and height of 5-10 m. This phase is 25-50 years old.
Forest overstory.Dominated by jack pine (Pinus banksiana) and scattered red pine (Pinus resinosa) and Hill's oak (Quercus ellipsoidalis).
Forest understory. Dominated by dwarf shrubs like lowbush blueberry.
Dominant plant species
-
jack pine (Pinus banksiana), tree
-
northern pin oak (Quercus ellipsoidalis), tree
-
lowbush blueberry (Vaccinium angustifolium), other herbaceous
Table 5. Canopy structure (% cover)
Height Above Ground (ft) Tree Shrub/Vine Grass/
GrasslikeForb <0.5 – 5-16% 9-39% 0-6% >0.5 <= 1 1-8% 50-66% 10-40% 1-19% >1 <= 2 1-8% 44-65% 1-6% 9-28% >2 <= 4.5 3-13% – 0-2% 8-20% >4.5 <= 13 14-42% – – – >13 <= 40 23-40% – – – >40 <= 80 14-20% – – – >80 <= 120 – – – – >120 – – – – Community 1.2
Late-Successional Forest: Pinus banksiana - (Pinus resinosa) - Quercus ellipsoidalis / Carex pensylvanica Forest

This phase has a canopy closure of 25-65% and height of 10-25 m. The trees are 51-224 years old and are beginning to thin as trees fall apart due to breakage and shading. Senescent trees may become standing snags.
Forest overstory.Dominated by jack pine (Pinus banksiana) and scattered red pine (Pinus resinosa) and Hill's oak (Quercus ellipsoidalis).
Forest understory. Dominated by dwarf shrubs with a thick layer of moss.
Dominant plant species
-
jack pine (Pinus banksiana), tree
-
northern pin oak (Quercus ellipsoidalis), tree
-
red pine (Pinus resinosa), tree
-
Pennsylvania sedge (Carex pensylvanica), grass
Table 6. Soil surface cover
Tree basal cover 0% Shrub/vine/liana basal cover 0% Grass/grasslike basal cover 0% Forb basal cover 0% Non-vascular plants 30-70% Biological crusts 0-20% Litter 10-70% Surface fragments >0.25" and <=3" 0% Surface fragments >3" 0% Bedrock 0% Water 0% Bare ground 0% Table 7. Woody ground cover
Downed wood, fine-small (<0.40" diameter; 1-hour fuels) 0-2% Downed wood, fine-medium (0.40-0.99" diameter; 10-hour fuels) 1-2% Downed wood, fine-large (1.00-2.99" diameter; 100-hour fuels) 0-1% Downed wood, coarse-small (3.00-8.99" diameter; 1,000-hour fuels) 1-2% Downed wood, coarse-large (>9.00" diameter; 10,000-hour fuels) 0% Tree snags** (hard***) 0% Tree snags** (soft***) 0% Tree snag count** (hard***) 0-10 per acre Tree snag count** (hard***) 0-40 per acre * Decomposition Classes: N - no or little integration with the soil surface; I - partial to nearly full integration with the soil surface.
** >10.16cm diameter at 1.3716m above ground and >1.8288m height--if less diameter OR height use applicable down wood type; for pinyon and juniper, use 0.3048m above ground.
*** Hard - tree is dead with most or all of bark intact; Soft - most of bark has sloughed off.
Table 8. Canopy structure (% cover)
Height Above Ground (ft) Tree Shrub/Vine Grass/
GrasslikeForb <0.5 – 2-6% 6-18% 0-1% >0.5 <= 1 2-8% 29-40% 6-22% 0-12% >1 <= 2 2-8% 27-39% 0-8% 0-14% >2 <= 4.5 4-14% – – 0-1% >4.5 <= 13 6-45% – – – >13 <= 40 45-68% – – – >40 <= 80 28-41% – – – >80 <= 120 – – – – >120 – – – – Community 1.3
Open Barrens: Pinus banksiana - (Quercus ellipsoidalis) / Schizachyrium scoparium - Prairie Forbs Woodland
Figure 11. Dry sand prairie, Huron National Forest, June, 2010.

Figure 12. Dry sand prairie, Huron National Forest, October, 2010.

Figure 13. Helianthus occidentalis

Figure 14. Agoseris glauca

Figure 15. Lithospermum caroliniense

Figure 16. Liatris cylindracea

Figure 17. Campanula rotundifolia

Figure 18. Liatris scariosa
Herb dominated sparse woodland. Woody canopy cover typically 0-25%. Tree heights are 5-25 m, mostly survivors of previous vegetation phases. Tree regeneration generally kept at 0 to 15 years old by reoccurring crown fire. Fire needed to maintain openness or else trees become too large and shade out herb layer.
Forest overstory.Generally open with a few surviving red pine or sparsely regenerated jack pine.
Forest understory. Dominated by graminoids and prairie forbs.
Dominant plant species
-
Sesquehana sandcherry (Prunus susquehanae), shrub
-
kinnikinnick (Arctostaphylos uva-ursi), shrub
-
lowbush blueberry (Vaccinium angustifolium), shrub
-
Pennsylvania sedge (Carex pensylvanica), grass
-
mountain ricegrass (Piptatheropsis pungens), grass
-
big bluestem (Andropogon gerardii), grass
-
little bluestem (Schizachyrium scoparium), grass
Table 9. Canopy structure (% cover)
Height Above Ground (ft) Tree Shrub/Vine Grass/
GrasslikeForb <0.5 3-6% 12-13% 13-24% 2-3% >0.5 <= 1 3-6% 19-21% 45-52% 5-6% >1 <= 2 – 14-15% 20-27% 3-4% >2 <= 4.5 – – 5-6% – >4.5 <= 13 – – – – >13 <= 40 – – – – >40 <= 80 – – – – >80 <= 120 – – – – >120 – – – – Community 1.4
Early Successional Thicket: Pinus banksiana - (Pinus resinosa) - Quercus ellipsoidalis / Carex pensylvanica Forest
Figure 19. Recently burned jack pine.

Figure 20. Jack pine seedling.

Figure 21. Kirtland's Warbler
Dense thicket of jack pine (Pinus banksiana) at 25-65% crown cover, and 0-5 m tall. Unless fire causes mortality of regenerated jack pine and reverting back to an herb dominated phase, this phase lasts about 0-20 years before succeeding to closed canopy phase. This phase is key nesting habitat for the rare Kirtland's warbler (Setophaga kirtlandi).
Forest overstory.Open with scattered older fire scarred red pine and Hill's oak.
Forest understory. Dominated by dense jack pine and dwarf shrubs, and graminoids.
Dominant plant species
-
jack pine (Pinus banksiana), tree
-
lowbush blueberry (Vaccinium angustifolium), shrub
-
Pennsylvania sedge (Carex pensylvanica), grass
Table 10. Soil surface cover
Tree basal cover 0% Shrub/vine/liana basal cover 0% Grass/grasslike basal cover 0% Forb basal cover 0% Non-vascular plants 0-10% Biological crusts 0% Litter 80-90% Surface fragments >0.25" and <=3" 0% Surface fragments >3" 0% Bedrock 0% Water 0% Bare ground 0-10% Table 11. Woody ground cover
Downed wood, fine-small (<0.40" diameter; 1-hour fuels) 0% Downed wood, fine-medium (0.40-0.99" diameter; 10-hour fuels) 1-5% Downed wood, fine-large (1.00-2.99" diameter; 100-hour fuels) 0-3% Downed wood, coarse-small (3.00-8.99" diameter; 1,000-hour fuels) 2-3% Downed wood, coarse-large (>9.00" diameter; 10,000-hour fuels) 0% Tree snags** (hard***) 0% Tree snags** (soft***) 0% Tree snag count** (hard***) 0 per acre Tree snag count** (hard***) 0-40 per acre * Decomposition Classes: N - no or little integration with the soil surface; I - partial to nearly full integration with the soil surface.
** >10.16cm diameter at 1.3716m above ground and >1.8288m height--if less diameter OR height use applicable down wood type; for pinyon and juniper, use 0.3048m above ground.
*** Hard - tree is dead with most or all of bark intact; Soft - most of bark has sloughed off.
Table 12. Canopy structure (% cover)
Height Above Ground (ft) Tree Shrub/Vine Grass/
GrasslikeForb <0.5 – 8-25% 13-59% 0-10% >0.5 <= 1 1-8% 71-92% 14-59% 2-26% >1 <= 2 1-8% 62-91% 1-4% 18-42% >2 <= 4.5 1-12% – 0-4% 17-39% >4.5 <= 13 21-38% – – – >13 <= 40 0-12% – – – >40 <= 80 – – – – >80 <= 120 – – – – >120 – – – – Community 1.5
Aspen Clone: Pinus strobus - Populus tremuloides - (Acer rubrum) / Pteridium aquilinum Forest
Figure 22. Mixed aspen woodland.
Dominated by clonal aspen with occasional oak or red maple without recent fire.
Forest overstory.Dominated by aspen and occasional oak.
Forest understory. Understory often dominated by bracken fern.
Dominant plant species
-
bigtooth aspen (Populus grandidentata), tree
-
quaking aspen (Populus tremuloides), tree
-
roughleaf ricegrass (Oryzopsis asperifolia), grass
-
western brackenfern (Pteridium aquilinum), other herbaceous
Table 13. Canopy structure (% cover)
Height Above Ground (ft) Tree Shrub/Vine Grass/
GrasslikeForb <0.5 – 2-3% 1-4% 3-5% >0.5 <= 1 – 5-12% 1-4% 13-32% >1 <= 2 12-12% 4-9% – 10-31% >2 <= 4.5 12-12% 0% – – >4.5 <= 13 0% 1-3% – – >13 <= 40 12-27% 1-3% – – >40 <= 80 60-67% – – – >80 <= 120 61-74% – – – >120 60-70% – – – Pathway 1.1A
Community 1.1 to 1.2Succession.
Pathway 1.1B
Community 1.1 to 1.4Crown fire followed by intense pine seedling regeneration.
Conservation practices
Prescribed Burning Tree/Shrub Site Preparation Tree/Shrub Establishment Forest Stand Improvement Pathway 1.2A
Community 1.2 to 1.4
Late-Successional Forest: Pinus banksiana - (Pinus resinosa) - Quercus ellipsoidalis / Carex pensylvanica Forest
Early Successional Thicket: Pinus banksiana - (Pinus resinosa) - Quercus ellipsoidalis / Carex pensylvanica ForestCrown fire followed by intense pine seedling regeneration.
Conservation practices
Prescribed Burning Tree/Shrub Site Preparation Tree/Shrub Establishment Forest Stand Improvement Pathway 1.3A
Community 1.3 to 1.4
Open Barrens: Pinus banksiana - (Quercus ellipsoidalis) / Schizachyrium scoparium - Prairie Forbs Woodland
Early Successional Thicket: Pinus banksiana - (Pinus resinosa) - Quercus ellipsoidalis / Carex pensylvanica ForestSuccession about 16 years without fire, depending on initial regeneration of jack pine.
Conservation practices
Tree/Shrub Site Preparation Tree/Shrub Establishment Pathway 1.3B
Community 1.3 to 1.5
Open Barrens: Pinus banksiana - (Quercus ellipsoidalis) / Schizachyrium scoparium - Prairie Forbs Woodland
Aspen Clone: Pinus strobus - Populus tremuloides - (Acer rubrum) / Pteridium aquilinum ForestAspen seedlings established or clone migration from adjacent stand due to lack of fire.
Pathway 1.4A
Community 1.4 to 1.1Succession.
Pathway 1.4B
Community 1.4 to 1.3
Early Successional Thicket: Pinus banksiana - (Pinus resinosa) - Quercus ellipsoidalis / Carex pensylvanica Forest
Open Barrens: Pinus banksiana - (Quercus ellipsoidalis) / Schizachyrium scoparium - Prairie Forbs WoodlandFire, killing regenerating jack pine.
Conservation practices
Prescribed Burning Pathway 1.5A
Community 1.5 to 1.3
Aspen Clone: Pinus strobus - Populus tremuloides - (Acer rubrum) / Pteridium aquilinum Forest
Open Barrens: Pinus banksiana - (Quercus ellipsoidalis) / Schizachyrium scoparium - Prairie Forbs WoodlandAspen failure to regenerate after a fire, either due to repeated fire reducing the energy reserves of a clone, or older trees senescing prior to fire.
State 2
Cultivated State
Figure 23. Christmas tree farm.
Hayfields and Christmas tree farms have been observed on similar sites in adjacent LRUs and are likely to occur to some degree here on private land. Cultivation of annual crops is limited due to short growing season and low soil nutrients.
Characteristics and indicators. Composition is completely regulated by land manager. Natural reproduction is inhibited.
Resilience management. May require constant fertilization to maintain productivity, but excess nutrient may also change soil chemistry that affects the species composition if ever abandoned.
Community 2.1
Conservation AgricultureCommunity 2.2
Conventional AgricultureCommunity 2.3
Conservation FeatureCan be a grassed waterway, conservation reserve, a small patch pollinator garden, or other land taken out of its primary cultural production to mitigate or reduce impacts of adjacent land use, and is not by itself a permanent restoration of a complete native biological community and associated ecosystem services.
Pathway 2.1A
Community 2.1 to 2.2Revert to unsustainable cultural practices.
Pathway 2.1B
Community 2.1 to 2.3Establish conservation feature.
Conservation practices
Conservation Cover Grassed Waterway Pathway 2.2A
Community 2.2 to 2.1Implement sustainable cultural practices.
Conservation practices
Conservation Crop Rotation Cover Crop Nutrient Management Integrated Pest Management (IPM) Pathway 2.2B
Community 2.2 to 2.3Establish conservation feature.
Conservation practices
Conservation Cover Grassed Waterway Pathway 2.3A
Community 2.3 to 2.1Implement sustainable cultural practices.
Conservation practices
Conservation Cover Conservation Crop Rotation Nutrient Management Integrated Pest Management (IPM) Pathway 2.3B
Community 2.3 to 2.2Revert to unsustainable cultural practices.
State 3
Seminatural Invaded State
Figure 24. Disturbed land infested with spotted knapweed.
The seminatural state consists of novel or reference analogs which happen to have an excess of invasive species beyond a threshold that native species can reproduce.
Characteristics and indicators. Invasive species in excess of an easily controlled abundance indicates this state.
Resilience management. Some invasive plants release allelopathic chemicals which may inhibit the growth of native species. A long seed bank for some species may make eradication challenging.
Dominant plant species
-
autumn olive (Elaeagnus umbellata), shrub
-
Canada bluegrass (Poa compressa), grass
-
smooth brome (Bromus inermis), grass
-
spotted knapweed (Centaurea stoebe), other herbaceous
Community 3.1
Ruderal Meadow & ShrublandCommunity 3.2
Exotic Ruderal ForestPathway 3.1A
Community 3.1 to 3.2Succession.
Pathway 3.2A
Community 3.2 to 3.1Blowdown/clearcut.
State 4
Intensively Managed State
Figure 25. Clear cut jack pine.

Figure 26. Clear cut jack pine.
The intensively managed state consists of clear cut logging activities and plantations of native tree species. It retains many of the functions of the reference state, but some community phases may be missing species or horizonal and vertical structure may differ in ways that have consequences to wildlife and at minimum "looks" artificial. Sometimes may be lacking in snags, due to harvest removing senescing older trees, but management interventions may mitigate this through girdling or other means.
Characteristics and indicators. Soil disturbance and trees planted in rows is an indicator of this state.
Resilience management. Periodic harvest removing nutrients on the site may reduce the productivity over time, but the species in this ecosystem are already tolerant to low nutrients. It is conceivable that repeated soil disturbance over a large area, without fire, may systematically change species composition over time (i.e. changes in meta-populations of species that have reproductive strategies favored by soil disturbance rather than fire).
Dominant plant species
-
jack pine (Pinus banksiana), tree
-
red pine (Pinus resinosa), tree
-
lowbush blueberry (Vaccinium angustifolium), shrub
-
Pennsylvania sedge (Carex pensylvanica), grass
Community 4.1
Young Jack Pine Plantation
Figure 27. Intensively planted jack pine observed from unplanted diamond-shaped opening.
Densely planted jack pine interrupted with small diamond shaped gaps 200-700 m² in size occupying about 10-25% of the area.
Forest overstory.Jack pine planted in rows close together, except earliest phases prior to reaching overstory.
Forest understory. Earliest phases consists of densely planted jack pine, difficult to move through. Understory may have graminoids and dwarf shrubs. Bare ground created by soil disturbance initially colonized by lichen.
Dominant plant species
-
jack pine (Pinus banksiana), tree
-
lowbush blueberry (Vaccinium angustifolium), shrub
-
Pennsylvania sedge (Carex pensylvanica), grass
Table 14. Soil surface cover
Tree basal cover 0% Shrub/vine/liana basal cover 0% Grass/grasslike basal cover 0% Forb basal cover 0% Non-vascular plants 20-40% Biological crusts 0-20% Litter 40-80% Surface fragments >0.25" and <=3" 0% Surface fragments >3" 0% Bedrock 0% Water 0% Bare ground 0-0% Table 15. Woody ground cover
Downed wood, fine-small (<0.40" diameter; 1-hour fuels) 0-1% Downed wood, fine-medium (0.40-0.99" diameter; 10-hour fuels) 0-4% Downed wood, fine-large (1.00-2.99" diameter; 100-hour fuels) 0-1% Downed wood, coarse-small (3.00-8.99" diameter; 1,000-hour fuels) 0-1% Downed wood, coarse-large (>9.00" diameter; 10,000-hour fuels) 0% Tree snags** (hard***) 0% Tree snags** (soft***) 0% Tree snag count** (hard***) 0 per acre Tree snag count** (hard***) 0-10 per acre * Decomposition Classes: N - no or little integration with the soil surface; I - partial to nearly full integration with the soil surface.
** >10.16cm diameter at 1.3716m above ground and >1.8288m height--if less diameter OR height use applicable down wood type; for pinyon and juniper, use 0.3048m above ground.
*** Hard - tree is dead with most or all of bark intact; Soft - most of bark has sloughed off.
Table 16. Canopy structure (% cover)
Height Above Ground (ft) Tree Shrub/Vine Grass/
GrasslikeForb <0.5 – 6-12% 13-22% 0-1% >0.5 <= 1 2-5% 30-52% 13-24% 1-2% >1 <= 2 2-5% 23-49% 0-3% 1-5% >2 <= 4.5 0-2% – – 0-3% >4.5 <= 13 8-35% – – – >13 <= 40 45-60% – – – >40 <= 80 – – – – >80 <= 120 – – – – >120 – – – – Community 4.2
Old Jack Pine Plantation
Figure 28. Older jack pine plantation.

Figure 29. Furrow and mound topography in jack pine plantation.
Old growth jack pine plantation consists of older trees up to 20 m tall arranged in rows with cover up to 70 percent. Mortality among overstory trees may result in snags.
Forest overstory.Dominated by jack pine (Pinus banksiana).
Forest understory. Consists of blueberry and a mossy understory. Lichens may persist in soil disturbed areas.
Dominant plant species
-
jack pine (Pinus banksiana), tree
Community 4.3
Red Pine Plantation
Figure 30. Red pine plantation forest floor view.

Figure 31. Red pine plantation canopy view.
Red pine planted in rows, with little understory growth.
Forest overstory.Overstory dominated by red pine (Pinus resinosa).
Forest understory. Understory very sparse with heavy pine needle litter. Many of the same understory species as jack pine forests but much sparser cover. Isolated pink lady's slippers may occur.
Dominant plant species
-
red pine (Pinus resinosa), tree
Pathway P4.1A
Community 4.1 to 4.2
Young Jack Pine Plantation
Old Jack Pine PlantationSuccession, trees grow larger.
Pathway P4.2A
Community 4.2 to 4.1
Old Jack Pine Plantation
Young Jack Pine PlantationClear cut and replant jack pine.
Pathway P4.2A
Community 4.2 to 4.3
Old Jack Pine Plantation
Red Pine PlantationClearcut; plant red pine.
Pathway P4.3A
Community 4.3 to 4.1
Red Pine Plantation
Young Jack Pine PlantationClearcut, plant jack pine.
Transition T1A
State 1 to 2
Reference State
Cultivated StateClear vegetation; cultivate domesticated species
Transition T1B
State 1 to 3
Reference State
Seminatural Invaded StateClear vegetation, invasive species introduced.
Transition T1C
State 1 to 4
Reference State
Intensively Managed StateHarvest and planting of a native stand, or replanting of a wildfire consumed stand.
Restoration pathway R2
State 2 to 1
Cultivated State
Reference StateRemove domesticated species; restore native species.
Conservation practices
Brush Management Tree/Shrub Site Preparation Tree/Shrub Establishment Restoration and Management of Rare and Declining Habitats Upland Wildlife Habitat Management Herbaceous Weed Control Transition T2A
State 2 to 3
Cultivated State
Seminatural Invaded StateAbandoned, succession.
Restoration pathway R3
State 3 to 1
Seminatural Invaded State
Reference StateControl invasive species; restore native species.
Conservation practices
Brush Management Tree/Shrub Site Preparation Tree/Shrub Establishment Restoration and Management of Rare and Declining Habitats Upland Wildlife Habitat Management Herbaceous Weed Control Restoration pathway T3A
State 3 to 2
Seminatural Invaded State
Cultivated StateClear vegetation; cultivate domesticated species.
Restoration pathway R4A
State 4 to 1
Intensively Managed State
Reference StateWildfire and migration/recolonization of missing native species.
Additional community tables
Table 17. Community 1.1 plant community composition
Group Common name Symbol Scientific name Annual production () Foliar cover (%) Table 18. Community 1.2 plant community composition
Group Common name Symbol Scientific name Annual production () Foliar cover (%) Table 19. Community 1.2 forest overstory composition
Common name Symbol Scientific name Nativity Height ft Canopy cover (%) Diameter in Basal area (square ft/acre) Treejack pine PIBA2 Pinus banksiana Native 19.7-39.4 2.5-25 – 0 jack pine PIBA2 Pinus banksiana Native 22-53.5 10.9-20.1 3.5-9.1 0 northern pin oak QUEL Quercus ellipsoidalis Native 32.8-52.5 0-16 – 0 red pine PIRE Pinus resinosa Native 19.7-63.6 2.7-11.8 – 0 black oak QUVE Quercus velutina Native 36.1-45.9 0-8 – 0 northern pin oak QUEL Quercus ellipsoidalis Native 19.7-39.4 0-3.5 – 0 red pine PIRE Pinus resinosa Native 19.7-39.4 0-2.5 – 0 balsam fir ABBA Abies balsamea Native 6.6-29.5 0-1 – 0 eastern white pine PIST Pinus strobus Native 21.3-42.7 0-0.4 – 0 Table 20. Community 1.2 forest understory composition
Common name Symbol Scientific name Nativity Height (ft) Canopy cover (%) Grass/grass-like (Graminoids)Pennsylvania sedge CAPE6 Carex pensylvanica Native 0.3–0.7 5–30 wavy hairgrass DEFL Deschampsia flexuosa Native 0.7–1.6 0–14 big bluestem ANGE Andropogon gerardii Native 0.7–1.6 0–0.3 rosette grass DICHA2 Dichanthelium Native 0.7–1.6 0 false melic SCPU Schizachne purpurascens Native 0.3–1 0 Forb/Herbnarrowleaf cowwheat MELI2 Melampyrum lineare Native 0–0.3 0.1–2.4 spreading dogbane APAN2 Apocynum androsaemifolium Native 0.3–1.3 0–0.1 Canada mayflower MACA4 Maianthemum canadense Native 0–0.3 0–0.1 goldenrod SOLID Solidago Native 0.7–1.6 0 Fern/fern allywestern brackenfern PTAQ Pteridium aquilinum Native 0.7–1.6 0–24.7 spinulose woodfern DRCA11 Dryopteris carthusiana Native 0.7–1.6 0–0.1 Shrub/Subshrublowbush blueberry VAAN Vaccinium angustifolium Native 0.7–1.6 24.8–40.7 eastern teaberry GAPR2 Gaultheria procumbens Native 0.3–0.7 0–6 kinnikinnick ARUV Arctostaphylos uva-ursi Native 0.3–0.7 0–2.5 chokecherry PRVI Prunus virginiana Native 0.7–1.6 0–1 sweet fern COPE80 Comptonia peregrina Native 0.7–1.6 0.1–0.7 Sesquehana sandcherry PRSU3 Prunus susquehanae Native 0.7–1.6 0–0.1 sweet fern COPE80 Comptonia peregrina Native 1–2 0–0.1 trailing arbutus EPRE2 Epigaea repens Native 0.3–1 0–0.1 prickly rose ROAC Rosa acicularis Native 0.7–1.6 0 Treenorthern pin oak QUEL Quercus ellipsoidalis Native 7.2–14.1 0.5–41.7 white oak QUAL Quercus alba Native 8.2–16.4 0–6.1 black cherry PRSE2 Prunus serotina Native 3.3–13.1 0–6.1 northern pin oak QUEL Quercus ellipsoidalis Native 0.7–1.6 0.2–3.5 white oak QUAL Quercus alba Native 0.7–1.6 0–2.5 red maple ACRU Acer rubrum Native 0.7–1.6 0–2.1 black cherry PRSE2 Prunus serotina Native 0.7–1.6 0–2 northern red oak QURU Quercus rubra Native 0.7–1.6 0–2 black oak QUVE Quercus velutina Native 0.7–1.6 0–1.5 jack pine PIBA2 Pinus banksiana Native 3.9–7.9 0–1.1 black oak QUVE Quercus velutina Native 3.3–6.6 0–1 northern red oak QURU Quercus rubra Native 8.2–16.4 0–1 red pine PIRE Pinus resinosa Native 3.3–6.6 0–0.6 eastern white pine PIST Pinus strobus Native 8.2–16.4 0–0.5 eastern white pine PIST Pinus strobus Native 0.7–1.6 0–0.3 common serviceberry AMAR3 Amelanchier arborea Native 0.7–1.6 0.1–0.3 jack pine PIBA2 Pinus banksiana Native 0.7–1.6 0–0.1 balsam fir ABBA Abies balsamea Native 3.3–6.6 0–0.1 common serviceberry AMAR3 Amelanchier arborea Native 3.3–6.6 0–0.1 red pine PIRE Pinus resinosa Native 0.7–1.6 0 balsam fir ABBA Abies balsamea Native 0.7–1.6 0 Biological Crustsgreygreen reindeer lichen CLRA60 Cladina rangiferina Native – 3.6–7.4 Lichen 2LICHN Lichen Native – 0–6.8 reindeer lichen CLAR60 Cladina arbuscula Native – 0 NonvascularMoss 2MOSS Moss Native – 9.3–66.2 Schreber's big red stem moss PLSC70 Pleurozium schreberi Native – 17–41.5 dicranum moss DIPO70 Dicranum polysetum Native – 15–25 Table 21. Community 1.3 plant community composition
Group Common name Symbol Scientific name Annual production () Foliar cover (%) Table 22. Community 1.3 forest understory composition
Common name Symbol Scientific name Nativity Height (ft) Canopy cover (%) Grass/grass-like (Graminoids)Pennsylvania sedge CAPE6 Carex pensylvanica Native 0.7–1 8.8–39.2 wavy hairgrass DEFL Deschampsia flexuosa Native 0.7–1.3 0–25.1 mountain ricegrass PIPU9 Piptatheropsis pungens Native 0.3–1 2.5–11.2 Altai fescue FEAL Festuca altaica Native 0.3–1 0–10 big bluestem ANGE Andropogon gerardii Native 1.6–3.3 3.1–6.3 little bluestem SCSC Schizachyrium scoparium Native 0.7–1.6 3.1–4.3 prairie Junegrass KOMA Koeleria macrantha Native 0.3–0.7 0.1–3.1 slender wheatgrass ELTR7 Elymus trachycaulus Native 0.7–1.6 0–1.2 roughleaf ricegrass ORAS Oryzopsis asperifolia Native 0–0.3 0–0.8 poverty oatgrass DASP2 Danthonia spicata Native 0.3–0.7 0–0.6 starved panicgrass DIDE4 Dichanthelium depauperatum Native 0.3–1 0–0.2 dryspike sedge CASI12 Carex siccata Native 0.7–1 0–0.1 Forb/Herbsmooth blue aster SYLA3 Symphyotrichum laeve Native 0.7–1 0.6–2 Ontario blazing star LICY Liatris cylindracea Native 0.7–1.3 0–1.5 woodland strawberry FRVE Fragaria vesca Native – 0–1 prairie goldenrod OLAL2 Oligoneuron album Native 0.7–1.3 0–1 early goldenrod SOJU Solidago juncea Native 0.7–1.3 0.5 gray goldenrod SONE Solidago nemoralis Native 0.3–1 0–0.5 yellow pimpernel TAIN Taenidia integerrima Native 0.3–1 0–0.5 hoary puccoon LICA12 Lithospermum canescens Native 0.3–1 0–0.5 Canada mayflower MACA4 Maianthemum canadense Native 0.3–0.7 0–0.5 largepod pinweed LEIN Lechea intermedia Native 0.3–1 0–0.4 low false bindweed CASP14 Calystegia spithamaea Native 0–0.3 0–0.3 bluebell bellflower CARO2 Campanula rotundifolia Native 0.7–1 0–0.3 rattlesnakeweed HIVE Hieracium venosum Native 0.3–1 0–0.3 tall cinquefoil POARA4 Potentilla arguta ssp. arguta Native 0.3–1 0–0.2 hookedspur violet VIAD Viola adunca Native 0–0.3 0–0.2 bastard toadflax COUM Comandra umbellata Native 0.3–1 0–0.2 narrowleaf hawkweed HIUM Hieracium umbellatum Native 0.3–1 0–0.2 pale agoseris AGGL Agoseris glauca Native – 0–0.1 wood anemone ANQU Anemone quinquefolia Native 0.3–1 0–0.1 Howell's pussytoes ANHO Antennaria howellii Native 0.3–1 0–0.1 Canadian horseweed COCAC3 Conyza canadensis var. canadensis Native 0.3–1 0–0.1 fewleaf sunflower HEOC2 Helianthus occidentalis Native 0.7–1.6 0–0.1 longleaf summer bluet HOLO Houstonia longifolia Native 0.3–1 0–0.1 devil's bite LISC2 Liatris scariosa Native 0.7–1.3 0–0.1 narrowleaf cowwheat MELI2 Melampyrum lineare Native 0–0.3 0–0.1 racemed milkwort POPO Polygala polygama Native 0.3–1 0–0.1 Hill's thistle CIHI Cirsium hillii Native 0–1.6 0–0.1 Fern/fern allywestern brackenfern PTAQ Pteridium aquilinum Native 0.7–1.6 0–1.2 Shrub/SubshrubSesquehana sandcherry PRSU3 Prunus susquehanae Native 0.7–1.6 10.6–12.6 kinnikinnick ARUV Arctostaphylos uva-ursi Native 0–0.3 5–9.4 lowbush blueberry VAAN Vaccinium angustifolium Native 0.3–1 3–4.7 sweet fern COPE80 Comptonia peregrina Native 0.3–1 0–4.3 roundleaf serviceberry AMSA Amelanchier sanguinea Native 0.7–1.6 0.1–2.5 chokecherry PRVI Prunus virginiana Native 0.7–1.6 0.3–2 gray dogwood CORA6 Cornus racemosa Native 0.7–1.6 0–0.8 velvetleaf huckleberry VAMY Vaccinium myrtilloides Native 0.7–1.6 0–0.5 prickly rose ROAC Rosa acicularis Native 0.7–1.6 0–0.1 smooth rose ROBL Rosa blanda Native 0.3–0.7 0–0.1 prairie willow SAHU2 Salix humilis Native 0.7–1.6 0–0.1 common snowberry SYAL Symphoricarpos albus Native 0.7–1.6 0–0.1 Treeblack cherry PRSE2 Prunus serotina Native 0.7–1.6 0–5 northern pin oak QUEL Quercus ellipsoidalis Native 0.7–1.6 0–3.1 jack pine PIBA2 Pinus banksiana Native 0.7–1.6 0–1.2 quaking aspen POTR5 Populus tremuloides Native 0.7–1.6 0–0.1 white oak QUAL Quercus alba Native 0.7–1.6 0–0.1 Table 23. Community 1.4 plant community composition
Group Common name Symbol Scientific name Annual production () Foliar cover (%) Table 24. Community 1.4 forest overstory composition
Common name Symbol Scientific name Nativity Height ft Canopy cover (%) Diameter in Basal area (square ft/acre) Treejack pine PIBA2 Pinus banksiana Native 13.1-39.4 0-2.5 – 0 Table 25. Community 1.4 forest understory composition
Common name Symbol Scientific name Nativity Height (ft) Canopy cover (%) Grass/grass-like (Graminoids)Pennsylvania sedge CAPE6 Carex pensylvanica Native 0.3–0.7 15.2–63.3 roughleaf ricegrass ORAS Oryzopsis asperifolia Native 1.3–2.6 0–1.8 big bluestem ANGE Andropogon gerardii Native 0.7–1.6 0–0.5 mountain ricegrass PIPU9 Piptatheropsis pungens Native 0.7–1.6 0–0.3 wavy hairgrass DEFL Deschampsia flexuosa Native 0.7–1.6 0–0.2 rosette grass DICHA2 Dichanthelium Native 0.7–1.6 0–0.2 false melic SCPU Schizachne purpurascens Native 0.3–1 0–0.1 Forb/Herbnarrowleaf cowwheat MELI2 Melampyrum lineare Native 0–0.3 0–17.6 pussytoes ANTEN Antennaria Native 0.7–1.6 0.1–0.2 spreading dogbane APAN2 Apocynum androsaemifolium Native 0.7–1.6 0.1–0.2 clasping milkweed ASAM Asclepias amplexicaulis Native 0.7–1.6 0–0.2 green adder's-mouth orchid MAUN Malaxis unifolia Native 0.7–1.6 0–0.2 racemed milkwort POPO Polygala polygama Native 0.7–1.6 0–0.2 hairy goldenrod SOHI Solidago hispida Native 0.7–1.6 0.1–0.2 smooth blue aster SYLA3 Symphyotrichum laeve Native 0.7–1.6 0.1–0.2 hookedspur violet VIAD Viola adunca Native 0.7–1.6 0–0.2 arrowleaf violet VISA2 Viola sagittata Native 0.7–1.6 0–0.2 Canada mayflower MACA4 Maianthemum canadense Native 0–0.3 0–0.2 Fern/fern allywestern brackenfern PTAQ Pteridium aquilinum Native 1.3–2.6 5.7–59.8 Shrub/Subshrublowbush blueberry VAAN Vaccinium angustifolium Native 0.7–1.6 63–73 sweet fern COPE80 Comptonia peregrina Native 0.7–1.6 0–19.5 Sesquehana sandcherry PRSU3 Prunus susquehanae Native 0.7–1.6 0–14.7 kinnikinnick ARUV Arctostaphylos uva-ursi Native 0.3–0.7 0–13.2 black huckleberry GABA Gaylussacia baccata Native 0.7–1.6 0–8.5 trailing arbutus EPRE2 Epigaea repens Native 0.3–1 0–3.5 sweet fern COPE80 Comptonia peregrina Native 0.7–1.6 0–3 eastern teaberry GAPR2 Gaultheria procumbens Native 0.3–0.7 0.8–2.2 prairie willow SAHU2 Salix humilis Native 2.3–4.6 0–1 northern dewberry RUFL Rubus flagellaris Native 0.7–1.6 0–0.5 roundleaf serviceberry AMSA Amelanchier sanguinea Native 0.7–1.6 0–0.2 chokecherry PRVI Prunus virginiana Native 2–3.9 0–0.1 Treejack pine PIBA2 Pinus banksiana Native 7.2–14.4 2.2–29.6 northern pin oak QUEL Quercus ellipsoidalis Native 3.9–7.5 0.5–22 jack pine PIBA2 Pinus banksiana Native 0.7–1.6 0–6.5 black cherry PRSE2 Prunus serotina Native 6.9–13.8 0–3.1 northern pin oak QUEL Quercus ellipsoidalis Native 0.7–1.6 0.9–2.3 black cherry PRSE2 Prunus serotina Native 0.7–1.6 0–0.7 red maple ACRU Acer rubrum Native 0.3–0.7 0–0.5 white oak QUAL Quercus alba Native 0.7–1.6 0–0.4 common serviceberry AMAR3 Amelanchier arborea Native 0.7–1.6 0–0.1 hawthorn CRATA Crataegus Native 0.7–1.3 0–0.1 Biological Crustsgreygreen reindeer lichen CLRA60 Cladina rangiferina Native – 0–0.8 NonvascularMoss 2MOSS Moss Native – 0.2–0.8 polytrichum moss POLYT5 Polytrichum Native – 0–0.1 Table 26. Community 1.5 plant community composition
Group Common name Symbol Scientific name Annual production () Foliar cover (%) Table 27. Community 1.5 forest overstory composition
Common name Symbol Scientific name Nativity Height ft Canopy cover (%) Diameter in Basal area (square ft/acre) Treebigtooth aspen POGR4 Populus grandidentata Native 57.1-83.7 56.1-57.9 8.3-15.7 0 red maple ACRU Acer rubrum Native 19.7-39.4 16-42 – 0 red maple ACRU Acer rubrum Native 16.4-91.9 10.8-28.3 13.4-17.7 0 northern red oak QURU Quercus rubra Native 26.2-75.5 5.5-14.5 41.7 0 northern red oak QURU Quercus rubra Native 16.4-36.1 5 – 0 Table 28. Community 1.5 forest understory composition
Common name Symbol Scientific name Nativity Height (ft) Canopy cover (%) Grass/grass-like (Graminoids)roughleaf ricegrass ORAS Oryzopsis asperifolia Native 0.3–0.7 1.1–2.9 Pennsylvania sedge CAPE6 Carex pensylvanica Native 0.3–0.7 0.6–1.4 Forb/Herbstarflower TRBO2 Trientalis borealis Native 0–0.3 1 Canada mayflower MACA4 Maianthemum canadense Native 0–0.3 0.6–0.9 bigleaf aster EUMA27 Eurybia macrophylla Native 0.7–1.6 0.3–0.7 pussytoes ANTEN Antennaria Native 0.7–1.6 0.1 poke milkweed ASEX Asclepias exaltata Native 0.7–1.6 0.1 bedstraw GALIU Galium Native 0.7–1.6 0.1 Fern/fern allywestern brackenfern PTAQ Pteridium aquilinum Native 0.7–1.6 13.9–30.1 Shrub/Subshrubblack huckleberry GABA Gaylussacia baccata Native 0.7–1.6 1.9–5.1 lowbush blueberry VAAN Vaccinium angustifolium Native 0.7–1.6 1.1–2.9 eastern teaberry GAPR2 Gaultheria procumbens Native 0.3–0.7 1.1–2.9 mapleleaf viburnum VIAC Viburnum acerifolium Native 0.7–1.6 1 blackberry RUBUS Rubus Native 0.3–1 0.3–0.7 pipsissewa CHUM Chimaphila umbellata Native 0.7–1.6 0.1–0.4 mapleleaf viburnum VIAC Viburnum acerifolium Native 3.3–6.6 0–0.1 Treered maple ACRU Acer rubrum Native 8.2–16.4 6.2–14.8 red maple ACRU Acer rubrum Native 0.7–1.6 3.8–8.2 northern red oak QURU Quercus rubra Native 8.2–16.4 3.5–7.5 white ash FRAM2 Fraxinus americana Native 0.7–1.6 1.4–3.6 American witchhazel HAVI4 Hamamelis virginiana Native 4.9–8.2 0.8–2.2 black cherry PRSE2 Prunus serotina Native 0.7–1.6 0.7–1.5 American basswood TIAM Tilia americana Native 0.7–1.6 0.6–1.4 common serviceberry AMAR3 Amelanchier arborea Native 0.7–1.6 0.6–0.9 northern red oak QURU Quercus rubra Native 0.7–1.6 0.4–0.8 black cherry PRSE2 Prunus serotina Native 8.2–16.4 0.3–0.7 American beech FAGR Fagus grandifolia Native 0.7–1.6 0.3–0.7 common serviceberry AMAR3 Amelanchier arborea Native 8.2–16.4 0.2–0.5 American basswood TIAM Tilia americana Native 8.2–16.4 0.2–0.5 white ash FRAM2 Fraxinus americana Native 8.2–16.4 0.2–0.5 white oak QUAL Quercus alba Native 0.7–1.6 0.1–0.4 sugar maple ACSA3 Acer saccharum Native 0.7–1.6 0.1 hophornbeam OSVI Ostrya virginiana Native 0.7–1.6 0.1 bigtooth aspen POGR4 Populus grandidentata Native 8.2–16.4 0–0.1 American beech FAGR Fagus grandifolia Native 8.2–16.4 0–0.1 Table 29. Community 2.1 plant community composition
Group Common name Symbol Scientific name Annual production () Foliar cover (%) Table 30. Community 2.2 plant community composition
Group Common name Symbol Scientific name Annual production () Foliar cover (%) Table 31. Community 2.3 plant community composition
Group Common name Symbol Scientific name Annual production () Foliar cover (%) Table 32. Community 3.1 plant community composition
Group Common name Symbol Scientific name Annual production () Foliar cover (%) Table 33. Community 3.2 plant community composition
Group Common name Symbol Scientific name Annual production () Foliar cover (%) Table 34. Community 4.1 plant community composition
Group Common name Symbol Scientific name Annual production () Foliar cover (%) Table 35. Community 4.1 forest overstory composition
Common name Symbol Scientific name Nativity Height ft Canopy cover (%) Diameter in Basal area (square ft/acre) Treejack pine PIBA2 Pinus banksiana Native 12.5-27.6 39.9-53.4 – 0 northern pin oak QUEL Quercus ellipsoidalis Native 6.6-23 0-0.1 – 0 Table 36. Community 4.1 forest understory composition
Common name Symbol Scientific name Nativity Height (ft) Canopy cover (%) Grass/grass-like (Graminoids)Pennsylvania sedge CAPE6 Carex pensylvanica Native 0.3–0.7 14.5–15.4 big bluestem ANGE Andropogon gerardii Native 0.7–1.6 0–3.5 poverty oatgrass DASP2 Danthonia spicata Native 0.3–1 0–3.5 bentgrass AGROS2 Agrostis Native 0.7–1.6 0–0.6 wavy hairgrass DEFL Deschampsia flexuosa Native 0.7–1.6 0–0.1 Forb/Herbnarrowleaf cowwheat MELI2 Melampyrum lineare Native 0–0.3 0.1–1.4 spreading dogbane APAN2 Apocynum androsaemifolium Native 0.7–1.6 0–0.1 bluebell bellflower CARO2 Campanula rotundifolia Native 0.7–1.6 0.1 gray goldenrod SONE Solidago nemoralis Native 0.7–1.6 0–0.1 showy goldenrod SOSP2 Solidago speciosa Native 0.7–1.6 0–0.1 smooth blue aster SYLA3 Symphyotrichum laeve Native 0.7–1.6 0–0.1 hookedspur violet VIAD Viola adunca Native 0.7–1.6 0–0.1 Indianpipe MOUN3 Monotropa uniflora Native 0–0.3 0–0.1 clasping milkweed ASAM Asclepias amplexicaulis Native 0.7–1.6 0–0.1 Fern/fern allywestern brackenfern PTAQ Pteridium aquilinum Native 1.3–3 0.9–4.5 Shrub/Subshrublowbush blueberry VAAN Vaccinium angustifolium Native 0.7–1.6 29.6–35 kinnikinnick ARUV Arctostaphylos uva-ursi Native 0.3–0.7 0.8–10.7 sweet fern COPE80 Comptonia peregrina Native 0.7–1.6 3.4–4.3 sandcherry PRPU3 Prunus pumila Native 0.7–1.3 0.2–0.8 white meadowsweet SPAL2 Spiraea alba Native 0.7–1.6 0–0.3 roundleaf serviceberry AMSA Amelanchier sanguinea Native 0.7–1.6 0–0.1 chokecherry PRVI Prunus virginiana Native 0.7–1.6 0–0.1 blackberry RUBUS Rubus Native 0.3–1 0–0.1 black huckleberry GABA Gaylussacia baccata Native 1.6–3.3 0–0.1 eastern teaberry GAPR2 Gaultheria procumbens Native 0–0.3 0–0.1 Treeblack oak QUVE Quercus velutina Native 7.9–16.1 0–10.4 northern pin oak QUEL Quercus ellipsoidalis Native 0.7–1.6 0–5.3 northern pin oak QUEL Quercus ellipsoidalis Native 6.6–13.1 0–3.9 black cherry PRSE2 Prunus serotina Native 5.9–14.4 0–2.5 jack pine PIBA2 Pinus banksiana Native 7.9–15.7 0.1–0.8 black cherry PRSE2 Prunus serotina Native 0.7–1.6 0–0.7 black oak QUVE Quercus velutina Native 0.7–1.6 0–0.5 jack pine PIBA2 Pinus banksiana Native 0.7–1.6 0.1 hawthorn CRATA Crataegus Native 0.7–1.6 0–0.1 Biological Crustsgreygreen reindeer lichen CLRA60 Cladina rangiferina Native – 27 NonvascularMoss 2MOSS Moss Native – 22.2–46.5 dicranum moss DIPO70 Dicranum polysetum Native – 5.4–27.9 polytrichum moss POLYT5 Polytrichum Native – 0–26.8 Schreber's big red stem moss PLSC70 Pleurozium schreberi Native – 2.2–11.2 Table 37. Community 4.2 plant community composition
Group Common name Symbol Scientific name Annual production () Foliar cover (%) Table 38. Community 4.3 plant community composition
Group Common name Symbol Scientific name Annual production () Foliar cover (%) Table 39. Community 4.3 forest overstory composition
Common name Symbol Scientific name Nativity Height ft Canopy cover (%) Diameter in Basal area (square ft/acre) Table 40. Community 4.3 forest understory composition
Common name Symbol Scientific name Nativity Height (ft) Canopy cover (%) Interpretations
Supporting information
Inventory data references
In the 2024 field season there were 4 medium intensity and 9 high intensity plots representing community phases 1.2, 1.4, 1.5, and 4.1. Semi-quantitative 0.1 ha nested frequency plots were conducted at 2 locations on the Huron National Forest in 2007 by USFS staff, one of which included a line-point crown cover transect. This represents at least 90% of the areal coverage of natural communities and verifies the site concept. There were an additional 14 medium intensity plots in the vicinity of these plots that were considered outside the Dry Sandy Plains site concept once the pedons were classified. Quantitative field data for semi-natural or cultivated community phases is still lacking.
Other references
A PROVISIONAL ECOLOGICAL SITE is a conceptual grouping of soil map unit components within a major land resource area (MLRA) based on the similarities in response to management. A provisional ecological site is a first approximation based on a cursory literature review, personal experience, and limited field reconnaissance. As more adequate literature review, expert opinion, and intensive plot data are collected, the site concept is subject to shifting, broadening, narrowing, subdivision, or re-aggregation in definition. Likewise, the community dynamics will be more elaborate in content, and may also change in structure, upon reaching approved status.
Future work, as described in a project plan, to validate the information in this provisional ecological site description is needed. This will include field activities to collect low and medium intensity sampling, soil correlations, and analysis of that data. Annual field reviews should be done by soil scientists and vegetation specialists. A final field review, peer review, quality control, and quality assurance reviews of the ESD will be needed to produce the final document. Annual reviews of the project plan are to be conducted by the Ecological Site Technical Team.
Albert, D. A. et al., 1995. Vegetation circa 1800 of Michigan. Michigan's native landscape as interpreted from the General Land Office Surveys 1816-1856 (digital map), Lansing: Michigan Natural Features Inventory.
Baker, M.E. and Barnes, B.V., 1998. Landscape ecosystem diversity of river floodplains in northwestern Lower Michigan, USA. Canadian Journal of Forest Research, 28(9), pp.1405-1418.
Barnes, B. V. and Wagner, W. H., 2004. Michigan trees: a guide to the trees of the Great Lakes region. Ann Arbor (Michigan): University of Michigan Press.
Bocetti, C. I., D. M. Donner, and H. F. Mayfield, 2020. Kirtland's Warbler (Setophaga kirtlandii), version 1.0. In Birds of the World (A. F. Poole, Editor). Cornell Lab of Ornithology, Ithaca, NY, USA. https://doi.org/10.2173/bow.kirwar.01
Burger, T. L. and Kotar, J., 2003. A Guide to Forest Communities and Habitat Types of Michigan. Madison, Wisconsin: Department of Forest Ecology and Management, University of Wisconsin.
Cleland, D. T. et al., 1994. Field guide: Ecological classification and inventory system of the Huron-Manistee National Forests, s.l.: USDA Forest Service, North Central Forest Experiment Station.
Kost, M. A. et al., 2010. Natural Communities of Michigan: Classification and Description, Lansing, MI: Michigan Natural Features Inventory.
Landfire, 2017. Landfire Biophysical Settings Review Site. Accessed May, 2017 http://www.landfirereview.org/descriptions.html.
U.S. Department of the Interior, Geological Survey, 2011. LANDFIRE: LANDFIRE 1.1.0 Existing Vegetation Type layer. http://landfire.cr.usgs.gov/viewer/
USFS, Witness Tree data for northern Lower Michigan.Contributors
Gregory J. Schmidt
Approval
Greg Schmidt, 2/25/2025
Acknowledgments
The following individuals made substantive comments regarding the development of the Provisional Ecological Sites: Randy Swaty, The Nature Conservancy; Trevor Hobbs, USFS; Richard A. Corner, USFS; Andy Henriksen, NRCS; Dan Zay, NRCS.
Rangeland health reference sheet
Interpreting Indicators of Rangeland Health is a qualitative assessment protocol used to determine ecosystem condition based on benchmark characteristics described in the Reference Sheet. A suite of 17 (or more) indicators are typically considered in an assessment. The ecological site(s) representative of an assessment location must be known prior to applying the protocol and must be verified based on soils and climate. Current plant community cannot be used to identify the ecological site.
Author(s)/participant(s) Contact for lead author Date 01/07/2025 Approved by Approval date Composition (Indicators 10 and 12) based on Annual Production Indicators
-
Number and extent of rills:
-
Presence of water flow patterns:
-
Number and height of erosional pedestals or terracettes:
-
Bare ground from Ecological Site Description or other studies (rock, litter, lichen, moss, plant canopy are not bare ground):
-
Number of gullies and erosion associated with gullies:
-
Extent of wind scoured, blowouts and/or depositional areas:
-
Amount of litter movement (describe size and distance expected to travel):
-
Soil surface (top few mm) resistance to erosion (stability values are averages - most sites will show a range of values):
-
Soil surface structure and SOM content (include type of structure and A-horizon color and thickness):
-
Effect of community phase composition (relative proportion of different functional groups) and spatial distribution on infiltration and runoff:
-
Presence and thickness of compaction layer (usually none; describe soil profile features which may be mistaken for compaction on this site):
-
Functional/Structural Groups (list in order of descending dominance by above-ground annual-production or live foliar cover using symbols: >>, >, = to indicate much greater than, greater than, and equal to):
Dominant:
Sub-dominant:
Other:
Additional:
-
Amount of plant mortality and decadence (include which functional groups are expected to show mortality or decadence):
-
Average percent litter cover (%) and depth ( in):
-
Expected annual annual-production (this is TOTAL above-ground annual-production, not just forage annual-production):
-
Potential invasive (including noxious) species (native and non-native). List species which BOTH characterize degraded states and have the potential to become a dominant or co-dominant species on the ecological site if their future establishment and growth is not actively controlled by management interventions. Species that become dominant for only one to several years (e.g., short-term response to drought or wildfire) are not invasive plants. Note that unlike other indicators, we are describing what is NOT expected in the reference state for the ecological site:
-
Perennial plant reproductive capability:
Print Options
Sections
Font
AAAAOther
PrintThe Ecosystem Dynamics Interpretive Tool is an information system framework developed by the USDA-ARS Jornada Experimental Range, USDA Natural Resources Conservation Service, and New Mexico State University.
Accessibility statement


