
Natural Resources
Conservation Service
Ecological site R084AY018OK
Deep Sand Savannah
Last updated: 9/21/2023
Accessed: 08/30/2026
-
Search


Major Land Resource Area or ecological site by name and/or ID.
PreviousSectionsNextGeneral information
Provisional. A provisional ecological site description has undergone quality control and quality assurance review. It contains a working state and transition model and enough information to identify the ecological site.
Click to explore map
Figure 1. Mapped extent
Areas shown in blue indicate the maximum mapped extent of this ecological site. Other ecological sites likely occur within the highlighted areas. It is also possible for this ecological site to occur outside of highlighted areas if detailed soil survey has not been completed or recently updated.
MLRA notes
Major Land Resource Area (MLRA): 084A–North Cross Timbers
MLRA 84A “North Cross Timbers” is characterized by rolling to hilly uplands with oak trees, bedrock outcrops, and narrow stream valleys. It is believed that the Cross Timbers ecosystem is one the least disturbed forest types remaining in the Eastern US. Major rivers in this MLRA include the Verdigris River in Kansas and the Arkansas, Cimarron, and South Canadian Rivers in Oklahoma. The western parts of this MLRA are underlain by sandstone and shale of Permian age, while the eastern parts are underlain by sandstone and shale of Pennsylvanian age. There are also occurrences of Pleistocene age stream terraces along the rivers.
Classification relationships
This ecological site is correlated to soil components at the Major Land Resource Area (MLRA) level which is further described in USDA Ag Handbook 296.
Level IV EPA Ecoregions 27o “Crosstimbers Transition”, 29a “Northern Crosstimbers”, and 29h “Northwestern Crosstimbers”.Ecological site concept
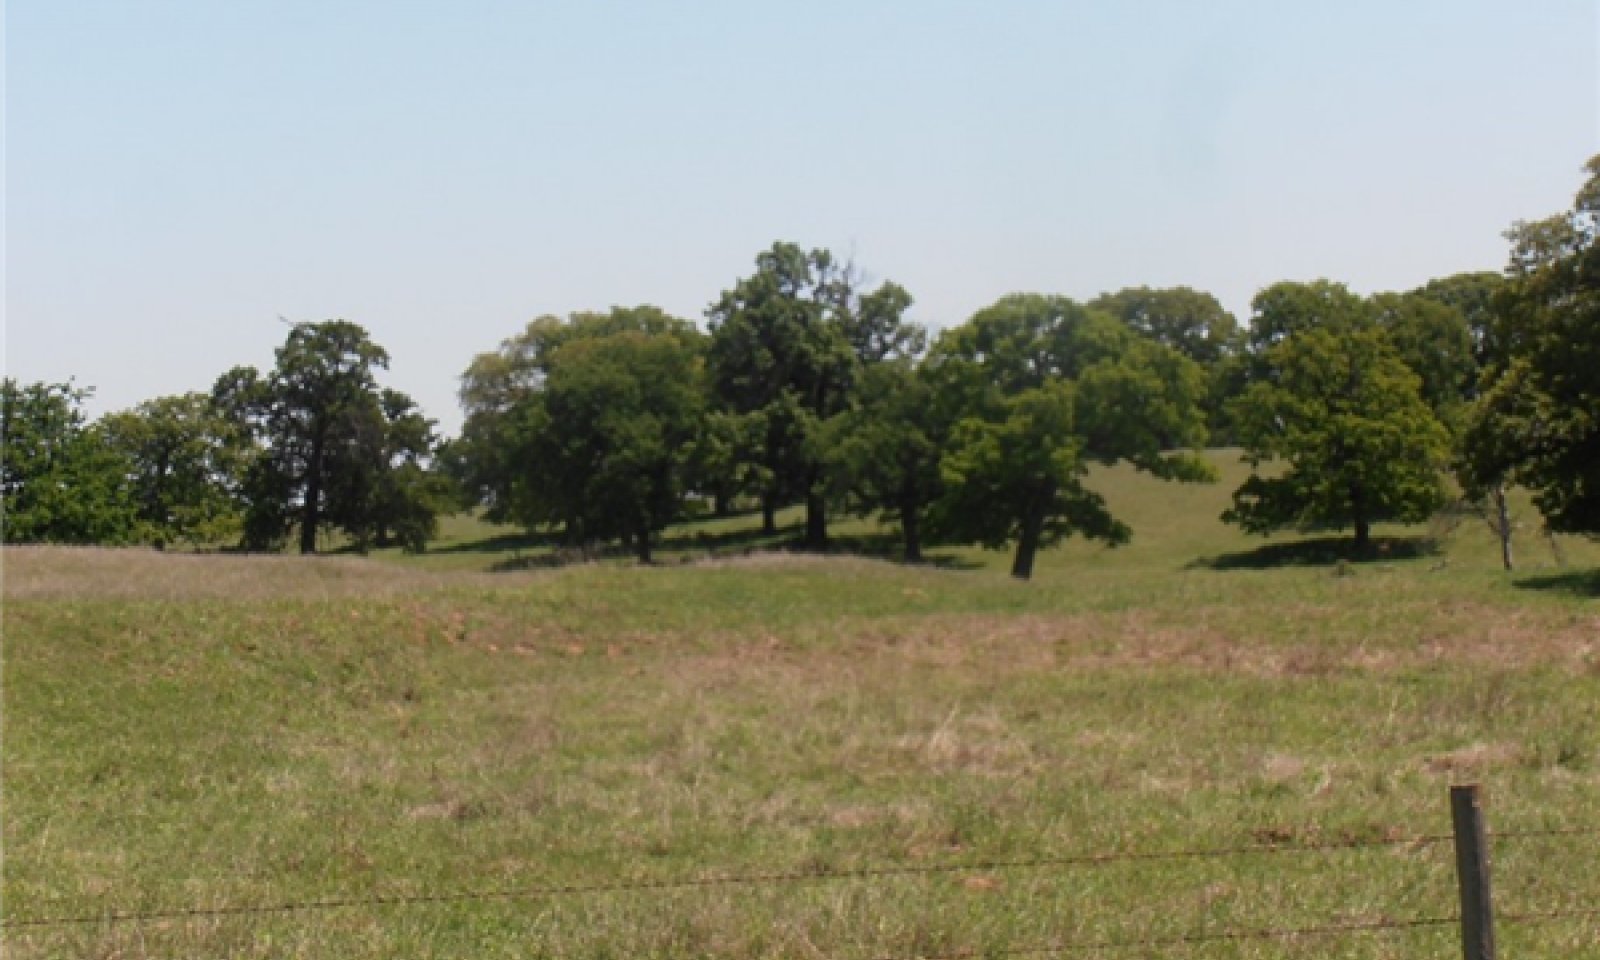
These sites occur over deep sandy eolian soils on stabilized dunes. The reference vegetation consists of native tallgrass and midgrass species such as sand bluestem and little bluestem. There is also an overstory of Post Oak and Blackjack Oak averaging 30 percent canopy, creating a savannah ecotype. This plant community is disturbance driven and requires periodic fire to maintain the savannah community. When fire is removed from the system, the site is at risk of encroachment of woody species and buildup of leaf litter, altering the plant community and driving it towards a woodland system with little understory production. The deep, coarse textured soils provide good moisture to plants during favorable precipitation. However, they are more susceptible to drought conditions.
Associated sites
R084AY075OK Sandy Loam Savannah
Higher landscape positions. Soils are more shallow. Similar vegetation and site characteristics.
Similar sites
R084AY075OK Sandy Loam Savannah
Higher landscape positions. Soils are more shallow. Similar vegetation and site characteristics.
Table 1. Dominant plant species
Tree (1) Quercus stellata
(2) Quercus marilandicaShrub (1) Rhus glabra
(2) Prunus angustifoliaHerbaceous (1) Andropogon hallii
(2) Schizachyrium scopariumPhysiographic features
These sites are on stabilized dunes on reworked stream terraces in the Cross Timbers (MLRA 84A). Slopes are dominantly 0 to 8 percent, but range to 20 percent.

Figure 2. DSS84A
Table 2. Representative physiographic features
Landforms (1) Alluvial plain remnant > Terrace
(2) Alluvial plain remnant > Dune
Runoff class Negligible to medium Elevation 700 – 1400 ft Slope 1 – 20 % Aspect Aspect is not a significant factor Climatic features
Climate is moist sub-humid with annual precipitation ranging from 30 to 45 inches. There will be noticeable differences in precipitation and temperatures from north to south and east to west. The most intense rainfall occurs in late spring and early summer while warm season vegetation is growing rapidly. Frost free and freeze free days increase from north to south. Precipitation increases from west to east.
Table 3 Representative climatic features
Frost-free period (characteristic range) 180-190 days Freeze-free period (characteristic range) 200-210 days Precipitation total (characteristic range) 30-40 in Frost-free period (actual range) 170-190 days Freeze-free period (actual range) 190-210 days Precipitation total (actual range) 30-40 in Frost-free period (average) 180 days Freeze-free period (average) 200 days Precipitation total (average) 40 in Characteristic rangeActual rangeBarLineFigure 3. Monthly precipitation range
Characteristic rangeActual rangeBarLineFigure 4. Monthly minimum temperature range
Characteristic rangeActual rangeBarLineFigure 5. Monthly maximum temperature range
BarLineFigure 6. Monthly average minimum and maximum temperature
Figure 7. Annual precipitation pattern
Figure 8 Annual average temperature pattern
Climate stations used
-
(1) ADA [USC00340017], Ada, OK
-
(2) CHICKASHA EXP STATION [USC00341750], Chickasha, OK
-
(3) ANADARKO 3 E [USC00340224], Anadarko, OK
-
(4) KINGFISHER [USC00344861], Kingfisher, OK
-
(5) GREAT SALT PLAINS DAM [USC00343740], Jet, OK
">Influencing water features
These upland sites are not associated with any riparian or wetland system.
Wetland description
NA

Figure 9.
Soil features
Representative soil components for this site include:
Derby, Dougherty, Eufaula, and Goodnight
These soils consists of very deep, well drained soils that formed in sandy and loamy sediments on terraces of Pleistocene age. They typically have rapid infiltration but can dry out quickly.
Soils are mapped for each county within the MLRA. Mapunits are representations of the major soil series component(s) and named accordingly. Each Mapunit is spatially represented on a digital soils map as polygons of different shapes and sizes. Within these Mapunits, there are often minor soil series components included. These minor components are soils that occur within a Mapunit polygon but are of small extent (15% or less of the Mapunit area). However, it is difficult to separate these minor soils spatially due to the scale of soil mapping.
Ecological sites are correlated at the component level of the soil survey. Therefore, a single Mapunit may contain multiple Ecological Sites just as it may contain multiple soil components. This is important to understand when investigating soils and Ecological Sites. A soil survey Mapunit may be correlated to a single Ecological Site based on the major component; however, there may be inclusional areas of additional Ecological Sites which are correlated to the minor components of that particular soil Mapunit.Table 4. Representative soil features
Parent material (1) Eolian sands – sandstone
Surface texture (1) Fine sand
(2) Loamy fine sand
(3) Loamy sand
Drainage class Well drained to somewhat excessively drained Permeability class Moderate to rapid Soil depth 60 – 0 in Surface fragment cover <=3" 0 – 1 % Surface fragment cover >3" 0 – 1 % Available water capacity
(0-40in)3 – 6 in Electrical conductivity
(0-40in)Not specified Sodium adsorption ratio
(0-40in)Not specified Soil reaction (1:1 water)
(0-40in)5 – 7.5 Subsurface fragment volume <=3"
(Depth not specified)0 – 1 % Subsurface fragment volume >3"
(Depth not specified)0 – 1 % Table 5. Representative soil features (actual values)
Drainage class Not specified Permeability class Not specified Soil depth 0 in Surface fragment cover <=3" 0 % Surface fragment cover >3" 0 % Available water capacity
(0-40in)3 – 10 in Electrical conductivity
(0-40in)0 mmhos/cm Sodium adsorption ratio
(0-40in)0 Soil reaction (1:1 water)
(0-40in)0 Subsurface fragment volume <=3"
(Depth not specified)0 % Subsurface fragment volume >3"
(Depth not specified)0 % Ecological dynamics
The reference community of the Deep Sand Savannah ecological site is a tallgrass savannah and with a disturbance driven plant community. Native tallgrasses compose the majority of the herbaceous plant community. Cool season grasses and grass likes are a minor component. Numerous perennial forbs are present.
The average fire return intervals for maintaining the reference state have been estimated between 3 to 5 years(Frost 1998). This fire return keeps the fire-intolerant species restricted to areas protected from fire (i.e. rock outcrops, etc.) allowing the plant community to remain dominated by fire-tolerant species such as Post Oak, Blackjack Oak, and many herbaceous species endemic to the tallgrass prairie ecosystem. This herbaceous community allows for positive infiltration and nutrient cycling.
Long term abusive grazing by domestic animals, primarily cattle or horses, usually results in a decrease of the tallgrasses and more palatable midgrasses, forbs, and legumes. These plants are gradually replaced by less palatable plants for domestic grazing stock, but not necessarily less desirable plants for other management goals. Without periodic burning, woody plants gradually thicken, and leaf litter accumulates, further reducing the amount of herbaceous vegetation in the understory.
The removal of fire will change the ecosystem dynamics. On some savannah locations, tree canopies and creeping vines such as greenbriar have thickened to the point that only sparse amounts of shade tolerant herbaceous plants remain in the understory. In other areas, eastern redcedar has invaded the site. Eastern redcedar can form an understory component of varying heights and density and can easily dominate a site once the overstory canopy is removed. Aside from crowding out herbaceous species, these volatile trees and vines may act as “ladder fuels” because of their growth form. When fire is once again introduced onto the landscape either by wildfire or prescribed fire, these trees can “ladder” the fire from surface level into the tree canopies causing a dangerous crown fire.
The plant species in the reference state allow for good water infiltration into the rapidly permeable soils of the site. As the woody canopy increases and the site transitions to the woody invasion state, the hydrology of the site is altered. The increased canopy intercepts most of the precipitation and leads to evaporative losses. Therefore, the remaining understory species have less available water for growth. However, with increased canopy and shading, understory species may have less evapotranspiration losses due to the altered micro-climate.
State and Transition Diagram:
A State and Transition Diagram for the Deep Sand Savannah (R084AY018OK) is depicted below. Thorough descriptions of each state, transition, and pathway follow the model. Experts base this model on available experimental research, field observations, professional consensus, and interpretations. It is likely to change as knowledge increases.
Plant communities will differ across the MLRA because of the natural variability in weather, soils, and aspect. The Reference Plant Community is not necessarily the management goal; other vegetative states may be desired plant communities as long as the Range Health assessments are in the moderate and above category.
The biological processes on this site are complex. Therefore, representative values are presented in a land management context. The species lists are representative and are not botanical descriptions of all species occurring, or potentially occurring, on this site. They are not intended to cover every situation or the full range of conditions, species, and responses for the site.
Composition by dry weight and percent canopy cover are provided to describe the functional groups. Most observers find it easier to visualize or estimate percent canopy for woody species (trees and shrubs).
The following diagram suggests some pathways that the vegetation on this site might take. There may be other states not shown on the diagram. This information is intended to show what might happen in a given set of circumstances. It does not mean that this would happen the same way in every instance. Local professional guidance should always be sought before pursuing a treatment scenario.State and transition model
More interactive model formats are also available. View Interactive Models
Click on state and transition labels to scroll to the respective textEcosystem states
T1A - No fire, No brush management T1C - Cultivation, Seeding R2A - Selective Thinning, Prescribed Burning T4A - Soil Erosion State 1 submodel, plant communities
State 2 submodel, plant communities
State 3 submodel, plant communities
State 1
SavannahThis is the reference or diagnostic community for the site. The description is based on early range site descriptions, clipping data, professional consensus of experienced range specialists, and analysis of field work.
Characteristics and indicators. This ecological state consists of native grasses and forbs with a scattered mosaic overstory of Oak trees. The total canopy coverage of tree species is typically 10-30%. Herbaceous community is dominated by sand bluestem and little bluestem.
Resilience management. This reference ecological state has evolved through periods of drought, fire, and grazing. Changes in the frequency and severity of these disturbances have altered the plant communities on many sites.
Dominant plant species
-
post oak (Quercus stellata), tree
-
blackjack oak (Quercus marilandica), tree
-
skunkbush sumac (Rhus trilobata), shrub
-
sand bluestem (Andropogon hallii), grass
-
little bluestem (Schizachyrium scoparium), grass
-
annual buckwheat (Eriogonum annuum), other herbaceous
Community 1.1
Tallgrass Savannah (Reference Community)
This plant community is the representative plant community for this site. The major plants are tallgrasses with a scattered overstory of trees. Big bluestem, Little bluestem, Indiangrass and switchgrass are the dominant grasses. Secondary grasses include purpletop, sand lovegrass, sand dropseed, and Canada wildrye. Post oak, blackjack oak and various hickory species are the major trees. These trees form an overstory canopy averaging 10 to 30% percent across the landscape. This site supports a large number of forbs and legumes that make up the balance of the plant community in various species amounts. Major legumes include leadplant, Virginia tephrosia, and native lespedezas. More abundant forbs are Maximillian sunflower, hairy sunflower, fringeleaf ruellia, dayflower, and several species of goldenrod. Over the years this plant community was maintained by periodic fires and herbivory.
The following plant list and production data will be reviewed and amended as necessary throughout this ecological site project as more data is collected and historical data is validated.
Resilience management. This community can be maintained with proper grazing management and periodic fire at a return interval of less than five years.
Figure 10. Annual production by plant type (representative values) or group (midpoint values)
Table 6. Annual production by plant type
Plant type Low
(lb/acre)Representative value
(lb/acre)High
(lb/acre)Grass/Grasslike 1780 2535 3100 Tree 590 790 890 Forb 230 325 420 Shrub/Vine 100 150 190 Total 2700 3800 4600 Figure 11. Plant community growth curve (percent production by month). OK0003 , Warm season tallgrasses, forbs, and a few woody species.
Jan Feb Mar Apr May Jun Jul Aug Sep Oct Nov Dec J F M A M J J A S O N D 0 2 6 9 21 24 14 6 11 4 2 1 Community 1.2
Midgrass Savannah
Within this community phase, the more palatable tallgrasses and forbs have decreased. They have been replaced by species such as tall dropseed, silver bluestem, and sideoats grama. The less palatable annual forbs, such as broomweed and western ragweed have increased also. Total herbacious production may remain the same as the reference community, however, the composition has been altered significantly.
Resilience management. As long as fire or alternative brush management is continued, this community may persist.
Pathway 1.1A
Community 1.1 to 1.2
Tallgrass Savannah (Reference Community)
Midgrass SavannahContinuously grazing above carrying capacity without adequate rest may push the plant community to 1.2 Midgrass Savannah. This pathway may also lead to a reduction in fuel which could also negatively impact the effectiveness of prescribed fire.
Pathway 1.2
Community 1.2 to 1.1
Midgrass Savannah
Tallgrass Savannah (Reference Community)With adequate growing season rest from grazing, the plant community may begin to shift back to phase 1.1. The length of grazing deferment is dependent upon severity of previous grazing events and precipitation patterns.
State 2
WoodlandThis vegetative state is composed of an overstory of trees and shrubs that will slowly eliminate most herbaceous vegetation from the plant community if left unchecked.
Characteristics and indicators. The major species are post oak and black jack oak elm and hackberry. Litter has increased due to increased leaf production and often exceeds one inch deep. Herbaceous plants are sparse and limited to shade tolerant species.
Resilience management. There is a high potential for encroachment by eastern redcedar in this ecological state if proper management is not applied. The longer the time since fire, the more mesophication occurs. This process can further hinder restoration to the reference state.
Dominant plant species
-
post oak (Quercus stellata), tree
-
blackjack oak (Quercus marilandica), tree
-
sugarberry (Celtis laevigata), tree
-
American elm (Ulmus americana), tree
-
winged sumac (Rhus copallinum), shrub
-
skunkbush sumac (Rhus trilobata), shrub
-
Chickasaw plum (Prunus angustifolia), shrub
-
sedge (Carex), grass
-
Canada wildrye (Elymus canadensis), grass
-
purpletop tridens (Tridens flavus), grass
Community 2.1
Tree/Shrub DominantThis plant community is composed of a moderately closed tree canopy with an understory of tallgrasses and midgrasses. The absence of fire has allowed post oak and blackjack oak to increase in abundance. The overstory tree canopy is closing and now ranges from 50 to 70 percent. The shading and competition for moisture from trees has resulted in a decrease in herbaceous understory plants. Little bluestem is now the dominant grass. Other grasses include big bluestem, Indiangrass, switchgrass, purpletop, purple lovegrass, Scribner’s panicum, Texas bluegrass and Canada wildrye. More abundant legumes are lespedezas, tickclovers, prairieclovers, trailing wildbean and American deervetch. Hairy sunflower, Fendler’s aster, wildbuckwheats, fleabanes and goldenrods are the more common forbs. Shrub species such as buckbrush, smooth sumac, greenbrier, dewberry and vines including poison ivy and Carolina snailseed are common in the understory.
To restore the site to near historic conditions would require an extended plan of proper grazing and prescribed burning. Some mechanical or chemical brush control may be needed to facilitate the process.Community 2.2
Closed Canopy WoodlandThis plant community is characterized by oak trees closing the overstory canopy to 70 to 85 percent. Understory vegetation production is greatly reduced and composed almost entirely of shade tolerant grasses, forbs, shrubs and vines. Post oak and blackjack oak are the dominant species. Grasses and grasslike plants are sparse and include Scribner’s panicum, Virginia wildrye, sedges, nimblewill muhly, fringeleaf paspalum, little bluestem, broomsedge bluestem and purpletop. Major forbs include goldenrods, pussytoes, fendler’s aster, blackeyed susan, snake cotton and showy partridgepea. Woody plants in the understory include greenbrier, buckbrush, dewberry, beautyberry, eastern redcedar and chittamwood. Eastern redcedar is beginning to seriously invade the open areas of the savannah.
Forage production for cattle grazing is very limited. Deer, turkey and small mammals utilize this site for cover and will benefit seasonally from acorn and berry production.
To restore this community to near historic conditions requires a management plan including herbicide or mechanical brush control treatments, accompanied by a prescribed burning and prescribed grazing. When heavy stands of eastern redcedar or greenbrier occur in the understory a combination of control treatments is required. When the oaks are controlled with herbicides, cedar and greenbrier are released and flourish unless other control measures are employed. As redcedar reaches a height of six feet or more, control usually requires some form of mechanical means. Cedar, six feet or less in height, can often be controlled with fire. In most situations remnant tallgrasses and midgrasses are present in sufficient numbers to provide recovery following brush control treatment. Grazing deferment immediately following treatment application is essential to assure recovery of the desired plants.Pathway 2.1A
Community 2.1 to 2.2Without fire or brush management, the woody species will continue to encroach, resulting in a shift to community phase 2.2.
Pathway 2.2A
Community 2.2 to 2.1Implementation of prescribed fire or brush management can reduce the woody species canopy and shift the plant community back towards 2.1.
State 3
ConvertedThis state is the result of a change in land use. Native vegetation has been tilled and crops or introduced perennial vegetation has been planted.
Characteristics and indicators. This state is often planted to weeping lovegrass or bermudagrass.
Resilience management. Sites in this state are often maintained as open pasture through mechanical or chemical brush management. Without these measures, woody species may encroach on the site.
Dominant plant species
-
Bermudagrass (Cynodon dactylon), grass
-
weeping lovegrass (Eragrostis curvula), grass
Community 3.1
Cropland/Tame PastureThe deep sand savannah site can support a variety of introduced grasses and commodity crops. Through land clearing and tillage these sight may be quite productive crop or pasture fields. As with any tillage system, proper precaution should be taken to limit soil erosion.
State 4
ErodedThis state is the result of wind erosion over bare soil. These areas are often referred to as blowouts.
Characteristics and indicators. Most of the "A" horizon of the soil profile has been displaced.
Resilience management. The remaining subsoil is very low in fertility. Some native grasses and forbs will persist in this state, however, production is greatly reduced.
Dominant plant species
-
threeawn (Aristida), grass
Transition T1A
State 1 to 2If fire is removed from the ecosystem, woody species may encroach and begin to dominate the ecological processes on the site. These processes include the water and nutrient cycling and energy flow. Once this occurs, the site has transitioned to the woodland state.
Constraints to recovery.The threshold for this transition is estimated to occur as the woody species increase beyond 40% canopy cover. Common woody invaders include Eastern Redcedar, Hackberry, and Elm. The longer the time since fire, the more mesophication occurs. This process can further hinder restoration to the reference state.
Key drivers
-
Fire
-
Fire frequency
Key ecosystem services affected
-
Nutrient cycling
Transition T1C
State 1 to 3These sites were sometimes cleared and cultivated by homesteaders in the early 20th century. Once the site is cultivated, soil properties are altered and it transitions to the converted state. These alterations affect soil hydrology, chemistry and biota.
Constraints to recovery.Some may still be in cultivation. However, many have been replanted to bermudagrass or weeping lovegrass for pasture use. Although many communities are quite resilient to disturbance, mechanical soil disturbance greatly alters soil structure, chemistry and biology. Returning to the pre-cultivation state may not be feasible for a long period of time.
Key drivers
-
Mechanical soil disturbance
-
Seeding
Key ecosystem services affected
-
Nutrient cycling
-
Wildlife habitat
-
Plant biodiversity
Restoration pathway R2A
State 2 to 1Implementing a brush management plan that includes mechanical thinning and the use of prescribed fire can restore the woodland state to an open canopy savannah state. This removal of woody canopy can allow for the restoration of the hydrology, energy and nutrient flow of the reference state.
Conservation practices
Brush Management Prescribed Burning Prescribed Grazing Transition T4A
State 3 to 4If this ecological site is subjected to soil disturbances such as land clearing, ripping, or plowing that leave large amounts of exposed soil, the site may become very susceptible to water erosion.
Constraints to recovery.Once the "A" horizon has been displace through erosion, this site has transitioned to an Eroded Sate.
Key drivers
-
Mechanical soil disturbance
Key ecosystem services affected
-
Erosion control
-
Nutrient cycling
-
Wildlife habitat
Additional community tables
Table 7. Community 1.1 plant community composition
Group Common name Symbol Scientific name Annual production () Foliar cover (%) Grass/Grasslike1 Tallgrasses 715–1400 sand bluestem ANHA Andropogon hallii 670–1130 – Indiangrass SONU2 Sorghastrum nutans 110–190 – switchgrass PAVI2 Panicum virgatum 75–125 – 2 Little Bluestem 740–1260 little bluestem SCSC Schizachyrium scoparium 740–1260 – 3 Mid/Shortgrasses 250–430 sand lovegrass ERTR3 Eragrostis trichodes 75–125 – dropseed SPORO Sporobolus 60–100 – purpletop tridens TRFL2 Tridens flavus 35–65 – beaked panicgrass PAAN Panicum anceps 35–65 – tufted lovegrass ERPEP2 Eragrostis pectinacea var. pectinacea 35–65 – Scribner's rosette grass DIOLS Dichanthelium oligosanthes var. scribnerianum 35–65 – hairy grama BOHI2 Bouteloua hirsuta 35–65 – Canada wildrye ELCA4 Elymus canadensis 0–53 – cylinder jointtail grass COCY Coelorachis cylindrica 25–40 – splitbeard bluestem ANTE2 Andropogon ternarius 15–25 – broomsedge bluestem ANVI2 Andropogon virginicus 15–25 – purple threeawn ARPU9 Aristida purpurea 15–25 – gummy lovegrass ERCU Eragrostis curtipedicellata 15–25 – red lovegrass ERSE Eragrostis secundiflora 15–25 – tumble lovegrass ERSE2 Eragrostis sessilispica 15–25 – hairawn muhly MUCA2 Muhlenbergia capillaris 15–25 – 4 Cool-Season Grasses 185–440 Virginia wildrye ELVI3 Elymus virginicus 115–190 – Texas bluegrass POAR Poa arachnifera 75–125 – Canada wildrye ELCA4 Elymus canadensis 75–125 – sedge CAREX Carex 35–75 – Scribner's rosette grass DIOLS Dichanthelium oligosanthes var. scribnerianum 35–75 – flatsedge CYPER Cyperus 35–65 – 5 Other Grasses 7–15 nimblewill MUSC Muhlenbergia schreberi 7–15 – Forb6 Forbs 260–450 Maximilian sunflower HEMA2 Helianthus maximiliani 70–130 – stiff sunflower HEPA19 Helianthus pauciflorus 35–65 – hairy sunflower HEHI2 Helianthus hirsutus 35–65 – button eryngo ERYU Eryngium yuccifolium 20–40 – Carruth's sagewort ARCA14 Artemisia carruthii 20–40 – white sagebrush ARLU Artemisia ludoviciana 20–40 – butterfly milkweed ASTU Asclepias tuberosa 20–40 – Virginia dayflower COVI3 Commelina virginica 20–40 – pale purple coneflower ECPA Echinacea pallida 20–40 – shiny goldenrod OLNI Oligoneuron nitidum 20–40 – stiff goldenrod OLRI Oligoneuron rigidum 20–40 – cobaea beardtongue PECO4 Penstemon cobaea 20–40 – queen's-delight STSY Stillingia sylvatica 20–40 – aromatic aster SYOB Symphyotrichum oblongifolium 20–40 – prairie spiderwort TROC Tradescantia occidentalis 20–40 – tenfinger menodora MEDE Menodora decemfida 20–40 – bush morning-glory IPLE Ipomoea leptophylla 20–40 – fringeleaf wild petunia RUHU Ruellia humilis 20–40 – pitcher sage SAAZG Salvia azurea var. grandiflora 20–40 – Texas vervain VEHA Verbena halei 15–25 – hoary verbena VEST Verbena stricta 15–25 – Cuman ragweed AMPS Ambrosia psilostachya 15–25 – pussytoes ANTEN Antennaria 15–25 – Arkansas dozedaisy APSK Aphanostephus skirrhobasis 7–13 – Virginia threeseed mercury ACVI Acalypha virginica 7–13 – Drummond's snakecotton FRDR Froelichia drummondii 7–13 – plains snakecotton FRFLC Froelichia floridana var. campestris 7–13 – lanceleaf blanketflower GAAEA Gaillardia aestivalis var. aestivalis 7–13 – southwestern bedstraw GAVI Galium virgatum 7–13 – Carolina geranium GECA5 Geranium carolinianum 7–13 – spotted sandmat CHMA15 Chamaesyce maculata 7–13 – heartsepal buckwheat ERMU4 Eriogonum multiflorum 7–13 – redroot buckwheat ERRA3 Eriogonum racemosum 7–13 – prairie fleabane ERST3 Erigeron strigosus 7–13 – redwhisker clammyweed PODO3 Polanisia dodecandra 7–13 – blackeyed Susan RUHI2 Rudbeckia hirta 7–13 – standing-cypress IPRU2 Ipomopsis rubra 7–13 – hairy pinweed LEMU3 Lechea mucronata 7–13 – turk's-cap lily LISU Lilium superbum 7–13 – fourpoint evening primrose OERH Oenothera rhombipetala 7–13 – hairy hawkweed HILO2 Hieracium longipilum 7–13 – Texas star SACA3 Sabatia campestris 7–13 – 7 Legumes 110–200 roundhead lespedeza LECA8 Lespedeza capitata 35–65 – white prairie clover DACA7 Dalea candida 35–65 – purple prairie clover DAPUP Dalea purpurea var. purpurea 35–65 – Illinois bundleflower DEIL Desmanthus illinoensis 35–65 – tall lespedeza LEST5 Lespedeza stuevei 35–65 – slender lespedeza LEVI7 Lespedeza virginica 35–65 – prairie acacia ACAN Acacia angustissima 35–65 – Virginia tephrosia TEVI Tephrosia virginiana 35–65 – slimflower scurfpea PSTE5 Psoralidium tenuiflorum 20–40 – Illinois ticktrefoil DEIL2 Desmodium illinoense 20–40 – sessileleaf ticktrefoil DESE Desmodium sessilifolium 20–40 – New Jersey tea CEAM Ceanothus americanus 0–33 – plum PRUNU Prunus 0–33 – sumac RHUS Rhus 0–33 – roundleaf snowberry SYRO Symphoricarpos rotundifolius 0–33 – blackberry RUBUS Rubus 0–25 – eastern milkpea GARE2 Galactia regularis 15–25 – trailing lespedeza LEPR Lespedeza procumbens 15–25 – Maryland senna SEMA11 Senna marilandica 15–25 – yellow puff NELU2 Neptunia lutea 15–25 – dwarf chinquapin oak QUPR Quercus prinoides 0–23 – partridge pea CHFA2 Chamaecrista fasciculata 7–13 – Shrub/Vine8 Shrubs 100–200 eastern redbud CECA4 Cercis canadensis 0–150 – American beautyberry CAAM2 Callicarpa americana 50–100 – Virginia creeper PAQU2 Parthenocissus quinquefolia 50–100 – winged sumac RHCO Rhus copallinum 50–100 – smooth sumac RHGL Rhus glabra 50–100 – skunkbush sumac RHTR Rhus trilobata 50–100 – Carolina rose ROCA4 Rosa carolina 50–100 – southern dewberry RUTR Rubus trivialis 50–100 – greenbrier SMILA2 Smilax 50–100 – western poison ivy TORY Toxicodendron rydbergii 50–100 – grape VITIS Vitis 50–100 – coralberry SYOR Symphoricarpos orbiculatus 50–100 – Tree9 Trees 650–950 post oak QUST Quercus stellata 460–670 – blackjack oak QUMA3 Quercus marilandica 153–225 – American elm ULAM Ulmus americana 23–35 – Oklahoma plum PRGR Prunus gracilis 23–35 – black hickory CATE9 Carya texana 23–35 – common hackberry CEOC Celtis occidentalis 23–35 – eastern redcedar JUVI Juniperus virginiana 15–25 – Table 8. Community 1.2 plant community composition
Group Common name Symbol Scientific name Annual production () Foliar cover (%) Table 9. Community 2.1 plant community composition
Group Common name Symbol Scientific name Annual production () Foliar cover (%) Table 10. Community 2.2 plant community composition
Group Common name Symbol Scientific name Annual production () Foliar cover (%) Table 11. Community 3.1 plant community composition
Group Common name Symbol Scientific name Annual production () Foliar cover (%) Interpretations
Animal community
This plant community has value for grazing cattle. It also provides cover and food for many species of wildlife including whitetail deer, turkey and bobwhite quail. Coyote, red fox, squirrel, cottontail rabbit, opossum and raccoon are common. Numerous song birds and woodpeckers are found on the site.
Hydrological functions
These upland site may shed some water via runoff during heavy rain events. The presence of good ground cover and deep rooted grasses can help facilitate infiltration and reduce sediment loss. Reduction in ground cover can lead to increased sediment loss during heavy rain events.
Recreational uses
Deep Sand Savannah sites offer scenic opportunities for outdoor recreation including photography, trail rides, camping, and hunting.
Wood products
Wood products include firewood, fence posts and cedar products (mulch and lumber).
Other products
NA
Other information
NA
Supporting information
Inventory data references
Clipping data and other observations on file in the Oklahoma NRCS State Office: Suite 206 100 USDA Stillwater, Oklahoma 74074 The original information presented here was derived from field observations of Dr. Jack Eckroat, in the summer of 2007, correlated to office files and old Rangesite Technical Descriptions (1961 USDA/SCS). Species compositions are as complete as possible. Production will vary by species from within years, from year to year, and from site to site.
Type locality
Location 1: Payne County, OK General legal description Payne County, Oklahoma; about 3 miles west and 3 miles south of Yale; 2,200 feet south and 200 feet west of the northeast corner of sec. 3, T. 18 N., R. 5 E References
-
Bestelmeyer, B., J.R. Brown, K.M. Havstad, B. Alexander, G. Chavez, and J.E. Herrick. 2003. Development and Use of State and Transition Models for Rangelands. Jornal of Range Management 56:114–126.
-
Fuhlendorf, S.D., D.M. Engle, J. Kerby, and R. Hamilton. 2009. Pyric Herbivory: Rewilding Landscapes through the Recoupling of Fire and Grazing. Conservation Biology 23:588–598.
Other references
Harlan, J. R. (1957). Grasslands of Oklahoma.
National Soil Information System (NASIS). Accessed 2013
Shantz, H. L. (1923). The natural vegetation of the Great Plains region. Annals of the Association of American Geographers, 13(2), 81-107.
Shiflet, T. N. (1994). Rangeland cover types of the United States (Vol. 152). Denver, CO, USA: Society for Range Management.
Soil Survey Staff, Natural Resources Conservation Service, United States Department of Agriculture. Web Soil Survey. Available online at http://websoilsurvey.nrcs.usda.gov/. Accessed [5/5/2014].
USDA NRCS Plants Database. Online.
USDA-SCS Oklahoma Range Site Descriptions(1960s)Contributors
Colin Walden, Soil Survey Region 9, Stillwater, OK
Dr. Jack Eckroat, Grazing Lands Specialist, NRCS, Oklahoma
Harland Dietz, Range Conservationist, NRCS, Oklahoma, (Retired)Approval
Bryan Christensen, 9/21/2023
Acknowledgments
Site Development and Testing Plan: Future work, as described in a Project Plan, to validate the information in this Provisional Ecological Site Description is needed. This will include field activities to collect low, medium and high intensity sampling, soil correlations, and analysis of that data. Annual field reviews should be done by soil scientists and vegetation specialists. A final field review, peer review, quality control, and quality assurance reviews of the ESD will be needed to produce the final document. Annual reviews of the Project Plan are to be conducted by the Ecological Site Technical Team.
Rangeland health reference sheet
Interpreting Indicators of Rangeland Health is a qualitative assessment protocol used to determine ecosystem condition based on benchmark characteristics described in the Reference Sheet. A suite of 17 (or more) indicators are typically considered in an assessment. The ecological site(s) representative of an assessment location must be known prior to applying the protocol and must be verified based on soils and climate. Current plant community cannot be used to identify the ecological site.
Author(s)/participant(s) Mark Moseley, Harry Fritzler, Steve Glasgow, Jack Eckroat, (CW Edits) Contact for lead author 100 USDA Suite 206 Stillwater, Oklahoma 74074 Date 04/01/2005 Approved by Approval date Composition (Indicators 10 and 12) based on Annual Production Indicators
-
Number and extent of rills:
There are none on this site due to high infiltration rates -
Presence of water flow patterns:
There are none on this site due to high infiltration rates. -
Number and height of erosional pedestals or terracettes:
There should not be any evidence of erosional pedestals or terracettes on this site. -
Bare ground from Ecological Site Description or other studies (rock, litter, lichen, moss, plant canopy are not bare ground):
There is some variability, but it should average less than 20% bare ground on this site. Bare areas are small and not connected. -
Number of gullies and erosion associated with gullies:
None, drainages are represented as natural stable channels; vegetation is common with no signs of erosion. -
Extent of wind scoured, blowouts and/or depositional areas:
None, because plants and litter block the wind. -
Amount of litter movement (describe size and distance expected to travel):
Very little movement due to water because of high infiltration. Twelve inches maximum, and only with strong storms. -
Soil surface (top few mm) resistance to erosion (stability values are averages - most sites will show a range of values):
Surface soil is moderately stabilized (Average Stability Score 4.5 or higher). Stability scores based on a minimum of 6 samples tested. -
Soil surface structure and SOM content (include type of structure and A-horizon color and thickness):
A horizon: 0 to 9 inches; brown fine sandy loam, weak fine granular structure. A2 horizon: 9 to 20 inches; light brown loamy fine sand, single grained; loose. *Refer to specific description for component sampled. -
Effect of community phase composition (relative proportion of different functional groups) and spatial distribution on infiltration and runoff:
Infiltration and runoff are not affected by any changes in plant community composition and distribution. (Tallgrass/Midgrass dominated with scattered trees/shrubs). -
Presence and thickness of compaction layer (usually none; describe soil profile features which may be mistaken for compaction on this site):
There is no compaction layer due to sandy soils. -
Functional/Structural Groups (list in order of descending dominance by above-ground annual-production or live foliar cover using symbols: >>, >, = to indicate much greater than, greater than, and equal to):
Dominant:
Tallgrasses, Tree, Little BluestemSub-dominant:
Midgrass, ShrubsOther:
Shortgrasses Forbs Cool-Season GrassesAdditional:
-
Amount of plant mortality and decadence (include which functional groups are expected to show mortality or decadence):
There is some plant mortality and decadence on the perennial grasses, especially in the absence of fire and herbivory, but usually <10%. -
Average percent litter cover (%) and depth ( in):
Litter should cover 50-75% of the area between plants with accumulations of <1/2 inch deep. -
Expected annual annual-production (this is TOTAL above-ground annual-production, not just forage annual-production):
Normal production is 3,000-5,000 pounds per year. -
Potential invasive (including noxious) species (native and non-native). List species which BOTH characterize degraded states and have the potential to become a dominant or co-dominant species on the ecological site if their future establishment and growth is not actively controlled by management interventions. Species that become dominant for only one to several years (e.g., short-term response to drought or wildfire) are not invasive plants. Note that unlike other indicators, we are describing what is NOT expected in the reference state for the ecological site:
No invasive species. Invasives might include: eastern redcedar, annuals and non-natives. -
Perennial plant reproductive capability:
All plants capable of reproducing at least every year.
Print Options
Sections
Font
AAAAOther
PrintThe Ecosystem Dynamics Interpretive Tool is an information system framework developed by the USDA-ARS Jornada Experimental Range, USDA Natural Resources Conservation Service, and New Mexico State University.
Accessibility statement


