
Natural Resources
Conservation Service
Ecological site R081CY359TX
Gravelly Redland
29-35 PZ
Last updated: 9/19/2023
Accessed: 08/17/2026
-
Search


Major Land Resource Area or ecological site by name and/or ID.
PreviousSectionsNextGeneral information
Provisional. A provisional ecological site description has undergone quality control and quality assurance review. It contains a working state and transition model and enough information to identify the ecological site.
Click to explore map
Figure 1. Mapped extent
Areas shown in blue indicate the maximum mapped extent of this ecological site. Other ecological sites likely occur within the highlighted areas. It is also possible for this ecological site to occur outside of highlighted areas if detailed soil survey has not been completed or recently updated.
MLRA notes
Major Land Resource Area (MLRA): 081C–Edwards Plateau, Eastern Part
This area represents the eastern part of the Edwards Plateau region. Limestone ridges and canyons and nearly level to gently sloping valley floors characterize the area. Elevation is 400 feet (120 meters) at the eastern end of the area and increases westward to 2,400 feet (730 meters) on ridges. This area is underlain primarily by limestones in the Glen Rose, Fort Terrett, and Edwards Formations of Cretaceous age. Quaternary alluvium is in river valleys.
Classification relationships
Major Land Resource Area (MLRA) and Land Resource Unit (LRU) (USDA-Natural Resources Conservation Service, 2006)
National Vegetation Classification/Shrubland & Grassland/2C Temperate & Boreal Shrubland and Grassland/M051 Great Plains Mixedgrass Prairie & Shrubland/ G133 Central Great Plains Mixedgrass Prairie Group.Ecological site concept
These upland sites occur on gravelly clay loam soils over limestone. Gravel content ranges up to 25 percent at the surface to 80 percent in the subsoil. Reference vegetation includes mid and tallgrasses with numerous forbs and scattered oaks. Without fire or other brush management, woody species are likely to increase on the site.
Associated sites
R081CY356TX Blackland 29-35 PZ
The Blackland ecological site has higher production and deeper soils.
R081CY355TX Adobe 29-35 PZ
The Adobe ecological site has less production, more slope, and more caliche type soils of a higher pH with no post oak or blackjack oak.
R081CY360TX Low Stony Hill 29-35 PZ
The Low Stony Hill ecological site is generally higher in the landscape and is the plateau above the Gravelly Redland ecological site with no post oak or blackjack oak.
Similar sites
R081CY361TX Redland 29-35 PZ
The Redland ecological site has deeper soils, less permeable and is more productive. There is typically post oak, blackjack oak, and live oak on the Redland ecological site as well as taller grasses.
Table 1. Dominant plant species
Tree (1) Quercus fusiformis
(2) Acacia greggiiShrub Not specified
Herbaceous (1) Schizachyrium scoparium
(2) Bouteloua curtipendulaPhysiographic features
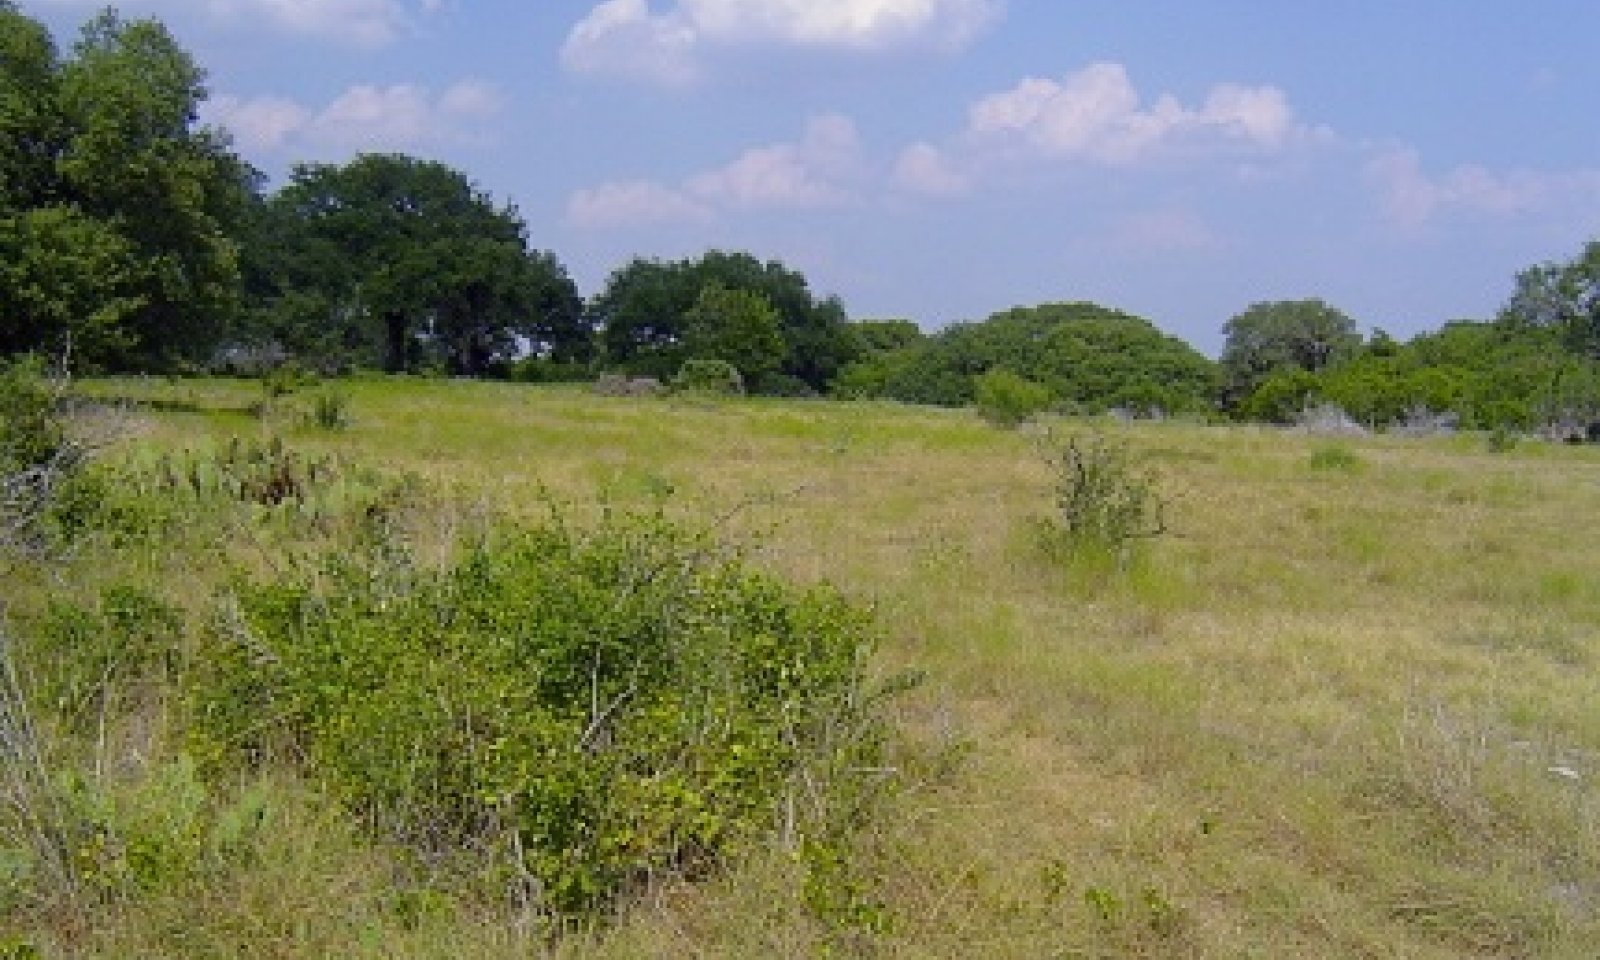
This site is located in the 81C, Eastern Edwards Plateau Major Land Resource Area (MLRA). Gravelly Redland is found on gently to moderately sloping plains and uplands. Slopes range from 1 to 8 percent. The site consists of moderately deep, well-drained, moderately slowly permeable soils formed in residuum and colluviums over indurated limestone bedrock. Due to the slopes, this site is susceptible to erosion. The elevation ranges from 800 feet to 2300 feet at this site. No flooding or ponding is expected. Low to very high run-off occurs on the Gravelly Redland.

Figure 2. Gravelly Redland 081CY359TX
Table 2. Representative physiographic features
Landforms (1) Plateau > Ridge
(2) Plateau > Plain
Runoff class Low to very high Flooding frequency None Ponding frequency None Elevation 800 – 2300 ft Slope 1 – 8 % Aspect Aspect is not a significant factor Climatic features
The climate is humid subtropical and is characterized by hot summers and relatively mild winters. The average first frost should occur around November 15 and the last freeze of the season should occur around March 19.
The average relative humidity in mid-afternoon is about 50 percent. Humidity is higher at night, and the average at dawn is about 80 percent. The sun shines 70 percent of the time possible during the summer and 50 percent in winter. The prevailing wind direction is southeast.
Drought is calculated as 75% below average rainfall. It should be noted that timing of rainfall may be more significant than average rainfall.
Approximately two-thirds of annual rainfall occurs during the April to September period. Rainfall during this period generally falls during thunderstorms, and fairly large amount of rain may fall in a short time. Hurricanes provide another source of extremely high rains in a short time. A review of the rainfall records suggest that rainfall is below “normal” at least 60 percent of the time. Therefore, the erratic nature of the rainfall should be considered when developing any land management plans.
The impact of droughts in the Edwards Plateau cannot be under-estimated. Not only are droughts devastating to the land but also to those that manage the land. Droughts occur roughly every 20 years but not always. A severe drought in 2012 coupled with extreme heat resulted in a die off of juniper over millions of acres as well as other native plants.Table 3 Representative climatic features
Frost-free period (characteristic range) 220-260 days Freeze-free period (characteristic range) 230-270 days Precipitation total (characteristic range) 30-40 in Frost-free period (actual range) 190-260 days Freeze-free period (actual range) 220-330 days Precipitation total (actual range) 30-40 in Frost-free period (average) 240 days Freeze-free period (average) 260 days Precipitation total (average) 30 in Characteristic rangeActual rangeBarLineFigure 3. Monthly precipitation range
Characteristic rangeActual rangeBarLineFigure 4. Monthly minimum temperature range
Characteristic rangeActual rangeBarLineFigure 5. Monthly maximum temperature range
BarLineFigure 6. Monthly average minimum and maximum temperature
Figure 7. Annual precipitation pattern
Figure 8 Annual average temperature pattern
Climate stations used
-
(1) MEDINA 1NE [USC00415742], Medina, TX
-
(2) SAN ANTONIO/SEAWORLD [USC00418169], San Antonio, TX
-
(3) KERRVILLE 3 NNE [USC00414782], Kerrville, TX
-
(4) BLANCO [USC00410832], Blanco, TX
-
(5) CANYON DAM [USC00411429], Canyon Lake, TX
-
(6) BURNET MUNI AP [USW00003999], Burnet, TX
-
(7) AUSTIN GREAT HILLS [USC00410433], Austin, TX
-
(8) GEORGETOWN LAKE [USC00413507], Georgetown, TX
-
(9) PRADE RCH [USC00417232], Leakey, TX
">Influencing water features
This being an upland site, it is not influenced by water from a wetland or stream.
Wetland description
N/A

Figure 9.
Soil features
In a representative profile for the Gravelly Redland ecological site, the surface layer is dark reddish-brown very gravelly clay loam about 5 inches thick. They are underlain by slightly fractured indurated limestone bedrock at depths of 20 to 40 inches. Rock fragments in the surface horizons are about 25 percent and up to 80 percent in the subsoil. There are gravelly to extremely gravelly texture modifiers throughout the soil profile. Because of the moderate slopes associated with Gravelly Redland, the site is well drained and has moderate runoff. The high gravel content in the subsurface horizons reduces the shrink-swell potential which causes the soil permeability to be moderately slow. When plant residues are inadequate, soil condition deteriorates and heavy surface crusts develop. In this condition water intake is very slow, runoff is rapid, erosion is a hazard, and grass recovery is slow. The mineral content and reaction of these soils enable the site to produce highly nutritious forage. In association with other sites, Gravelly Redland is usually the preferred grazing area. These sites occur on stable hillslopes on dissected plateaus.
Due to the scale of mapping, there are inclusions of minor components of other soils within these mapping units. Before performing any inventories, conduct a field evaluation to ensure the soils are correct for the site.
The representative soil series associated with the Gravelly Redland ecological site are Dina and Rumple.Table 4. Representative soil features
Parent material (1) Residuum – limestone
Surface texture (1) Very gravelly clay loam
(2) Cobbly silty clay loam
Drainage class Well drained Permeability class Moderately slow to slow Depth to restrictive layer 20 – 40 in Soil depth 20 – 40 in Surface fragment cover <=3" 5 – 20 % Surface fragment cover >3" 0 – 5 % Available water capacity
(0-40in)0.6 – 5.5 in Calcium carbonate equivalent
(0-40in)0 – 10 % Electrical conductivity
(0-40in)0 – 2 mmhos/cm Sodium adsorption ratio
(0-40in)Not specified Soil reaction (1:1 water)
(0-40in)5.6 – 8.4 Subsurface fragment volume <=3"
(4-40in)30 – 60 % Subsurface fragment volume >3"
(4-40in)5 – 20 % Ecological dynamics
The information contained in the State and Transition Diagram (STD) and the Ecological Site Description was developed using archeological and historical data, professional experience, and scientific studies. The information presented is representative of a very complex set of plant communities. Not all scenarios or plants are included. Key indicator plants, animals and ecological processes are described to inform land management decisions.
The pre-settlement or reference plant community is perceived as a prairie with mostly mid-grasses, associated forbs and scattered mottes of woody species; the Mixed-grass Prairie Community (1.1). The dominant grasses were little bluestem (Schizachyrium scoparium), sideoats grama (Bouteloua curtipendula), and feathery bluestems (Bothriochloa spp.). Big bluestem (Andropogon gerardii) and Indiangrass (Sorghastrum nutans) were scattered in small amounts in the wetter areas and inclusions of low stony hill soils. Velvet bundleflower (Desmanthus velutinus), Engelmann’s daisy (Engelmannia peristenia), gaura (Gaura spp.), western indigo (Indigofera miniata var. leptosepala), and blazing star (Liatris spp.) were some of many forbs found in the historic community. Shrubs included elbowbush (Forestiera pubescens) and catclaw acacia (Acacia greggii). The endemic woody plants historically shaded less than 10 percent of the soil surface, either as small mottes or individual trees that were either resistant to fire or occupied areas where fires were less frequent or intense. Texas live oak (Quercus fusiformis) was the most frequently occurring tree species.
Natural plant mortality is very low with the major species producing seeds and vegetative structure each year in normal years. Litter cover is 100 percent. Physical soil crust is largely absent.
A study of early photographs of this region reveals that today these sites are much denser with woody cover and less covered with grasslike vegetation. Early accounts consistently describe this region as a vast expanse of hills covered with "cedar" from San Antonio to Austin. Accounts also describe an abundance of clean, flowing water and abundant wildlife. These accounts seem to describe heavy wooded areas in mosaic patterns occurring along the highs and lows of the landscape.
The plant communities of this site are dynamic and vary in relation to grazing, fire, and rainfall. Studies of the pre-European vegetation of the general area suggested 47 percent of the area was wooded (Wills, 2006). Historical records are not specific on the Gravelly Redland site but do reflect area observations. From the Teran expedition in 1691, “great quantities of buffaloes” were noted in the area. By 1840 the Bonnell expedition reflected that “buffalo rarely range so far to the south” (Inglis, 1964). Another example is an early settler, Arnold Gugger, who wrote in his journal about the mid to late 1800s in the Helotes, Texas area, “in those days buffaloes were in droves by the hundreds…..and antelopes were three to four hundred in a bunch….and deer and turkeys at any amount” (Massey, 2009).
Many research studies document the interaction of bison grazing and fire (Fuhlendorf, et al., 2008.). Bison would come into an area, graze it down, leave and then not come back for many months or even years. Many times this grazing scheme by buffalo was high impact and followed fire patterns and available natural water. This usually long deferment period allowed the taller grasses and forbs to recover from the high impact bison grazing. This relationship created a diverse landscape both in structure and composition.
Historical fire frequencies for the region are suggested to be 13 to 25 years (Frost, 1998). When fires did occur, they were set either by Native Americans or by lighting. Woody plant control would vary in accordance with the intensity and severity of the fire encountered, which resulted in a mosaic of vegetation types within the same site.
Ashe juniper (Juniperus ashei) will increase regardless of grazing. Juniper will establish with grazing and without unless goats are utilized. Goats and probably sheep will eat young juniper and when properly used, are an effective tool to maintain juniper (Taylor, 1997; Anderson, et al., 2013). The main role of excessive grazing relative to juniper is the removal of the fine fuel needed to carry an effective burn.
Ashe juniper, because of its dense low growing foliage, has the ability to retard grass and forb growth. Grass and forb growth can become non-existent under dense juniper canopies. Many times there is a resurgence of the better grasses such as little bluestem when Ashe juniper is controlled and followed by proper grazing management. Seeds and dormant rootstocks of many plant species are contained in the leaf mulch and duff under the junipers.
Currently, cattle, goats, white-tailed deer, sheep, and exotic animals are the primary large herbivores. At settlement, large numbers of deer occurred, but as human populations increased (with unregulated harvest) their numbers declined substantially. Eventually, laws and restrictions on deer harvest were put in place which assisted in the recovery of the species. Females were not harvested for several decades following the implementation of hunting laws, which allowed population booms. In addition, suppression of fire favored woody plants which provided additional browse and cover for the deer. Because of their impacts on livestock production, large predators such as red wolves (Canis rufus), mountain lions (Felis concolor), black bears (Ursus americanus), and eventually coyotes (Canis latrins) were reduced in numbers or eliminated (Schmidly, 2002).
The screwworm fly (Cochilomyia hominivorax) was essentially eradicated by the mid-1960s, and while this was immensely helpful to the livestock industry, this removed a significant control on deer populations (Teer, Thomas, and Walker, 1965; Bushland, 1985).
Progressive management of the deer herd, because of their economic importance through lease hunting, has the objective of improving individual deer quality and improving habitat. Managed harvest based on numbers, sex ratios, condition, and monitoring of habitat quality has been effective on individual properties. However, across the Edwards Plateau, excess numbers still exist which may lead to habitat degradation and significant die-offs during stress periods such as extended droughts.
The Edwards Plateau is home to a variety of exotic ungulates, mostly introduced for hunting (Schmidly, 2002). These animals are important sources of income to some landowners, but as with the white-tailed deer, their populations must be managed to prevent degradation of the habitat for themselves as well as for the diversity of native wildlife in the area. Many other species of medium- and small-sized mammals, birds, and insects can have significant influences on the plant communities in terms of pollination, herbivory, seed dispersal, and creation of local disturbance patches, all of which contribute to the plant species diversity.
The plants and topography aided in increasing the infiltration of rainfall into the moderately slowly permeable soil. Any loss of soil organic matter and plant cover has a negative effect on infiltration. More rainfall is directed to overland flow, which causes increased soil erosion and flooding. Soils are also more prone to drought stress since organic matter acts like a sponge aiding in moisture retention for plant growth. Mulch buildup under the Ashe juniper canopy, following brush management and incorporation into the soil, can have a positive effect on increasing infiltration.
This site contains a large diversity of plants and this document does not attempt to cover them all. The intent of this document is to describe ecological processes on representative plants.
European settlement occurred in the mid to late 1800s (Raunick, 2007). This time period also coincided with a stoppage of fire. It was during this time that large-scale fencing was initiated to help the introduction of livestock. Predators were also reduced to protect livestock. In many cases sheep and goats heavily utilized the site. Low successional, unpalatable grasses, forbs, and shrubs have taken the place of the more desirable plant species. Non-preferred browse, such as juniper, fared well at the expense of the palatable browse. Juniper is undoubtedly the dominant woody plant over most of the site today.
Plant Communities and Transitional Pathways (diagram)
A State and Transition Diagram for the Gravelly Redland Ecological Site (R081CY359TX) is depicted in Figure 1. Descriptions of each state, transition, plant community, and pathway follow the model. Experts base this diagram on available experimental research, field observations, professional consensus, and interpretations. It is likely to change as knowledge increases.
Plant communities will differ across the MLRA because of the naturally occurring variability in weather, soils, and aspect. The Reference Plant Community is not necessarily the management goal. Other vegetative states may be desired plant communities as long as the Range Health assessments are in the moderate and above category. The biological processes on this site are complex. Therefore, representative values are presented in a land management context. The species lists are representative and are not botanical descriptions of all species occurring, or potentially occurring, on this site. They are not intended to cover every situation or the full range of conditions, species, and responses for the site.
Both percent species composition by weight and percent canopy cover are described as are other metrics. Most observers find it easier to visualize or estimate percent canopy for woody species (trees and shrubs). Canopy cover can drive the transitions between communities and states because of the influence of shade and interception of rainfall. Species composition by dry weight is used for describing the herbaceous community and the community as a whole. Woody species are included in species composition for the site. Calculating similarity index requires the use of species composition by dry weight.
The following diagram suggests some pathways that the vegetation on this site might take. There may be other states not shown in the diagram. This information is intended to show what might happen in a given set of circumstances. It does not mean that this would happen the same way in every instance. Local professional guidance should always be sought before pursuing a treatment scenario.State and transition model
More interactive model formats are also available. View Interactive Models
Click on state and transition labels to scroll to the respective textEcosystem states
T1A - Absence of disturbance and natural regeneration over time R2A - Reintroduction of natural disturbance regimes T2A - Ground disturbing brush management coupled with seeding non-native grasses State 1 submodel, plant communities
State 2 submodel, plant communities
State 3 submodel, plant communities
State 1
ReferenceThe reference state is considered to be representative of the range of variability under pre-Euro settlement conditions. It is characterized by an open stand of mid and tallgrasses with scattered trees and shrubs. Woody canopy ranges from 10 to 20%. Community phase changes are primarily driven by grazing, periodic fire and variations in the subtropical climate. Wildfires set either by Native peoples or lightning, occurred at 7 to 12 year intervals (Frost, 1998).
Dominant plant species
-
Texas live oak (Quercus fusiformis), tree
-
little bluestem (Schizachyrium scoparium), other herbaceous
-
sideoats grama (Bouteloua curtipendula), other herbaceous
Community 1.1
Mixed Grass Prairie CommunityThis is the diagnostic or reference plant community for the Gravelly Redland site. The metrics of the description of the reference plant community is derived from field observations, limited clipping data and professional consensus. The plant community is perceived as a prairie composed of mostly midgrasses with scattered tallgrasses, trees and shrubs. Vegetative composition by weight is estimated to be 80-87% grasses, 6-8% forbs, 4-6% shrubs, and 2-5% trees. Woody canopy cover is
Figure 10. Annual production by plant type (representative values) or group (midpoint values)
Table 5. Annual production by plant type
Plant type Low
(lb/acre)Representative value
(lb/acre)High
(lb/acre)Grass/Grasslike 1700 2550 3825 Shrub/Vine 100 150 225 Tree 100 150 225 Forb 100 150 225 Total 2000 3000 4500 Table 6. Soil surface cover
Tree basal cover 0-0% Shrub/vine/liana basal cover 0-0% Grass/grasslike basal cover 10-20% Forb basal cover 0-0% Non-vascular plants 0% Biological crusts 0% Litter 80-100% Surface fragments >0.25" and <=3" 0% Surface fragments >3" 10-20% Bedrock 0% Water 0% Bare ground 0-10% Table 7. Woody ground cover
Downed wood, fine-small (<0.40" diameter; 1-hour fuels) – Downed wood, fine-medium (0.40-0.99" diameter; 10-hour fuels) – Downed wood, fine-large (1.00-2.99" diameter; 100-hour fuels) – Downed wood, coarse-small (3.00-8.99" diameter; 1,000-hour fuels) – Downed wood, coarse-large (>9.00" diameter; 10,000-hour fuels) – Tree snags** (hard***) – Tree snags** (soft***) – Tree snag count** (hard***) 0-0 per acre Tree snag count** (hard***) * Decomposition Classes: N - no or little integration with the soil surface; I - partial to nearly full integration with the soil surface.
** >10.16cm diameter at 1.3716m above ground and >1.8288m height--if less diameter OR height use applicable down wood type; for pinyon and juniper, use 0.3048m above ground.
*** Hard - tree is dead with most or all of bark intact; Soft - most of bark has sloughed off.
Table 8. Canopy structure (% cover)
Height Above Ground (ft) Tree Shrub/Vine Grass/
GrasslikeForb <0.5 – – 1-3% 0-1% >0.5 <= 1 – 1-3% 3-5% 1-3% >1 <= 2 – 3-5% 10-15% 3-10% >2 <= 4.5 – 3-5% 30-50% – >4.5 <= 13 – – – – >13 <= 40 5-10% – – – >40 <= 80 – – – – >80 <= 120 – – – – >120 – – – – Figure 11. Plant community growth curve (percent production by month). TX3779 , Mid and Tallgrass Prairie Community. Warm-season rangeland with most production April to October.
Jan Feb Mar Apr May Jun Jul Aug Sep Oct Nov Dec J F M A M J J A S O N D 2 2 2 10 20 24 10 5 10 10 3 2 Community 1.2
Mid Grass Oak Community
Figure 12. Midgrass Oak Savannah Community, Gravelly Redland ecological site, Hays County, Texas.
The Midgrass Oak Savannah Community (1.2) is a midgrass dominated grassland being encroached by indigenous or invading woody species that had been held at low densities by repeated fires and competition from a vigorous grass component. Numerous woody species, including juniper and mesquite, are increasing in density because overgrazing by livestock has reduced grass cover, exposed some soil, and reduced fine fuel for fire. Less rainfall soaks into the soil except under the brush species where stem flow directs the rainfall to the soil beneath the brush. The woody canopy varies between 10 and 25 percent depending on time since last burned or the brush was treated and availability of invading species. Typically, oaks increase in size and mesquite and/or juniper increase in density.
Less palatable brushy species such as catclaw acacia, bumelia, Texas persimmon (Diospyros texana), sumacs, condalia, elbowbush, and feather dalea (Dalea spp.) also increase. The preferred tall grasses are being replaced by the more grazing resistant midgrasses. Characteristic grasses are little bluestem, sideoats grama, tall (Sporobolus compositus var. compositus) and meadow dropseed (Sporobolus asper var. asper), vine mesquite (Panicum obtusum), plains lovegrass (Eragrostis intermedia), Texas cupgrass (Eriochloa sericea), and feathery bluestems (Bothriochloa spp.). Most of the perennial forbs found in the historic community remain in this plant community. In this phase, the increasing woody species are generally less than five feet tall and are subject to control by improved grazing management, prescribed burning and individual plant treatments (IPT).
Annual primary production still ranges from 2,000 to 4,500 pounds per acre but a greater percentage is now woody species. Forage production is still predominantly grass species although somewhat suppressed. Heavy continuous grazing will reduce plant cover, litter, and mulch and increase bare ground exposing the soil to water erosion. Because of gentle slopes and grass cover, some soil movement could take place in this vegetation type during rainstorms.
The changes in species composition are small initially, but unless measures are taken to restore the health and vigor of the palatable plants and do some form of suppression, woody species will continue to increase in size and density. As the woody cover increases they capture more sunlight, soil moisture and nutrients at the expense of more desired plants. The midgrasses give way to curlymesquite, buffalograss, and Texas wintergrass.
In the Midgrass Oak Savannah Community (1.2), ecological processes have changed somewhat because of the shift in energy, moisture, and nutrient capture. The pathway back to the reference plant community can be accomplished without costly acceleration of conservation practices. However, grazing management alone will not reverse retrogression; some form of woody plant control, such as prescribed burning or individual plant treatment (IPT), must be used. Some, but not all woody species can be managed with targeted grazing with sheep and goats. Mesquite is one that is not a preferred browsing species.
When the canopy of the woody plants becomes dense enough (25 percent) and tall enough (greater than 5 feet) to suppress grass growth and resist damage from fire, a threshold in ecological succession is crossed. The Midgrass Oak Savannah Community (1.2) transitions into the Shrubland State (2). Once this threshold has been passed, low cost range management practices such as proper grazing and prescribed burning cannot reverse the transition to woody plant dominance.Figure 13. Annual production by plant type (representative values) or group (midpoint values)
Table 9. Annual production by plant type
Plant type Low
(lb/acre)Representative value
(lb/acre)High
(lb/acre)Grass/Grasslike 1300 1950 2925 Shrub/Vine 300 450 675 Tree 200 300 450 Forb 200 300 450 Total 2000 3000 4500 Table 10. Ground cover
Tree foliar cover 10-10% Shrub/vine/liana foliar cover 0-10% Grass/grasslike foliar cover 20-30% Forb foliar cover 0-20% Non-vascular plants 0% Biological crusts 0% Litter 0% Surface fragments >0.25" and <=3" 0% Surface fragments >3" 0% Bedrock 0% Water 0% Bare ground 0% Table 11. Soil surface cover
Tree basal cover 0-0% Shrub/vine/liana basal cover 0-10% Grass/grasslike basal cover 10-20% Forb basal cover 0-0% Non-vascular plants 0% Biological crusts 0% Litter 80-100% Surface fragments >0.25" and <=3" 0% Surface fragments >3" 10-20% Bedrock 0% Water 0% Bare ground 0-10% Table 12. Woody ground cover
Downed wood, fine-small (<0.40" diameter; 1-hour fuels) – Downed wood, fine-medium (0.40-0.99" diameter; 10-hour fuels) – Downed wood, fine-large (1.00-2.99" diameter; 100-hour fuels) – Downed wood, coarse-small (3.00-8.99" diameter; 1,000-hour fuels) – Downed wood, coarse-large (>9.00" diameter; 10,000-hour fuels) – Tree snags** (hard***) – Tree snags** (soft***) – Tree snag count** (hard***) 0-0 per acre Tree snag count** (hard***) * Decomposition Classes: N - no or little integration with the soil surface; I - partial to nearly full integration with the soil surface.
** >10.16cm diameter at 1.3716m above ground and >1.8288m height--if less diameter OR height use applicable down wood type; for pinyon and juniper, use 0.3048m above ground.
*** Hard - tree is dead with most or all of bark intact; Soft - most of bark has sloughed off.
Table 13. Canopy structure (% cover)
Height Above Ground (ft) Tree Shrub/Vine Grass/
GrasslikeForb <0.5 – – 1-3% 0-1% >0.5 <= 1 – 1-3% 3-5% 1-3% >1 <= 2 – 3-5% 10-15% 3-15% >2 <= 4.5 – 3-10% 20-50% – >4.5 <= 13 – – – – >13 <= 40 5-10% – – – >40 <= 80 – – – – >80 <= 120 – – – – >120 – – – – Figure 14. Plant community growth curve (percent production by month). TX3779 , Mid and Tallgrass Prairie Community. Warm-season rangeland with most production April to October.
Jan Feb Mar Apr May Jun Jul Aug Sep Oct Nov Dec J F M A M J J A S O N D 2 2 2 10 20 24 10 5 10 10 3 2 Pathway 1.1A
Community 1.1 to 1.2A shift in the composition of the plant community is primarily driven by the lack of managing woody plants, juniper in particular. Juniper and other woody species are introduced from the site primarily through wildlife fecal deposits. Grazing that removes fuel loading for fire is a contributing factor. However juniper can increase regardless of grazing pressure unless sheep and goats are utilized. Long term droughts will hasten the change of any of the plant communities.
Pathway 1.2A
Community 1.2 to 1.1This recovery pathway consist of some method of brush management such as fire, mechanical or hand cutting or targeted grazing with goats and/or possibly sheep. Prescribed grazing is essential.
State 2
Shrubland StateThis state is the culmination of a loss of sunlight energy capture by historic plants, interruption of the hydrologic cycle because of interception, and stem flow and competition for nutrients. Mesquite was the early understory brush species, but Ashe juniper has increased tremendously resulting in further decline in midgrasses. Increase in shortgrasses and annuals. Increase in mesquite, catclaw, and pricklypear have also increased.
Dominant plant species
-
oak (Quercus), tree
-
Ashe's juniper (Juniperus ashei), tree
-
honey mesquite (Prosopis glandulosa), shrub
Community 2.1
Mixed Brush Shrubland Community
Figure 15. Mixed-Brush Shrubland Community of juniper with little herbaceous understory.
When woody plant canopy reaches 30 to 35 percent and grasses provide less than 50 percent of the herbage production, the transition from the Midgrass Oak Savannah Community (1.2) to the Mixed Brush Shrubland Community (2.1) is complete. At this point, there is generally not enough fine fuel produced by the grassland component to carry a prescribed fire of the intensity needed to control the woody plants. Once this threshold is reached proper grazing management and prescribed burning cannot reverse the transition. Intensive and usually expensive brush control practices must be applied to reverse the transition to the dense woodland community.
Oak, mesquite, and/or juniper dominate this community phase. Juniper can achieve dominance in as little as 30 years from the onset of seedlings. The only remnants of grassland vegetation remain in the interspaces. Estimated vegetative composition by weight is 30-35% grasses, 8-10% forbs, 30-35% shrubs, and 25-30% trees. Woody canopy cover exceeds 40%.
Common understory shrubs for this plant community are pricklypear, algerita, condalia, yucca (Yucca spp.), Texas persimmon, elbowbush, prickly ash (Zanthoxylum spp), and catclaw acacia. Shortgrasses, cool-season grasses, and low quality annual and perennial forbs occupy the tree interspaces. Characteristic grasses are Texas wintergrass, curlymesquite, buffalograss, and cedar sedge (Carex planostachys). Common forbs include dotted gayfeather (Liatris punctata var. punctata), orange zexmenia, croton (Croton spp.), western ragweed (Ambrosia psilostachya), prairie coneflower (Ratibida columnifera), and broomweed (Gutierrezia spp.). With continued overgrazing, either by livestock or deer, the brush canopy increases in density and thickens while shortgrasses, such as threeawns (Aristida spp.), red grama (Bouteloua trifida), Texas grama (Bouteloua rigidiseta), hairy tridens (Erioneuron pilosum), and broomweed (Gutierrezia spp.) replace the more palatable mid and short grasses.
Annual primary production varies from 2,500 to 4,500 pounds per acre; most of it in the woody component. Grasses and forbs make up 25 percent or less of the annual herbage production. The oak/mixed-brush overstory can reach 80 to 90 percent ground cover and produce 70 percent or more of the annual production. Although this vegetative state provides cover for wildlife, only limited preferred forage or browse is available for livestock or wildlife.
The tree and shrub canopy acts to intercept rainfall and increase evapotranspiration losses, creating a more xeric microclimate. Soil fauna and litter are reduced exposing more soil surface to erosion in the few interspaces. However, within the woody canopy, hydrologic processes stabilize and soil organic matter and mulch begin to increase and eventually stabilize in the woodland state.
Without major brush control and management inputs, this plant community cannot be reversed. It will continue to thicken until it stabilizes with the climate and soil. Returning the Oak/Mixed Brush Woodland (2.1) Community back to Midgrass Oak Community (1.2) requires extensive and expensive reclamation practices. Mechanical and/or chemical brush control must be followed by prescribed grazing and prescribed burning practices. If ground disturbance methods are used, replanting can be done to speed up the recovery and increase plant diversity.Figure 16. Annual production by plant type (representative values) or group (midpoint values)
Table 14. Annual production by plant type
Plant type Low
(lb/acre)Representative value
(lb/acre)High
(lb/acre)Tree 800 1200 1800 Shrub/Vine 600 900 1350 Grass/Grasslike 500 750 1125 Forb 100 150 225 Total 2000 3000 4500 Table 15. Ground cover
Tree foliar cover 10-10% Shrub/vine/liana foliar cover 0-10% Grass/grasslike foliar cover 20-40% Forb foliar cover 0-10% Non-vascular plants 0% Biological crusts 0% Litter 0% Surface fragments >0.25" and <=3" 0% Surface fragments >3" 0% Bedrock 0% Water 0% Bare ground 0% Table 16. Soil surface cover
Tree basal cover 0-10% Shrub/vine/liana basal cover 0-10% Grass/grasslike basal cover 0-10% Forb basal cover 0-10% Non-vascular plants 0% Biological crusts 0% Litter 90-100% Surface fragments >0.25" and <=3" 0% Surface fragments >3" 10-20% Bedrock 0% Water 0% Bare ground 0-10% Table 17. Woody ground cover
Downed wood, fine-small (<0.40" diameter; 1-hour fuels) – Downed wood, fine-medium (0.40-0.99" diameter; 10-hour fuels) – Downed wood, fine-large (1.00-2.99" diameter; 100-hour fuels) – Downed wood, coarse-small (3.00-8.99" diameter; 1,000-hour fuels) – Downed wood, coarse-large (>9.00" diameter; 10,000-hour fuels) – Tree snags** (hard***) – Tree snags** (soft***) – Tree snag count** (hard***) 40-80 per acre Tree snag count** (hard***) * Decomposition Classes: N - no or little integration with the soil surface; I - partial to nearly full integration with the soil surface.
** >10.16cm diameter at 1.3716m above ground and >1.8288m height--if less diameter OR height use applicable down wood type; for pinyon and juniper, use 0.3048m above ground.
*** Hard - tree is dead with most or all of bark intact; Soft - most of bark has sloughed off.
Table 18. Canopy structure (% cover)
Height Above Ground (ft) Tree Shrub/Vine Grass/
GrasslikeForb <0.5 – – 1-3% 0-1% >0.5 <= 1 – 1-3% 0-5% 1-3% >1 <= 2 – 3-5% 0-10% 0-5% >2 <= 4.5 – 3-5% 0-15% – >4.5 <= 13 20-40% 10-20% – – >13 <= 40 50-70% – – – >40 <= 80 – – – – >80 <= 120 – – – – >120 – – – – Figure 17. Plant community growth curve (percent production by month). TX3771 , Hardwood/Shrub Woodland Community. Hardwood and shrub woodland community..
Jan Feb Mar Apr May Jun Jul Aug Sep Oct Nov Dec J F M A M J J A S O N D 2 3 10 15 20 18 5 4 10 7 4 2 State 3
Exotic Grass Savannah StateThis state is a result of significant ground disturbing mechanical brush management. Depending upon the management goals, the site may have bee seeded to native or non-native species or a combination. Non-native grasses can also invade without seeding being introduced through hay, livestock, or wildlife. Herbaceous species diversity and site resilience has been significantly reduced.
Dominant plant species
-
Bermudagrass (Cynodon dactylon), grass
-
Johnsongrass (Sorghum halepense), grass
Community 3.1
Exotic Grass Oak Savannah Community
Figure 18. Exotic Grass/Oak Savannah Community on Gravelly Redland Ecological Site.
This community phase is characterized by a mixture of exotic and native grasses with live oak canopy of about 10%. Seeded or non-native grasses include naturalized species such as King Ranch bluestem, bermudagrass, Johnsongrass (Sorghum halepense), silky bluestem (Dichanthium sericeum), kleingrass, and many others. The King Ranch bluestem has the most potential of the exotics to eventually dominate the site. When this occurs, there has been a dramatic reduction in the native forb and legume diversity. These monoculture type communities may be too dense for gallinaceous wildlife.
Through the re-introduction of fire and prescribed grazing, plus reseeding of native forbs and grasses, this site can be restored to something resembling the historic plant. Utilizing native plants in the re-seeding will greatly benefit wildlife species such as deer, turkey, quail, and other birds.
Total production for this site may be similar to the productive potential of this site in reference condition except the majority of the plant communities are exotics. Many times the exotic grasses can provide the same hydrologic functions as do the natives.Figure 19. Annual production by plant type (representative values) or group (midpoint values)
Table 19. Annual production by plant type
Plant type Low
(lb/acre)Representative value
(lb/acre)High
(lb/acre)Grass/Grasslike 1700 2250 3825 Tree 200 300 450 Shrub/Vine 50 150 225 Forb 0 0 0 Total 1950 2700 4500 Table 20. Ground cover
Tree foliar cover 0-0% Shrub/vine/liana foliar cover 0-10% Grass/grasslike foliar cover 20-40% Forb foliar cover 0-10% Non-vascular plants 0% Biological crusts 0% Litter 0% Surface fragments >0.25" and <=3" 0% Surface fragments >3" 0% Bedrock 0% Water 0% Bare ground 0% Table 21. Soil surface cover
Tree basal cover 0-0% Shrub/vine/liana basal cover 0-0% Grass/grasslike basal cover 10-20% Forb basal cover 0-0% Non-vascular plants 0% Biological crusts 0% Litter 80-90% Surface fragments >0.25" and <=3" 0% Surface fragments >3" 10-20% Bedrock 0% Water 0% Bare ground 0-10% Table 22. Woody ground cover
Downed wood, fine-small (<0.40" diameter; 1-hour fuels) – Downed wood, fine-medium (0.40-0.99" diameter; 10-hour fuels) – Downed wood, fine-large (1.00-2.99" diameter; 100-hour fuels) – Downed wood, coarse-small (3.00-8.99" diameter; 1,000-hour fuels) – Downed wood, coarse-large (>9.00" diameter; 10,000-hour fuels) – Tree snags** (hard***) – Tree snags** (soft***) – Tree snag count** (hard***) 40-80 per acre Tree snag count** (hard***) * Decomposition Classes: N - no or little integration with the soil surface; I - partial to nearly full integration with the soil surface.
** >10.16cm diameter at 1.3716m above ground and >1.8288m height--if less diameter OR height use applicable down wood type; for pinyon and juniper, use 0.3048m above ground.
*** Hard - tree is dead with most or all of bark intact; Soft - most of bark has sloughed off.
Table 23. Canopy structure (% cover)
Height Above Ground (ft) Tree Shrub/Vine Grass/
GrasslikeForb <0.5 – – 1-3% 0-1% >0.5 <= 1 – 0-3% 3-5% 0-3% >1 <= 2 – 0-8% 10-15% 0-10% >2 <= 4.5 – 0-10% 30-50% – >4.5 <= 13 – – – – >13 <= 40 1-10% – – – >40 <= 80 – – – – >80 <= 120 – – – – >120 – – – – Transition T1A
State 1 to 2A transition occurs due to a lack of brush management with mechanical means, fire or targeted goat/sheep grazing. Grazing deferment alone will not halt the increase of woody species. Hydrologic characteristics are altered by increased woody species. Now, energy flows more through woody plants than herbaceous plants.
Restoration pathway R2A
State 2 to 1R2A Restoration includes some form of brush management and many times an integrated approach utilizing several methods. In some cases of severe long-term overharvesting of the desired plants, replanting may be necessary. Prescribed burning is an option once the fine fuel load has recovered so prescribed grazing will be essential.
Transition T2A
State 2 to 3This transition is driven by ground disturbance brush management with the replanting of exotic grasses, either as a mixture or single species. Exotic plants can also be introduced from hay brought to the site or from livestock and wildlife. Hydrologic characteristics are anticipated to be similar to the Mixed Grass Prairie Community.
Additional community tables
Table 24. Community 1.1 plant community composition
Group Common name Symbol Scientific name Annual production () Foliar cover (%) Grass/Grasslike1 Tall/Midgrasses 700–1575 little bluestem SCSC Schizachyrium scoparium 700–1200 – sideoats grama BOCU Bouteloua curtipendula 500–1000 – 2 Tallgrasses 400–900 big bluestem ANGE Andropogon gerardii 100–500 – Indiangrass SONU2 Sorghastrum nutans 100–500 – 3 Midgrasses 400–900 composite dropseed SPCO16 Sporobolus compositus 200–300 – Arizona cottontop DICA8 Digitaria californica 150–225 – plains lovegrass ERIN Eragrostis intermedia 100–150 – Texas cupgrass ERSE5 Eriochloa sericea 100–150 – green sprangletop LEDU Leptochloa dubia 100–150 – vine mesquite PAOB Panicum obtusum 75–150 – silver bluestem BOSA Bothriochloa saccharoides 75–150 – 4 Shortgrasses 100–225 buffalograss BODA2 Bouteloua dactyloides 25–75 – curly-mesquite HIBE Hilaria belangeri 25–75 – Hall's panicgrass PAHA Panicum hallii 25–50 – slim tridens TRMU Tridens muticus 25–50 – slim tridens TRMUE Tridens muticus var. elongatus 25–50 – Texas grama BORI Bouteloua rigidiseta 25–50 – red grama BOTR2 Bouteloua trifida 25–50 – hairy woollygrass ERPI5 Erioneuron pilosum 25–50 – Wright's threeawn ARPUW Aristida purpurea var. wrightii 25–50 – 5 Cool-season Grasses 100–225 cedar sedge CAPL3 Carex planostachys 50–150 – wildrye ELYMU Elymus 50–150 – Texas wintergrass NALE3 Nassella leucotricha 50–150 – Forb6 Forbs 100–225 white sagebrush ARLU Artemisia ludoviciana 25–75 – blazing star LIATR Liatris 25–75 – Nuttall's sensitive-briar MINU6 Mimosa nuttallii 25–50 – slimflower scurfpea PSTE5 Psoralidium tenuiflorum 25–50 – snoutbean RHYNC2 Rhynchosia 25–50 – zarzabacoa comun DEIN3 Desmodium incanum 25–50 – bundleflower DESMA Desmanthus 25–50 – blacksamson echinacea ECAN2 Echinacea angustifolia 0–50 – indigo INDIG Indigofera 25–50 – trailing krameria KRLA Krameria lanceolata 25–50 – Forb, annual 2FA Forb, annual 0–50 – Indian mallow ABUTI Abutilon 25–50 – Shrub/Vine7 Shrubs/Vines 100–225 catclaw acacia ACGR Acacia greggii 50–150 – littleleaf sumac RHMI3 Rhus microphylla 25–100 – greenbrier SMILA2 Smilax 25–100 – bully SIDER2 Sideroxylon 25–75 – pricklypear OPUNT Opuntia 25–75 – jointfir EPHED Ephedra 25–75 – stretchberry FOPU2 Forestiera pubescens 25–50 – algerita MATR3 Mahonia trifoliolata 25–50 – Texas Hercules' club ZAHI2 Zanthoxylum hirsutum 0–25 – Tree8 Trees 100–225 Texas live oak QUFU Quercus fusiformis 100–225 – hackberry CELTI Celtis 25–100 – western soapberry SASAD Sapindus saponaria var. drummondii 25–75 – elm ULMUS Ulmus 0–50 – honey mesquite PRGL2 Prosopis glandulosa 0–25 – blackjack oak QUMA3 Quercus marilandica 0 – post oak QUST Quercus stellata 0 – Table 25. Community 1.2 plant community composition
Group Common name Symbol Scientific name Annual production () Foliar cover (%) Table 26. Community 2.1 plant community composition
Group Common name Symbol Scientific name Annual production () Foliar cover (%) Table 27. Community 3.1 plant community composition
Group Common name Symbol Scientific name Annual production () Foliar cover (%) Interpretations
Animal community
Many types of grassland insects, reptiles, birds, and mammals frequented the Mixed Grass Prairie Community (1.1) of the site, either as their base habitat or maneuvering from the adjacent sites. Small mammals included many kinds of rodents, jackrabbit, cottontail rabbit, raccoon, skunk, opossum, and armadillo. Predators included coyote, red fox, gray fox, bobcat, and occasionally mountain lion. Game birds, songbirds, and birds of prey were indigenous or frequent users. Most are still plentiful. Bison and pronghorn antelope, however, are no longer present. Native white-tailed deer and many species of exotic deer utilize the Gravelly Redland site in its various states. Several species of exotic wildlife have been introduced on the site including deer, such as axis, sika, and fallow; antelope, such as sable, oryx, blackbuck, and nilgai; and sheep, such as Barbados (mouflon) and aoudad. Their numbers must be included along with livestock and native wildlife, primarily white-tailed deer, in any conservation plan. Axis deer have the ability to shift their diet among plant groups giving them a competitive advantage over the native white-tailed deer. Feral hogs may also be present on the site. Hogs can be damaging to the plant community and ranch improvement structures if their numbers are not managed. Deer, turkey, and quail particularly favor the habitat provided by the Midgrass Oak Savannah Community (1.2).
The site is suitable for the production of livestock, including cattle, sheep, and goats. The site in reference condition was very suited to primary grass eaters such as cattle. As retrogression occurs and woody plants invade, the community becomes better habitat for sheep, goats, deer, and other wildlife because of the desirable browse and cool-season grasses. Cattle, sheep, and goats should be stocked in proportion to the available grass, forb, and browse forage keeping deer competition for forbs and browse in mind. Deer populations must also be kept within limits of the habitat sustainability even if the site is managed exclusively for deer. If the animal numbers are not kept in balance with herbage and browse production through prescribed grazing management and good wildlife population management, the late Midgrass Oak Savannah Community (1.2) will have little to offer as habitat except cover.
Plant Preference by Animal Kind:
This rating system provides general guidance as to animal forage preference for plant species. It also indicates possible competition and diet overlap between kinds of herbivores. Grazing preference changes from time to time, especially between seasons, and between animal kinds and classes. An animal’s preference or avoidance of certain plants is learned over time through grazing experience and maternal learning (http://extension.usu.edu/behave/Grazing accessed 8/30/13). Preference does not necessarily reflect the ecological status of the plant within the plant community. For wildlife, plant preferences for food are rated. Refer to detailed habitat guides for a more complete description of a species habitat needs.
Legend: P=Preferred D=Desirable U=Undesirable N=Not Consumed T=Toxic X=Used, but not degree of utilization unknown
Preferred – Percentage of plant in animal diet is greater than it occurs on the land
Desirable – Percentage of plant in animal diet is similar to the percentage composition on the land
Undesirable – Percentage of plant in animal diet is less than it occurs on the land
Not Consumed – Plant would not be eaten under normal conditions. It is only consumed when other forages not available. This can also include plants that are unavailable during parts of the year.
Toxic – Rare occurrence in diet and, if consumed in any tangible amounts results in death or severe illness in animal (Hart, 2003). (Note: many plants can be good forage but toxic at certain doses or at certain times of the year. Animals in poor condition are most susceptible.)Hydrological functions
The climate affecting the hydrology of the Gravelly Redland Ecological Site is humid subtropical with approximately two-thirds of annual rainfall occurring during the April to September period. Rainfall during this period generally falls during thunderstorms and fairly large amounts of rain may fall in a short time. Because of the topography and vegetation, quality of surface runoff is high with low erosion and sedimentation levels. Sinkholes and crevices facilitate water movement to deeper root zones and below, contributing some to the recharge of aquifers. The site is well drained. Runoff is moderate, with good cover. Erosion could be a hazard with excessive defoliation because of the slope.
Under reference conditions, the grassland vegetation intercepted and utilized much of the incoming rainfall in the soil solum. Only during extended rains or heavy thunderstorms was there much runoff. Litter and soil movement was slight. Standing plant cover, duff, and organic matter decrease and surface runoff increase as the Oak Savannah State (1) transitions to the Midgrass Oak Savannah State (2). These processes continue in the interstitial spaces in the Shrubland (2). The woody plants compete for moisture and sunlight with the remaining grasses and forbs; further reducing production and ground cover in openings. Decreased litter and more bare ground allow erosion from soils in openings between trees.
Once the Mixed Brush Shrubland Community (2.1) canopy surpasses 50 percent, the hydrology and ecological processes, nutrient cycling, and energy flow stabilize within the woody plant canopy; although a significant departure from the Oak Savannah State (1). Evaporation and interception losses are higher resulting in less moisture reaching the soil. The deeper-rooted woody plants are able to extract water from greater depths than most grasses so less water will be available for down-slope movement except through crevices.Recreational uses
The Gravelly Redland Site is well suited for many outdoor recreational uses including hunting, hiking, camping, equestrian, and bird watching. This site along with adjacent upland sites provides diverse scenic beauty.
Wood products
Posts and specialty wood products are made from juniper, mesquite, oak and many shrubs. Mesquite and oak are used for firewood and charcoal.
Other products
Jams and jellies are made from many fruit-bearing species, such as algerita. Seeds are harvested from many plants for commercial sale. Grasses and forbs are harvested by the dried-plant industry for sale in dried flower arrangements. Honeybees are utilized to harvest honey from the many flowering plants, such as mesquite.
Other information
None.
Supporting information
Inventory data references
Information presented was derived from the revised Gravelly Redland Range Site description, literature, limited NRCS clipping data (417s), field observations, professional consensus, and personal contacts with range-trained personnel.
Other references
Anderson, J.R., C.A. Taylor, Jr., C.J. Owens, J.R. Jackson, D.K. Steele, and R. Brantley. 2013. Using experience and supplementation to increase juniper consumption by three different breeds of sheep. Rangeland Ecol. Management. 66:204-208. March.
Archer S. 1994. Woody plant encroachment into southwestern grasslands and savannas: rates, patterns and proximate causes. in: Ecological implications of livestock herbivory in the West, pp.13-68. Edited by M. Vavra, W. Laycock, R. Pieper, Society for Range Management Publication. , Denver, Colorado.
Bestelmeyer, B.T., J.R. Brown, K.M. Havsted, R. Alexander, G. Chavez, and J.E. Hedrick. 2003. Development and use of state-and-transition models for rangelands. Journal of Range Management. 56(2): 114-126.
Bushland, R.C. 1985. Eradication program in the southwestern United States. Symposium on eradication of the screwworm from the United States and Mexico. Misc. Pub. Entomol. Soc. Am., 62:12-15.
Foster, J.H. 1917. The spread of timbered areas in central Texas. Journal of Forestry 15:442-445.
Frost, C. C. 1998. Presettlement fire frequency regimes of the Unites States: a First Approximation. Tall Timbers Fire Ecology Conference Proceedings. No. 20. Tall Timbers Research Station. Tallahassee, FL.
Fuhlendorf, S. D., and Engle D.M., Kerby J., and Hamilton R. 2008. Pyric Herbivory: rewilding Landscapes through the Recoupling of Fire and Grazing. Conservation Biology. Volume 23, No. 3, 588-598.
Hamilton W. and D. Ueckert. 2005. Rangeland Woody Plant Control--Past, Present, and Future. Chapter 1 in: Brush Management-Past, Present, and Future. Texas A & M University Press. Pp.3-16.
Hanselka, W., R. Lyons, and M. Moseley. 2009. Grazing Land Stewardship – A Manual for Texas Landowners. Texas AgriLife Communications, http://agrilifebookstore.org.
Hart, C., R.T. Garland, A.C. Barr, B.B. Carpenter, and J.C. Reagor. 2003. Toxic Plants of Texas. Texas Cooperative Extension Bulletin B-6103 11-03.
Inglis, J. M. 1964. A History of Vegetation on the Rio Grande Plains. Texas Parks and Wildlife Department, Bulletin No. 45. Austin, Texas.
Massey, C.L. 2009. The founding of a town – The Gugger and Benke families. Helotes Echo, July 1, 2009.
Natural Resources Conservation Service. 1994. The Use and Management of Browse in the Edwards Plateau of Texas. Temple, Texas.
Plant symbols, common names, and scientific names according to USDA/NRCS Texas Plant List (Unpublished)
Pyne, S.J. 1982. Fire in America. Princeton University Press, Princeton, NJ.
Roemer, Ferdinand Von. 1983. Roemer’s Texas. Eakins Press.
Schmidly, D.J. 2002. Texas natural history: a century of change. Texas Tech University Press, Lubbock.
Scifres, C.J. and W.T. Hamilton. 1993. Prescribed Burning for Brush Management: The South Texas Example. Texas A & M University Press, 245 pp.
Smeins, F., S. Fuhlendorf, and C. Taylor, Jr. 1997. Environmental and Land Use Changes: A Long Term Perspective. Chapter 1 in: Juniper Symposium 1997. Texas Agricultural Experiment Station. Pp 1-21.
Taylor, C.A. (Ed.). 1997. Texas Agriculture Experiment Station Technical Report 97-1 (Proceedings of the 1997 Juniper Symposium), Sonora Texas, pp. 9-22.
Teer, J.G., J.W. Thomas, and E.A. Walker. 1965. Ecology and Management of White-tailed Deer in the Llano Basin of Texas. Wildlife Monographs 10: 1-62.
Thurow, T.O. and J.W. Hester. 1997. 1997 Juniper Symposium. Texas Agricultural Experiment Station, The Texas A&M University System. Tech. Rep. 97-1. January 9-10, 1997. San Angelo, Texas
USDA-NRCS (Formerly Soil Conservation Service) Range Site Description (1972)
Vines, R.A. 1984. Trees of Central Texas. University of Texas Press. Austin, Texas.
Weninger, D. 1984. The Explorer’s Texas. Eakin Press; Waco, Texas.
Wilcox. B.P. and T.L. Thurow. 2006. Emerging Issues in Rangeland Ecohydrology: Vegetation Change and the Water Cycle. Rangeland Ecol. Management. 59:220-224, March.
Wilcox, B.P., Y. Huang, and J.W. Walker. 2008. Long-term trends in stream flow from semiarid rangeland: uncovering drivers of change. Global Change Biology 14: 1676-1689, doi:10.1111/j.1365.2486.2008.01578.
Wilcox, B.P., W.A. Dugas, M.K. Owens, D.N Ueckert, and C.R. Hart. 2005. Shrub Control and Water Yield on Texas Rangelands: Current State of Knowledge. Texas Agricultural Experiment Station Research Report 05-1.
Wills, Frederick. 2006. Historic Vegetation of Camp Bullis and Camp Stanley, Southeastern Edwards, Plateau. Texas. Texas Journal of science. 58(3):219-230.
Wright, H.A. and A.W. Bailey. 1982. Fire Ecology: United States and Southern Canada. John Wiley & Sons, Inc.
Wu. B.X., E.J. Redeker, and T.L. Thurow. 2001. Vegetation and Water Yield Dynamics in an Edwards Plateau Watershed. Journal of Range Management. 54:98-105. March 2001.
http://extension.usu.edu/behave/ (accessed 9/4/2013)Contributors
Dr. Joseph Schuster
Mark Moseley
Travis Waiser, MLRA Leader, NRCS, Kerrville, TXApproval
Bryan Christensen, 9/19/2023
Acknowledgments
Site Development and Testing Plan: Future work, as described in a Project Plan, to validate the information in this Provisional Ecological Site Description is needed. This will include field activities to collect low, medium and high-intensity sampling, soil correlations, and analysis of that data. Annual field reviews should be done by soil scientists and vegetation specialists. A final field review, peer review, quality control, and quality assurance reviews of the ESD will be needed to produce the final document. Annual reviews of the Project Plan are to be conducted by the Ecological Site Technical Team. Reviewers and Technical Contributors: Joe Franklin, Zone Range Management Specialist, NRCS, San Angelo Zone Office, Texas Ryan McClintock, Biologist, NRCS, San Angelo Zone Office, Texas Jessica Jobes, Project Leader, Kerrville Soil Survey Office, NRCS, Kerrville, Texas Travis Waiser, Soil Scientist, NRCS, Kerrville Soil Survey Office, Texas Bryan Hummel, Natural Resources Technician, Joint Base San Antonio-Camp Bullis, Texas Ann Graham, Editor, NRCS, Temple, Texas Charles Anderson, NRCS RMS, San Angelo, Texas Homer Sanchez, NRCS, State RMS, Temple, Texas Justin Clary, NRCS, RMS, Temple, Texas QC/QA completed by: Bryan Christensen, SRESS, NRCS, Temple, TX Erin Hourihan, ESDQS, NRCS, Temple, TX
Rangeland health reference sheet
Interpreting Indicators of Rangeland Health is a qualitative assessment protocol used to determine ecosystem condition based on benchmark characteristics described in the Reference Sheet. A suite of 17 (or more) indicators are typically considered in an assessment. The ecological site(s) representative of an assessment location must be known prior to applying the protocol and must be verified based on soils and climate. Current plant community cannot be used to identify the ecological site.
Author(s)/participant(s) San Angelo NRCS Zone Office Contact for lead author 325-944-0147 Date 04/08/2013 Approved by Approval date Composition (Indicators 10 and 12) based on Annual Production Indicators
-
Number and extent of rills:
None. -
Presence of water flow patterns:
Some water flow patterns are expected due to runoff from Adobe, Steep Adobe, and Low stony hill sites. -
Number and height of erosional pedestals or terracettes:
None. -
Bare ground from Ecological Site Description or other studies (rock, litter, lichen, moss, plant canopy are not bare ground):
0-5% bare ground. -
Number of gullies and erosion associated with gullies:
None. -
Extent of wind scoured, blowouts and/or depositional areas:
None. -
Amount of litter movement (describe size and distance expected to travel):
Little or no litter movement or deposition during normal rainfall events. -
Soil surface (top few mm) resistance to erosion (stability values are averages - most sites will show a range of values):
Stability range is expected to be 5-6. -
Soil surface structure and SOM content (include type of structure and A-horizon color and thickness):
Reddish brown clay surface with medium angular blocky structure, 0 to 8 inches Thick A horizon. Gravelly modifier. 1 to 3 percent Organic Matter. -
Effect of community phase composition (relative proportion of different functional groups) and spatial distribution on infiltration and runoff:
High canopy, basal cover and density with small interspaces should make rainfall impact negligible. This site has well drained soils, very slowly permeable with 1 to 5 percent slopes which allow negligible runoff and erosion. -
Presence and thickness of compaction layer (usually none; describe soil profile features which may be mistaken for compaction on this site):
None. -
Functional/Structural Groups (list in order of descending dominance by above-ground annual-production or live foliar cover using symbols: >>, >, = to indicate much greater than, greater than, and equal to):
Dominant:
Warm-season tallgrasses Warm-season midgrassesSub-dominant:
Warm-season midgrasses Trees Shrubs ForbsOther:
Warm-season shortgrasses Cool-season grassesAdditional:
-
Amount of plant mortality and decadence (include which functional groups are expected to show mortality or decadence):
Perennial grasses will naturally exhibit a minor amount (less than 5%) of senescence and some mortality every year. -
Average percent litter cover (%) and depth ( in):
>90 percent litter, 0.5 to 1.0 inch depth. -
Expected annual annual-production (this is TOTAL above-ground annual-production, not just forage annual-production):
2000 to 4500 pounds per acre. -
Potential invasive (including noxious) species (native and non-native). List species which BOTH characterize degraded states and have the potential to become a dominant or co-dominant species on the ecological site if their future establishment and growth is not actively controlled by management interventions. Species that become dominant for only one to several years (e.g., short-term response to drought or wildfire) are not invasive plants. Note that unlike other indicators, we are describing what is NOT expected in the reference state for the ecological site:
Ashe juniper, pricklypear, yucca, tasajillo, pricklyash, lotebush, mesquite, King Ranch bluestem, silky bluestem. -
Perennial plant reproductive capability:
All perennial species should be capable of reproducing every year unless disrupted by extended drought, overgrazing, wildfire, insect damage, or other events occuring immediately prior to, or during the reproductive phase.
Print Options
Sections
Font
AAAAOther
PrintThe Ecosystem Dynamics Interpretive Tool is an information system framework developed by the USDA-ARS Jornada Experimental Range, USDA Natural Resources Conservation Service, and New Mexico State University.
Accessibility statement


