Natural Resources
Conservation Service
Ecological site R080BY153TX
Loamy Sand
26-33" PZ
Last updated: 9/19/2023
Accessed: 06/29/2026
-
Search


Major Land Resource Area or ecological site by name and/or ID.
PreviousSectionsNextGeneral information
Provisional. A provisional ecological site description has undergone quality control and quality assurance review. It contains a working state and transition model and enough information to identify the ecological site.
Click to explore map
Figure 1. Mapped extent
Areas shown in blue indicate the maximum mapped extent of this ecological site. Other ecological sites likely occur within the highlighted areas. It is also possible for this ecological site to occur outside of highlighted areas if detailed soil survey has not been completed or recently updated.
MLRA notes
Major Land Resource Area (MLRA): 080B–Texas North-Central Prairies
MLRA 80B consists of gently rolling, dissected plains with very steep hillsides and sideslopes and narrow flood plains associated with small streams. Loamy and clayey soils range from very shallow to deep and developed in sandstones, shales, and limestones of Pennsylvanian age.
Classification relationships
This ecological site is correlated to soil components at the Major Land Resource Area (MLRA) level which is further described in USDA Ag Handbook 296.
Ecological site concept
These sites occur over deep non calcareous loamy sand soils on uplands. The reference vegetation includes native perennial tallgrasses with numerous forbs and scattered oaks. Woody canopy cover is typically under thirty percent under reference conditions. Without periodic fire or brush management, woody species may increase and dominate the site.
Associated sites
R080BY158TX SANDY 26-33" PZ
These sites frequently occur adjacent to each other or may be intermingled in the same landscape position. Deep sandy soils.
R080BY159TX Sandy Loam 26-33" PZ
These sites frequently occur adjacent to each other or may be intermingled in the same landscape position. Sandy loam soils.
Similar sites
R080BY159TX Sandy Loam 26-33" PZ
Similar species, greater proportion of tallgrasses, fewer trees. Slightly more production potential.
R080BY158TX SANDY 26-33" PZ
Similar species, lower proportions of tallgrasses and forbs. Greater proportion of midgrasses. Somewhat lower production potential.
Table 1. Dominant plant species
Tree (1) Quercus stellata
(2) Quercus marilandicaShrub Not specified
Herbaceous (1) Sorghastrum nutans
(2) Andropogon gerardiiPhysiographic features
This site occurs on linear to concave base slopes and interfluves of dip slopes and on treads of stream terraces in the Texas North-Central Prairies. Slopes are typically less than percent.
Table 2. Representative physiographic features
Landforms (1) Hills > Ridge
(2) Hills > Dip slope
(3) Alluvial plain > Stream terrace
Runoff class Very low to medium Elevation 750 – 2400 ft Slope 0 – 5 % Aspect Aspect is not a significant factor Climatic features
The climate is subtropical subhumid and is characterized by hot humid summers and relatively mild winters. Tropical maritime air controls the climate during spring, summer and fall. In winter and early spring, frequent surges of polar Canadian air cause sudden drops in temperatures and add considerable variety to the daily weather. The average first frost generally occurs about November 5 and the last freeze of the season usually occurs about March 19. The average frost free period ranges from 215 days in the northern counties, to 240 days in the south.
The average relative humidity in mid-afternoon is about 60 percent in the summer months. Humidity is higher at night, and the average at dawn is about 80 percent. The sun shines 75 percent of the time possible during the summer and 50 percent in winter. The prevailing wind direction is from the southwest and highest windspeeds occur during the spring months.
Approximately 75% of annual rainfall occurs between April 1 and October 31. Rainfall during the months of April through September typically occurs during thunderstorms which tend to be intense and brief, resulting in large amounts of rain in a short time. The wettest months of the year are May, June, September, and October. The driest months during the growing season are July and August. The winter months of November, December, January, and February are the driest months overall.
Average annual precipitation for the entire MLRA is approximately 28 inches. There is a noticeable difference in the average annual precipitation in the northern counties in comparison to the southern and western counties of this Major Land Resource Area. Jack, Clay, Young, and Palo Pinto Counties all have an average annual precipitation of more than 31 inches. Stephens, Eastland, McCulloch, and San Saba Counties all have an average annual precipitation of less than 28 inches.
Winters tend to be mild, with occasional periods of very cold temperatures which can be accompanied by strong northerly winds and freezing precipitation. Snow is infrequent and significant accumulations are rare. These periods of very cold weather are generally short-lived. Summers tend to be hot and dry. Drought conditions are common during most summers. Air temperatures of more than 95oF are common from mid-June through September. In the northern counties nearest to the Red River, temperatures are generally slightly cooler during winter months and slightly warmer during summer months than in the other counties in the North Central Prairie.Table 3 Representative climatic features
Frost-free period (characteristic range) 180-200 days Freeze-free period (characteristic range) 210-230 days Precipitation total (characteristic range) 30-30 in Frost-free period (actual range) 180-200 days Freeze-free period (actual range) 210-230 days Precipitation total (actual range) 30-30 in Frost-free period (average) 190 days Freeze-free period (average) 220 days Precipitation total (average) 30 in Characteristic rangeActual rangeBarLineFigure 2. Monthly precipitation range
Characteristic rangeActual rangeBarLineFigure 3. Monthly minimum temperature range
Characteristic rangeActual rangeBarLineFigure 4. Monthly maximum temperature range
BarLineFigure 5. Monthly average minimum and maximum temperature
Figure 6. Annual precipitation pattern
Figure 7 Annual average temperature pattern
Climate stations used
-
(1) SAN SABA 7NW [USC00417994], Richland Springs, TX
-
(2) BROWNWOOD 2ENE [USC00411138], Early, TX
-
(3) EASTLAND [USC00412715], Eastland, TX
-
(4) MINERAL WELLS AP [USW00093985], Millsap, TX
-
(5) BRECKENRIDGE [USC00411042], Breckenridge, TX
-
(6) GRAHAM [USC00413668], Graham, TX
-
(7) JACKSBORO [USC00414517], Jacksboro, TX
">Influencing water features
These sites may receive some runoff from other sites but also shed some water via overland flow. However, the presence of good ground cover and deep rooted grasses can help facilitate water infiltration into the soil. Theses sites are not associated with wetlands.
Wetland description
NA

Figure 8.
Soil features
Representative soil components for this ecological site include: Decordova, Newcastle, Vashti
The site is characterized by moderately deep to very deep loamy sand soils with a high infiltration rate.Table 4. Representative soil features
Parent material (1) Residuum – sandstone
(2) Alluvium – sandstone
(3) Residuum – claystone
(4) Alluvium – claystone
Surface texture (1) Loamy fine sand
(2) Stony loamy fine sand
Drainage class Moderately well drained to well drained Permeability class Slow to moderately rapid Soil depth 20 – 0 in Surface fragment cover <=3" 0 – 2 % Surface fragment cover >3" 0 – 2 % Available water capacity
(0-40in)4 – 7 in Electrical conductivity
(0-40in)0 – 2 mmhos/cm Sodium adsorption ratio
(0-40in)Not specified Soil reaction (1:1 water)
(0-40in)5.6 – 7.3 Subsurface fragment volume <=3"
(Depth not specified)0 – 5 % Subsurface fragment volume >3"
(Depth not specified)0 – 2 % Ecological dynamics
The reference plant community for the Loamy Sand ecological site is a tallgrass/midgrass oak savanna. Evidence of the historic vegetation can be found in the journals and records of explorers, military expeditions, and boundary survey teams.
Climate is a major factor influencing vegetation on the site. Long-term droughts lasting multiple years or growing seasons are infrequent, but when they do occur, they can have a negative impact on the vegetation. If abusive grazing occurs during or immediately following the drought period, the results can be devastating. The effects of erratic seasonal moisture and short-term dry spells lasting a few months are not as severe as those caused by long-term droughts. However, the lower the ecological status of the site, the greater the negative impact will be during drought periods regardless of duration.
Fire was an important part of the ecosystem. Most ecosystems in the North Central Prairie developed in a 4 to 6 year regime of recurring fires. Many of these fires resulted from lightning strikes during thunderstorms. Native Americans frequently set fires to manipulate the movement of bison and other animals as well as a defensive or offensive technique when dealing with their enemies. These historic fires were usually severe because of the amount of grass fuel available to carry the fire. The intensity of fires kept shrubs and sapling trees suppressed and allowed grasses and forbs to flourish. Tallgrass species are fire tolerant and are enhanced by periodic burning. Forbs usually increase for a year or two following these fires before the grasses become dominant again.
Prior to settlement, this site was subject to periodic grazing and browsing by vast herds of bison, wild cattle, wild horses, and deer. At times these grazing and browsing episodes were intense and severe, but periods of heavy use were followed by long periods of non-use as the herds migrated to fresh grazing areas before returning to previously grazed areas. The grazed areas had an opportunity to rest, regrow, regain vigor, and reproduce prior to the next grazing event. Intervals between grazing periods were frequently influenced by the amount of time that had elapsed since the last fire on the area.
As the region was settled, fire was reduced or eliminated and grasslands were fenced off to control movement and facilitate grazing by domestic livestock. As a result of abusive grazing or lack of grazing and/or the elimination of fire, in association with extreme climatic events, the tallgrass plant community has been eliminated or significantly altered on most Loamy Sand sites.
Lack of fire allows herbaceous vegetation to become senescent and may eventually lead to the loss of the most desirable species. The density and canopy of oaks, elms, shrubs, and greenbriar increase significantly in the absence of fire. Seedlings of non-native brush species and invasive weeds may encroach on the site from adjacent sites
Further deterioration leads to the loss of the perennial warm-season midgrass and forb plant community and an increase in short grasses, annuals, and bare ground. This provides the opportunity for woody species such as mesquite and juniper to encroach from adjacent sites.
Selective individual removal of unwanted trees and shrubs is relatively easy and more practical when brush plants initially appear on the site. The increase of brush can be fairly rapid and the plants per acre will soon become too numerous for individual control to be feasible. Once woody plants become mature or develop into dense stands, control is expensive, uneconomical, impractical, and difficult to achieve. Brush management is most successful using a systems approach. Initial treatment by mechanical methods can be followed by using approved herbicides, and using prescribed fire as a maintenance technique. Prescribed grazing with a reasonable stocking rate can sustain the grass species composition and production at a near reference community level.
Changes in plant communities and vegetation states on the Loamy Sand site are result of the combined influences of natural events (rainfall, temperature, droughts, etc.) and the accompanying management systems implemented on the area (prescribed fire, grazing management, and brush management).
Rangeland Health Reference Worksheets have been posted for this site on the Texas NRCS website (www.tx.nrcs.usda.gov) in Section II of the eFOTG under (F) Ecological Site Descriptions.
State and Transitional Pathways:
The State and Transition Diagram which follows provides information on some of the most typical pathways that the vegetation on this site can follow as the result of natural events, management inputs, and application of conservation treatments. There may be other plant communities that can exist on this site under certain conditions. Consultation with local experts and professionals is recommended prior to application of practices or management strategies in order to ensure that specific objectives will be met.State and transition model
Custom diagramStandard diagram
More interactive model formats are also available. View Interactive Models
More interactive model formats are also available. View Interactive Models
Click on state and transition labels to scroll to the respective textEcosystem states
State 1 submodel, plant communities
State 2 submodel, plant communities
State 3 submodel, plant communities
State 4 submodel, plant communities
State 1
Savanna State - ReferenceThe reference plant community for the Loamy Sand ecological site is a Tallgrass/Midgrass Savanna Community. In reference conditions, the site is dominated by tallgrasses. Midgrasses are also prominent on this site. An abundant variety of perennial forbs occur on this site. Trees, shrubs, and vines are a critical component of the plant community. Annual production ranges from 2500 to 5500 pounds per acre.
The Little Bluestem Dominant Community occurs when tallgrasses decline. Little bluestem is an opportunistic species on this site. In the absence of other tallgrasses, little bluestem becomes the dominant species and may eventually comprise as much as 60% of the plant community. Some midgrass species may increase on the site. The tree, shrub, and forb composition remain relatively stable in this stage. Annual production ranges from 2200 to 5000 pounds per acre.
The Midgrass Community is noted by a drastic shift in the herbaceous plant community. Little bluestem remains a significant component, but midgrasses and shortgrasses become dominant. Remnant populations of tallgrasses still occur in protected areas. Forbs increase, and invasive shrubs begin to encroach from adjacent sites. The annual production ranges from 2000 to 3400 pounds per acre.Dominant plant species
-
post oak (Quercus stellata), tree
-
Indiangrass (Sorghastrum nutans), grass
Community 1.1
Tall/Midgrass Savanna Community
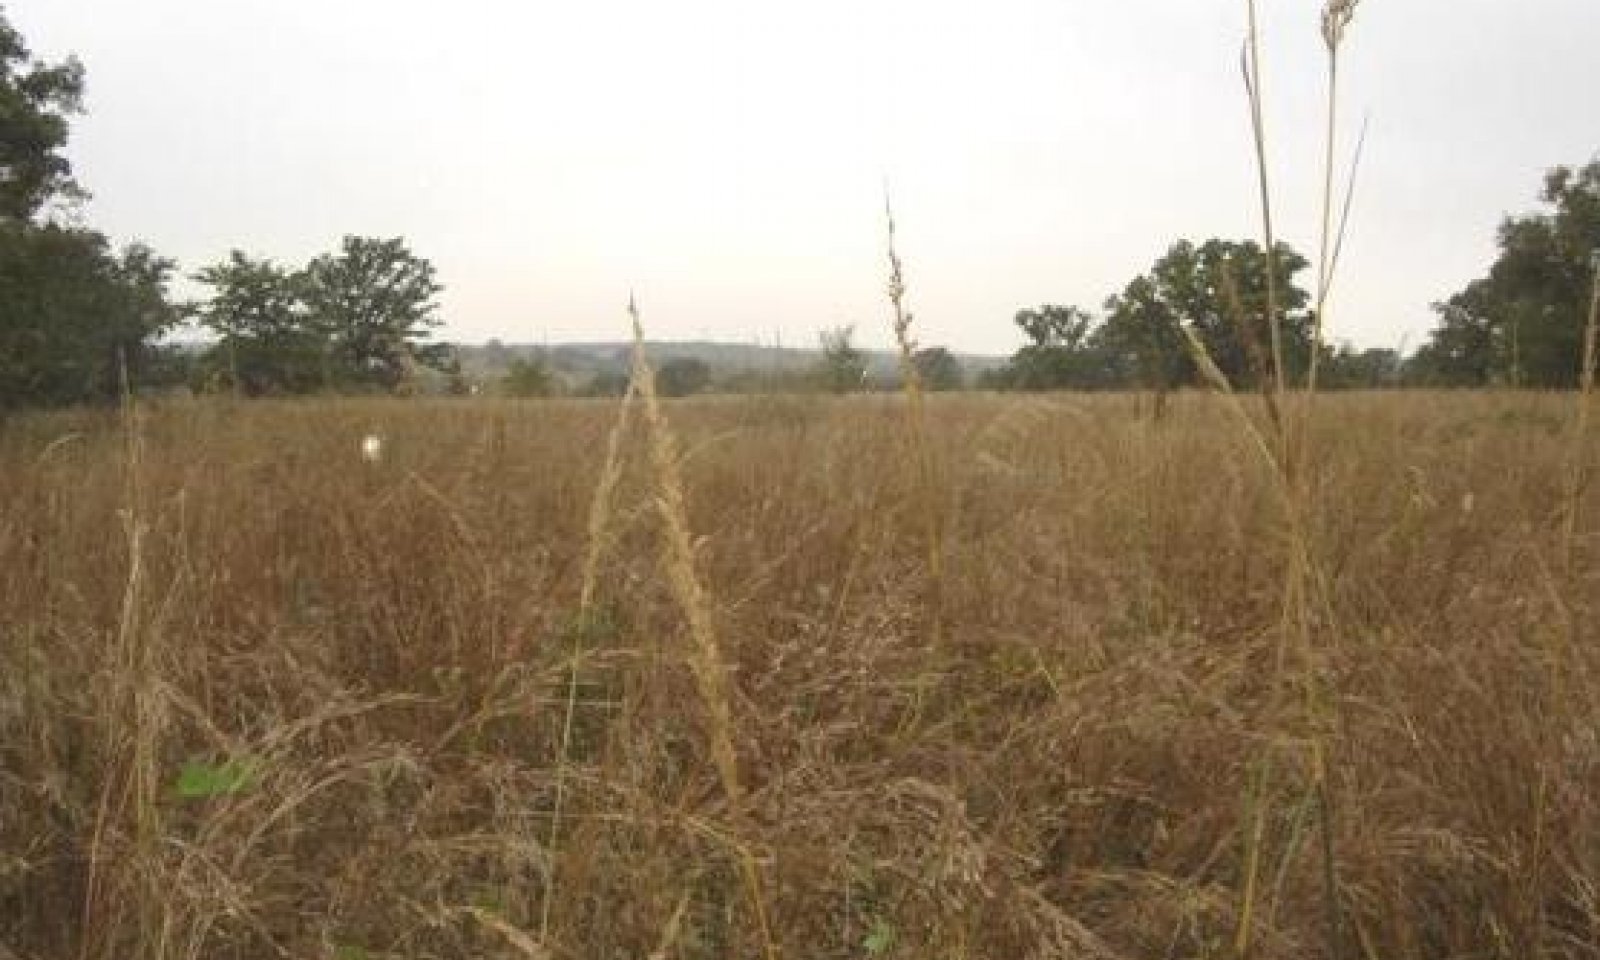
Figure 9. 1.1 Tall/Midgrass Savanna Community
The reference plant community for the Loamy Sand ecological site is a tallgrass/midgrass oak savanna. In this plant community, the site is dominated by tallgrasses including Indiangrass, big bluestem, and little bluestem which are co-dominants. Sideoats grama, dropseeds, sand lovegrass, silver bluestem, Arizona cottontop, blue grama, and Texas bluegrass are the most prominent midgrasses.
An abundant variety of perennial forbs occur on this site. The most common forbs are western ragweed, Engelmann’s daisy, Maximilian sunflower, gayfeather, bundleflower, sagewort, partridgepea, and sensitivebriar. Trees, shrubs, and vines are a critical component of the plant community. The Loamy Sand site is a savanna. Post oak, blackjack oak, several species of elms, hackberry, plums, and bumelia are distributed uniformly throughout the site. Annual production ranges from 2500 to 5500 pounds per acre.Figure 10. Annual production by plant type (representative values) or group (midpoint values)
Table 5. Annual production by plant type
Plant type Low
(lb/acre)Representative value
(lb/acre)High
(lb/acre)Grass/Grasslike 2000 3200 4400 Forb 300 400 500 Shrub/Vine 100 200 300 Tree 100 200 300 Total 2500 4000 5500 Figure 11. Plant community growth curve (percent production by month). TX3014 , Tall and mid-grass Savannah, 10 % canopy. Tall and mid grass savannah with some forbs and woody species..
Jan Feb Mar Apr May Jun Jul Aug Sep Oct Nov Dec J F M A M J J A S O N D 2 2 2 10 20 24 10 5 10 10 3 2 Community 1.2
Little Bluestem Dominant Community
Figure 12. 1.2 Little Bluestem Dominant Community
Uncontrolled grazing and the absence of fire eventually will lead to the decline of Indiangrass, big bluestem, and switchgrass. Little bluestem is an opportunistic species on this site. In the absence of other tallgrasses, little bluestem becomes the dominant species and may eventually comprise as much as 60% of the plant community. Some midgrass species such as sideoats grama, silver bluestem, dropseeds, and bristlegrass increase on the site. The tree, shrub, and forb composition remain relatively stable in this stage. Annual production ranges from 2200 to 5000 pounds per acre.
Figure 13. Annual production by plant type (representative values) or group (midpoint values)
Table 6. Annual production by plant type
Plant type Low
(lb/acre)Representative value
(lb/acre)High
(lb/acre)Grass/Grasslike 1700 2800 3900 Forb 300 450 600 Shrub/Vine 100 175 250 Tree 100 175 250 Total 2200 3600 5000 Figure 14. Plant community growth curve (percent production by month). TX3014 , Tall and mid-grass Savannah, 10 % canopy. Tall and mid grass savannah with some forbs and woody species..
Jan Feb Mar Apr May Jun Jul Aug Sep Oct Nov Dec J F M A M J J A S O N D 2 2 2 10 20 24 10 5 10 10 3 2 Community 1.3
Midgrass Community
Figure 15. 1.3 Midgrass Community
Heavy, continuous grazing and lack of fire result over an extended period of time result in a drastic shift in the herbaceous plant community. Little bluestem remains a significant component, but midgrasses and shortgrasses such as sideoats grama, silver bluestem, dropseeds, hairy grama, buffalograss, and threeawns become dominant. Remnant populations of tallgrasses still occur in protected areas. Western ragweed, gayfeather, and basketflower increase, and invasive shrubs begin to encroach from adjacent sites. The annual production ranges from 2000 to 3400 pounds per acre.
Figure 16. Annual production by plant type (representative values) or group (midpoint values)
Table 7. Annual production by plant type
Plant type Low
(lb/acre)Representative value
(lb/acre)High
(lb/acre)Grass/Grasslike 1200 1500 1800 Forb 400 600 800 Tree 300 400 500 Shrub/Vine 100 200 300 Total 2000 2700 3400 Figure 17. Plant community growth curve (percent production by month). TX3020 , Midgrass Savannah, 10% canopy. Midgrass savannah with 10 percent canopy cover. Continuous overgrazing led to the decline of tall grasses and the rise of the midgrass species..
Jan Feb Mar Apr May Jun Jul Aug Sep Oct Nov Dec J F M A M J J A S O N D 2 2 2 10 20 24 10 5 10 10 3 2 Pathway 1.1A
Community 1.1 to 1.2
Tall/Midgrass Savanna Community
Little Bluestem Dominant CommunityWith uncontrolled grazing pressure and no fires, the Tall/Midgrass Savanna Community will shift to the Little Bluestem Dominant Community.
Pathway 1.2A
Community 1.2 to 1.1
Little Bluestem Dominant Community
Tall/Midgrass Savanna CommunityWith Prescribed Grazing and Prescribed Burning conservation practices, the Little Bluestem Dominant Community can be shifted back to the Tallgrass/Midgrass Savanna Community.
Conservation practices
Prescribed Burning Prescribed Grazing Pathway 1.2B
Community 1.2 to 1.3
Little Bluestem Dominant Community
Midgrass CommunityWith heavy continuous grazing pressure and no fires, the Little Bluestem Dominant Community will shift to the Midgrass Savanna Community.
Pathway 1.3A
Community 1.3 to 1.2
Midgrass Community
Little Bluestem Dominant CommunityPrescribed Grazing and Prescribed Burning are several conservation practices that are required in order to shift the Midgrass Savanna Community back to the Little Bluestem Dominant Community.
Conservation practices
Prescribed Burning Prescribed Grazing State 2
Shrubland StateIn the Midgrass/Shrubland Community, the tallgrasses are almost completely eliminated and sideoats grama is severely reduced in this state. Midgrasses are the dominant grasses. Forbs increases significantly and broomweed invades the site. Trees and shrubs create a midstory canopy below the overstory of oaks, elms, and other trees. Total canopy exceeds 20%. Total annual production ranges from 1000 to 2000 pounds per acre.
Dominant plant species
-
post oak (Quercus stellata), tree
-
blackjack oak (Quercus marilandica), tree
-
elm (Ulmus), tree
-
sideoats grama (Bouteloua curtipendula), grass
Community 2.1
Midgrass/Shrubland Community
Figure 18. 2.1 Midgrass/Shrubland Community
Long-term abusive grazing or periodic heavy grazing accompanied by prolonged drought, and elimination of fire eventually result in the site being invaded by brush species encroaching from adjacent sites such as mesquite, pricklyash, lotebush, yucca, pricklypear, tasajillo, and greenbriar. Canopy cover exceeds 20%. Broomweed, western ragweed, and annual forbs are abundant. Dropseeds, silver bluestem, buffalograss, curlymesquite, and threeawns are the dominant grasses. Annual production ranges from 1000 to 2000 pounds per acre.
Figure 19. Annual production by plant type (representative values) or group (midpoint values)
Table 8. Annual production by plant type
Plant type Low
(lb/acre)Representative value
(lb/acre)High
(lb/acre)Forb 200 400 600 Grass/Grasslike 300 400 500 Tree 300 400 500 Shrub/Vine 200 300 400 Total 1000 1500 2000 Figure 20. Plant community growth curve (percent production by month). TX3030 , Mid/Shortgrass with Mesquite - Buffalograss . Mid and Short Grass with Mesquite; Buffalograss, Texas Wintergrass, and Meadow Dropseed..
Jan Feb Mar Apr May Jun Jul Aug Sep Oct Nov Dec J F M A M J J A S O N D 5 5 5 15 15 15 5 5 10 10 5 5 State 3
Woodland StateThe Oak Woodland Community has become a dense, thicketed woodland. The Loamy Sand site will develop a dense overstory of oaks, elms, hackberry, and other trees. Bumelia, pricklyash, sumacs, lotebush mesquite, and other shrubs form a dense midstory, and greenbriar can create an impenetrable thicket. Annual production ranges from 1000 to 2000 pounds per acre.
Dominant plant species
-
oak (Quercus), tree
-
elm (Ulmus), tree
-
hackberry (Celtis), tree
-
saw greenbrier (Smilax bona-nox), shrub
-
sumac (Rhus), shrub
-
Texas wintergrass (Nassella leucotricha), grass
Community 3.1
Oak Woodland Community
Figure 21. 3.1 Oak Woodland Community
Long-term abusive grazing or heavy continuous grazing accompanied by drought and lack of fire can cause this site to become a dense, thicketed woodland. The Loamy Sand site will develop a dense overstory of oaks, elms, hackberry, and other trees encompassing 40+% woody canopy cover. Bumelia, pricklyash, sumacs, lotebush mesquite, and other shrubs form a dense midstory, and greenbriar can create an impenetrable thicket. Drastic and expensive treatment methods are required to return this land to a productive state for most uses. Annual production ranges from 1000 to 2000 pounds per acre.
Figure 22. Annual production by plant type (representative values) or group (midpoint values)
Table 9. Annual production by plant type
Plant type Low
(lb/acre)Representative value
(lb/acre)High
(lb/acre)Shrub/Vine 400 500 600 Tree 300 400 500 Forb 150 300 450 Grass/Grasslike 150 300 450 Total 1000 1500 2000 Figure 23. Plant community growth curve (percent production by month). TX3048 , Post Oak Woodland Community. Post oak, elm, and hackberry dominate the overstory. Bumelia, pricklyash, sumac and greenbriar dominate the understory..
Jan Feb Mar Apr May Jun Jul Aug Sep Oct Nov Dec J F M A M J J A S O N D 1 1 2 20 30 20 5 5 8 6 1 1 State 4
Converted Land StateHundreds of thousands of acres have been plowed up and converted to cropland, pastureland, or hayland. This community is known as the Converted Land Community. Wheat is the primary annual crop. Bermudagrass is the primary introduced pasture species used in this area.
Abandoned croplands and reseeded areas tend to revert back to a more natural state through the process of secondary succession. This is a very slow process that takes decades or centuries to evolve, dependent on the status of the area at the time it is abandoned. The first plants to establish are “pioneer plants” (annual forbs and grasses followed by early successional shortgrasses and midgrasses). This community is known as the Abandoned Land Community.Dominant plant species
-
Bermudagrass (Cynodon dactylon), grass
Community 4.1
Converted Land Community
Figure 24. 4.1 Converted Land Community - Pastureland
The Loamy Sand site is one of the most frequently converted sites because of its relatively level topography and deep soils which are easy to work. Hundreds of thousands of acres have been plowed up and converted to cropland, pastureland, reseeded rangeland, or orchards. The soils are not inherently fertile and do not have a good soil-moisture-plant relationship, so they require high levels of fertility, aggressive weed control, and adequate moisture in order to produce to their potential. If managed properly, these soils can be very productive.
Small grains are the most commonly planted crops on these soils. Bermudagrass is the most frequently planted introduced pasture species. Weeping lovegrass was seeded on thousands of acres of this site in years past, but is rarely used in seedings today. Some areas which were previously cultivated or planted to introduced forage species have been seeded back to monocultures or mixtures of adapted native grasses to provide a more sustainable and diverse habitat for wildlife and livestock. Indiangrass, switchgrass, big bluestem, and sideoats grama are the species that are used most frequently. In some localized areas, peach and pecan orchards have been established on this site. Refer to Forage Suitability Group Descriptions and other guidance in the Texas NRCS website (www.tx.nrcs.usda.gov) and in the NRCS Electronic Field Office Technical Guide (eFOTG) for species adaptability, production guides, and management recommendations.
In the highest state of production following conversion, the trees, shrubs and forbs have been severely reduced or eliminated from the site. The more trees, shrubs, and forbs that occur on a converted site, the lower the overall production would be. The annual production figures below reflect this change.
Figure 25. Annual production by plant type (representative values) or group (midpoint values)
Table 10. Annual production by plant type
Plant type Low
(lb/acre)Representative value
(lb/acre)High
(lb/acre)Grass/Grasslike 2300 4100 5700 Forb 400 350 300 Shrub/Vine 100 50 0 Total 2800 4500 6000 Figure 26. Plant community growth curve (percent production by month). TX3002 , Cropland - Small Grains. Planted into small grains such as wheat or oats..
Jan Feb Mar Apr May Jun Jul Aug Sep Oct Nov Dec J F M A M J J A S O N D 5 16 21 19 5 0 0 0 0 8 18 8 Figure 27. Plant community growth curve (percent production by month). TX3037 , Converted Land Community. Planted to monocultures of introduced species, or monocultures or mixtures of commercially available native tallgrasses. .
Jan Feb Mar Apr May Jun Jul Aug Sep Oct Nov Dec J F M A M J J A S O N D 1 3 5 14 23 20 5 4 12 8 3 2 Community 4.2
Abandoned Land Community
Figure 28. 4.2 Abandoned Land Community
Thousands of acres of loamy sand soils that were previously broken out for cultivation have been abandoned due to drought and/or unstable economic conditions. When cropland fields or pastures are abandoned, the areas attempt to recover through the process of secondary succession.
This is a very slow process that takes decades or centuries dependent on the status of the area at the time it is abandoned. The first plants to establish are annual forbs and grasses followed by early successional shortgrasses and midgrasses. If managed properly, some of these abandoned areas may eventually begin to approximate the diversity and complexity of the native ecosystem. Midgrasses and perennial forbs may begin to establish if the area is carefully managed. However, it is highly unlikely that abandoned lands can ever return to reference vegetation within a reasonable period of time.Figure 29. Annual production by plant type (representative values) or group (midpoint values)
Table 11. Annual production by plant type
Plant type Low
(lb/acre)Representative value
(lb/acre)High
(lb/acre)Forb 400 500 600 Grass/Grasslike 300 400 500 Shrub/Vine 100 200 300 Total 800 1100 1400 Figure 30. Plant community growth curve (percent production by month). TX3038 , Abandoned Land Community. Abandoned croplands, pasturelands and seeded areas..
Jan Feb Mar Apr May Jun Jul Aug Sep Oct Nov Dec J F M A M J J A S O N D 3 4 8 16 18 12 4 4 10 12 6 3 Pathway 4.1A
Community 4.1 to 4.2
Converted Land Community
Abandoned Land CommunityWith abusive grazing, no fires, no brush management, idled land, no pasture/range/orchard/cropland management, the Converted Land Community will shift to the Abandoned Land Community.
Pathway 4.2A
Community 4.2 to 4.1
Abandoned Land Community
Converted Land CommunityWith the implementation of various conservation practices such as Prescribed Grazing, Prescribed Burning, Pasture/Crop/Orchard Management, Seedbed Preparation, and Range/Pasture/Tree Planting, the Abandoned Land Community can be shifted back to the Converted Land Community.
Conservation practices
Brush Management Conservation Crop Rotation Prescribed Burning Land Clearing Prescribed Grazing Range Planting Nutrient Management Integrated Pest Management (IPM) Transition T1A
State 1 to 2Abusive grazing pressure, no fires, and no brush management leads the transition from the Savanna State to the Shrubland State.
Transition T1B
State 1 to 4With Seedbed Preparation, Range Planting, Pasture Planting, Crop Cultivation, the Savanna State can transition into the Converted Land State.
Restoration pathway R2A
State 2 to 1With Prescribed Grazing, Prescribed Burning, Seedbed Preparation, and Range Planting, the Shrubland State can be restored to the Savanna State.
Conservation practices
Brush Management Prescribed Burning Prescribed Grazing Range Planting Transition T2A
State 2 to 3With Abusive Grazing, No Fires, and No Brush Management, the Shrubland State will shift to the Woodland State.
Transition T2B
State 2 to 4With Brush Management, Seedbed Preparation, Range Planting, Pasture Planting, and Crop Cultivation, the Shrubland State can transition into the Converted Land State.
Restoration pathway R3A
State 3 to 2With Prescribed Grazing, Prescribed Burning, Brush Management, Seedbed Preparation, and Range Planting, the Woodland State can be restored to the Shrubland State.
Conservation practices
Brush Management Prescribed Burning Prescribed Grazing Range Planting Transition T3A
State 3 to 4With Brush Management, Seedbed Preparation, Range Planting, Pasture Planting, Crop Cultivation and Orchards, the Woodland State can transition into the Converted Land State.
Additional community tables
Table 12. Community 1.1 plant community composition
Group Common name Symbol Scientific name Annual production () Foliar cover (%) Grass/Grasslike1 Tallgrass 500–1500 little bluestem SCSC Schizachyrium scoparium 500–1500 – 2 Tallgrasses 100–1500 big bluestem ANGE Andropogon gerardii 100–1500 – switchgrass PAVI2 Panicum virgatum 0–1500 – Indiangrass SONU2 Sorghastrum nutans 100–1500 – purpletop tridens TRFL2 Tridens flavus 0–500 – 3 Midgrasses 500–1000 sideoats grama BOCU Bouteloua curtipendula 250–1000 – sand lovegrass ERTR3 Eragrostis trichodes 250–1000 – Texas wintergrass NALE3 Nassella leucotricha 0–250 – Texas bluegrass POAR Poa arachnifera 0–250 – yellow foxtail SEPUP2 Setaria pumila ssp. pumila 0–250 – composite dropseed SPCOC2 Sporobolus compositus var. compositus 100–250 – Drummond's dropseed SPCOD3 Sporobolus compositus var. drummondii 0–250 – sand dropseed SPCR Sporobolus cryptandrus 100–250 – silver beardgrass BOLAT Bothriochloa laguroides ssp. torreyana 100–250 – Arizona cottontop DICA8 Digitaria californica 0–250 – Canada wildrye ELCA4 Elymus canadensis 0–250 – plains lovegrass ERIN Eragrostis intermedia 0–250 – fringed signalgrass URCI Urochloa ciliatissima 0–100 – thin paspalum PASE5 Paspalum setaceum 0–100 – 4 Mid/shortgrasses 100–500 blue grama BOGR2 Bouteloua gracilis 0–250 – Scribner's rosette grass DIOLS Dichanthelium oligosanthes var. scribnerianum 0–250 – hooded windmill grass CHCU2 Chloris cucullata 0–250 – tumble windmill grass CHVE2 Chloris verticillata 0–150 – fall witchgrass DICO6 Digitaria cognata 0–150 – red lovegrass ERSEO Eragrostis secundiflora ssp. oxylepis 0–150 – curly-mesquite HIBE Hilaria belangeri 0–150 – hairy grama BOHI2 Bouteloua hirsuta 0–150 – purple threeawn ARPUP6 Aristida purpurea var. purpurea 0–150 – Wright's threeawn ARPUW Aristida purpurea var. wrightii 0–150 – buffalograss BODA2 Bouteloua dactyloides 0–150 – Forb5 Forbs 250–500 Cuman ragweed AMPS Ambrosia psilostachya 0–250 – Engelmann's daisy ENPE4 Engelmannia peristenia 0–250 – Maximilian sunflower HEMA2 Helianthus maximiliani 0–250 – partridge pea CHFA2 Chamaecrista fasciculata 0–100 – white sagebrush ARLUM2 Artemisia ludoviciana ssp. mexicana 0–100 – Illinois bundleflower DEIL Desmanthus illinoensis 0–100 – bractless blazingstar MENU Mentzelia nuda 0–50 – Nuttall's sensitive-briar MINU6 Mimosa nuttallii 0–50 – yellow puff NELU2 Neptunia lutea 0–50 – evening primrose OENOT Oenothera 0–50 – groundcherry PHYSA Physalis 0–50 – scurfpea PSORA2 Psoralidium 0–50 – pitcher sage SAAZG Salvia azurea var. grandiflora 0–50 – globemallow SPHAE Sphaeralcea 0–50 – amberique-bean STHE9 Strophostyles helvola 0–50 – white heath aster SYERE Symphyotrichum ericoides var. ericoides 0–50 – prairie spiderwort TROC Tradescantia occidentalis 0–50 – Texas vervain VEHA Verbena halei 0–50 – purple poppymallow CAIN2 Callirhoe involucrata 0–50 – yellow sundrops CASE12 Calylophus serrulatus 0–50 – bluestem pricklypoppy ARAL3 Argemone albiflora 0–50 – whitemouth dayflower COER Commelina erecta 0–50 – prairie clover DALEA Dalea 0–50 – purple prairie clover DAPU5 Dalea purpurea 0–50 – hymenopappus HYMEN4 Hymenopappus 0–50 – lespedeza LESPE Lespedeza 0–50 – buckwheat ERIOG Eriogonum 0–50 – beeblossom GAURA Gaura 0–50 – Shrub/Vine6 Shrubs/Vines 100–300 plum PRUNU Prunus 0–100 – skunkbush sumac RHTR Rhus trilobata 0–100 – gum bully SILA20 Sideroxylon lanuginosum 0–100 – pricklyash ZANTH Zanthoxylum 0–100 – greenbrier SMILA2 Smilax 0–50 – yucca YUCCA Yucca 0–50 – catclaw acacia ACGRG3 Acacia greggii var. greggii 0–50 – Christmas cactus CYLE8 Cylindropuntia leptocaulis 0–50 – pricklypear OPUNT Opuntia 0–50 – Tree7 Trees 100–300 post oak QUST Quercus stellata 100–500 – American elm ULAM Ulmus americana 0–100 – sugarberry CELAL Celtis laevigata var. laevigata 0–100 – netleaf hackberry CELAR Celtis laevigata var. reticulata 0–100 – honey mesquite PRGL2 Prosopis glandulosa 0–100 – blackjack oak QUMA3 Quercus marilandica 0–100 – ash FRAXI Fraxinus 0–50 – slippery elm ULRU Ulmus rubra 0–50 – wingleaf soapberry SASA4 Sapindus saponaria 0–50 – winged elm ULAL Ulmus alata 0–50 – Table 13. Community 1.2 plant community composition
Group Common name Symbol Scientific name Annual production () Foliar cover (%) Table 14. Community 1.3 plant community composition
Group Common name Symbol Scientific name Annual production () Foliar cover (%) Table 15. Community 2.1 plant community composition
Group Common name Symbol Scientific name Annual production () Foliar cover (%) Table 16. Community 3.1 plant community composition
Group Common name Symbol Scientific name Annual production () Foliar cover (%) Table 17. Community 4.1 plant community composition
Group Common name Symbol Scientific name Annual production () Foliar cover (%) Table 18. Community 4.2 plant community composition
Group Common name Symbol Scientific name Annual production () Foliar cover (%) Interpretations
Animal community
Historically, the Loamy Sand site was inhabited permanently and intermittently by a wide variety of mammals, reptiles, and birds. Several historical references and journals written in the 18th and 19th century by explorers, survey parties, and military expeditions refer to herds of bison, wild cattle, wild horses, and antelope roaming freely across the North Central Prairie and adjacent regions.
Currently, the site is utilized by deer, quail, dove, numerous species of birds, and a variety of small fur-bearing mammals. Animal species and populations fluctuate as the vegetation cycles through temporary phases and different ecological stages.
Livestock grazing should be controlled by implementing grazing management systems that incorporate frequent and timely deferment periods to prevent abusive grazing.Hydrological functions
When herbaceous vegetation and ground cover are maintained in a healthy and vigorous status, water infiltration into the soil profile is increased significantly, resulting in less runoff. A thick, healthy grass cover also results in improved water quality because it serves as a filter or trap to reduce sediments and pollutants before the water flows offsite.
Recreational uses
These scenic areas offer outdoor activities including photography, shaded picnic areas, bird watching, hiking, camping, horseback riding, and off-road vehicle use. The site offers opportunities for hunting hunting quail, dove, deer, and turkey because of its diverse plant communities, abundance of forbs, and variety of trees and shrubs.
Wood products
Post oak, elms, and hackberry have limited value as fence posts, firewood, specialty products, and crafts.
Other products
None.
Other information
None.
Supporting information
Inventory data references
Vegetation data for this site was obtained from existing Range Site Descriptions, SCS-RANGE -417 Production and Composition Records for Native Grazing Lands, and on-site inventories by the author and local experts including ranchers, natural resource specialists from federal and state agencies, and personnel from cooperating agencies and organizations. A total of 7 SCS-RANGE-417’s containing data collected from 3 counties during the period 12/30/1981 to 12/12/1986 were reviewed for this site.
References
-
. 2021 (Date accessed). USDA PLANTS Database. http://plants.usda.gov.
-
Bailey, V. 1905. Biological Survey of Texas. North American Fauna 25:1–222.
Other references
Ajilvsgi, Geyata. Wildflowers of Texas. Sharer Publishing, Bryan, TX. 1984.
Bachand, Richard. The American Prairie: Going, Going, Gone? National Wildlife Federation. Rocky Mountain Natural Resource Center. Boulder, CO. 2001.
Coffey, Chuck R., and Russell Stevens. Grasses of Southern Oklahoma and North Texas: A Pictorial Guide. The Samuel Roberts Noble Foundation, Ardmore, OK. 2004
Diggs, George M., Jr., Barney L. Lipscomb, and Robert J. O’Kennon. Illustrated Flora of North Central Texas. Botanical Research Institute of Texas. Fort Worth, TX 1999.
Egan, Dave and Evelyn A. Howell. The Historical Ecology Handbook…A Restorationist’s Guide to Reference Ecosystems. Island Press, Washington, DC. 2001.
Enquist, Marshall. Wildflowers of the Texas Hill Country. Lone Star Botanical, Austin, TX. 1987.
Flores, Dan. “Indian Use of Range Resources” presented at 20th Annual Ranch Management Conference. Lubbock, TX, September 30, 1983.
Gould, Frank W., The Grasses of Texas. Texas A&M University Press, College Station, TX. 1975.
Hatch, Stephan L., Kancheepuram N. Gandhi, and Larry E. Brown. Checklist of the Vascular Plants of Texas. Texas Agricultural Experiment Station MP-1655. College Station, TX. 1990
Hatch, Stephan L., Jennifer Pluhar. Texas Range Plants. Texas A&M University Press, College Station, TX. 1993.
Kelton, Elmer. “History of Rancher Use of Range Resources” presented at 20th Annual Ranch Management Conference. Lubbock, TX, September 30, 1983.
Ladd, Doug. Tallgrass Prairie Wildflowers. Falcon Press, Helena and Billings, MT. 1995.
Larrabee, Aimee and John Altman. Last Stand of the Tallgrass Prairie. Sterling Publishing Co., New York, NY. 2001.
Merz, Dalton. Personal communication. 9/29/2007.
Nelson, Paul W. The Terrestrial Natural Communities of Missouri. Missouri Department of Natural Resources. 1985.
Packard, Stephen and Cornelia F. Mutel. The Tallgrass Restoration Handbook for Prairies, Savannas, and Woodlands. Island Press, Washington, DC. 1997.
Parker, W.B. Through Unexplored Texas In The Summer and Fall of 1854. The Texas State Historical Commission. Austin, TX 1984
Smith, Jared G. Grazing Problems in the Southwest and How to Meet Them. United States Department of Agriculture Division of Agrostology. Washington, DC. 1899.
Texas Almanac Sesquicentennial Edition 1857-2007. Dallas Morning News. Dallas, TX. 2006.
Tyrl, Ronald J., Terrence G. Bidwell, and Ronald E. Masters. Field Guide to Oklahoma Plants. Oklahoma State University, Stillwater, OK. 2002.
United States Department of Agriculture Natural Resources Conservation Service, National Plant Data Center, Baton Rouge, LA. The PLANTS Database. http://plants.usda.gov 2007.
United States Department of Agriculture Natural Resources Conservation Service, Ag Handbook 296. Land Resource Regions and Major Land Resource Areas of the United States, the Caribbean, and the Pacific Basin. 2006.
United States Department of Agriculture Natural Resources Conservation Service, Temple, TX. Loamy Sand Ecological Site Descriptions R078BY082TX and R084BY171TX. 2006.
United States Department of Agriculture Soil Conservation Service, Temple, TX. Production and Composition Record for Native Grazing Lands. SCS-RANGE 417 data from Brown, Eastland, Jack, Stephens, and Young Counties. 1981-1986.
United States Department of Agriculture Soil Conservation Service, Washington, DC. Web Soil Survey http://websoilsurvey.nrcs.usda.gov/app/. 2007
United States Department of Agriculture Soil Conservation Service, Temple, TX. Published Soil Surveys: Brown and Mills, Jack, Palo Pinto, Stephens, and Young Counties. Various publication dates.
United States Department of Agriculture Soil Conservation Service, Temple, TX. Range Site Descriptions for the North Central Prairie counties. Various publication dates.
Vines, Robert A. Trees of North Texas. University of Texas Press, Austin, TX. 1982
Weniger, Del. The Explorers’ Texas. Eakin Publications. Austin, TX. 1984.
Williams, Gerald W. References On The American Indian Use Of Fire in Ecosystems. United States Department of Agriculture – Forest Service, Washington, DC. 2005.
ACKNOWLEDGEMENTS: I would like to express my thanks and appreciation to the following for their cooperation, assistance, and support in the development of this Ecological Site Description:
Tony Dean, NRCS – Henrietta, TX
Matt Gregory, NRCS – Jacksboro, TX
John Paclik, NRCS – Graham, TX
Richards Ranch – Jacksboro, TX
Reviewers:
Lem Creswell, RMS, NRCS, Weatherford, Texas
Justin Clary, RMS, NRCS, Temple, TexasContributors
Dan Caudle, DMC Natural Resources Management, Weatherford Texas
Approval
Bryan Christensen, 9/19/2023
Acknowledgments
Site Development and Testing Plan: Future work, as described in a Project Plan, to validate the information in this Provisional Ecological Site Description is needed. This will include field activities to collect low, medium and high intensity sampling, soil correlations, and analysis of that data. Annual field reviews should be done by soil scientists and vegetation specialists. A final field review, peer review, quality control, and quality assurance reviews of the ESD will be needed to produce the final document. Annual reviews of the Project Plan are to be conducted by the Ecological Site Technical Team.
Rangeland health reference sheet
Interpreting Indicators of Rangeland Health is a qualitative assessment protocol used to determine ecosystem condition based on benchmark characteristics described in the Reference Sheet. A suite of 17 (or more) indicators are typically considered in an assessment. The ecological site(s) representative of an assessment location must be known prior to applying the protocol and must be verified based on soils and climate. Current plant community cannot be used to identify the ecological site.
Author(s)/participant(s) Lem Creswell, Zone RMS, NRCS, Weatherford, Texas Contact for lead author 817-596-2865 Date 10/22/2007 Approved by Approval date Composition (Indicators 10 and 12) based on Annual Production Indicators
-
Number and extent of rills:
None. -
Presence of water flow patterns:
Deposition or erosion is uncommon during normal rainfall events, but may occur in limited areas during intense rainfall events. -
Number and height of erosional pedestals or terracettes:
None. -
Bare ground from Ecological Site Description or other studies (rock, litter, lichen, moss, plant canopy are not bare ground):
Expect no more than 10% bare ground scattered randomly throughout the site. -
Number of gullies and erosion associated with gullies:
Few rills and very few gullies may occur on sidedrains into perennial and intermittent streams. Gullies and rills should be vegetated and stable. -
Extent of wind scoured, blowouts and/or depositional areas:
Uncommon. -
Amount of litter movement (describe size and distance expected to travel):
Little or no litter movement or deposition during normal rainfall events. -
Soil surface (top few mm) resistance to erosion (stability values are averages - most sites will show a range of values):
Soil surface is moderately susceptible to wind erosion in this MLRA. -
Soil surface structure and SOM content (include type of structure and A-horizon color and thickness):
0-8" thick - weak, fine granular structure. SOM is approximately 1-6%. See Official Series Description for more information. -
Effect of community phase composition (relative proportion of different functional groups) and spatial distribution on infiltration and runoff:
The tallgrass/midgrass savanna with abundant forbs, adequate litter, and little bare ground provides for maximum infiltration and negligible runoff. -
Presence and thickness of compaction layer (usually none; describe soil profile features which may be mistaken for compaction on this site):
None. -
Functional/Structural Groups (list in order of descending dominance by above-ground annual-production or live foliar cover using symbols: >>, >, = to indicate much greater than, greater than, and equal to):
Dominant:
Warm-season tallgrasses >> warm-season midgrasses >Sub-dominant:
Warm-season midgrasses > Trees >Other:
Forbs > Shrubs/Vines > Cool-season grassesAdditional:
-
Amount of plant mortality and decadence (include which functional groups are expected to show mortality or decadence):
Perennial grasses will naturally exhibit a minor amount (less than 5%) of senescence and some mortality every year. -
Average percent litter cover (%) and depth ( in):
Litter is dominantly herbaceous. -
Expected annual annual-production (this is TOTAL above-ground annual-production, not just forage annual-production):
2000 to 5500 pounds per acre. -
Potential invasive (including noxious) species (native and non-native). List species which BOTH characterize degraded states and have the potential to become a dominant or co-dominant species on the ecological site if their future establishment and growth is not actively controlled by management interventions. Species that become dominant for only one to several years (e.g., short-term response to drought or wildfire) are not invasive plants. Note that unlike other indicators, we are describing what is NOT expected in the reference state for the ecological site:
Mesquite, pricklypear, yucca, tasajillo, pricklyash, lotebush, bermudagrass, johnsongrass, King Ranch bluestem, weeping lovegrass, annual broomweed -
Perennial plant reproductive capability:
All perennial species should be capable of reproducing every year unless disrupted by extended drought, overgrazing, wildfire, insect damage, or other events occuring immediately prior to, or during the reproductive phase.
Print Options
Sections
Font
AAAAOther
PrintThe Ecosystem Dynamics Interpretive Tool is an information system framework developed by the USDA-ARS Jornada Experimental Range, USDA Natural Resources Conservation Service, and New Mexico State University.
Accessibility statement