
Natural Resources
Conservation Service
Ecological site R078CY025OK
Depressional Upland
Last updated: 9/15/2023
Accessed: 10/15/2026
-
Search


Major Land Resource Area or ecological site by name and/or ID.
PreviousSectionsNextGeneral information
Provisional. A provisional ecological site description has undergone quality control and quality assurance review. It contains a working state and transition model and enough information to identify the ecological site.
Click to explore map
Figure 1. Mapped extent
Areas shown in blue indicate the maximum mapped extent of this ecological site. Other ecological sites likely occur within the highlighted areas. It is also possible for this ecological site to occur outside of highlighted areas if detailed soil survey has not been completed or recently updated.
MLRA notes
Major Land Resource Area (MLRA): 078C–Central Rolling Red Plains, Eastern Part
MLRA 78C is characterized by moderately dissected, rolling plains with prominent ridges and valleys and numerous terraces adjacent to dissecting streams. Loamy and clayey soils are generally deep, well drained, and developed in calcareous and gypsiferous sediments of Permian age.
LRU notes
NA
Classification relationships
This ecological site is correlated to soil components at the Major Land Resource Area (MLRA) level which is further described in USDA Ag Handbook 296.
Ecological site concept
These sites are small depressional areas that often occur among the hummocky sands in the northern half of MLRA 78C. They are sometimes referred to as “Carwile Depressions” as the Carwile series is the soil that these sites occur on. These soils are typically finer in texture than the surrounding soils and tend to perch water in the upper profile for periods during the year. A mixture of tallgrasses and Shortgrasses may dominate most areas in the reference state, while the lowest areas may support more hydrophytic vegetation. Brush encroachment can become an issue in the absence of fire and overutilization by grazing animals can lead to a change in the plant community toward less palatable mid and shortgrass species. In some areas, the soil may experience salt deposition and become dominated by salt tolerant species.
The distribution of these sites is primarily along the sand sheets that lie on the north side of the major rivers including the North and South Canadian, Cimarron, and Red rivers.
While these sites are often inclusional areas and can be quite small in extent, they may warrant special consideration when making management decisions.Associated sites
R078CY107TX Sand Hills 23-31" PZ
Adjacent sites. Course textured soils of higher relief. Not episaturated.
Table 1. Dominant plant species
Tree (1) salix nigra
Shrub Not specified
Herbaceous (1) Panicum virgatum
(2) Bouteloua gracilisPhysiographic features
These sites occur on nearly level or concave treads of stream terraces, or depressions of sand sheets on alluvial plains.

Figure 2. R078CY025OK
Table 2. Representative physiographic features
Landforms (1) Alluvial plain > Depression
Runoff class Negligible Flooding frequency None Ponding duration Long (7 to 30 days) Ponding frequency Frequent Elevation 1000 – 2200 ft Slope 0 – 1 % Ponding depth 0 – 12 in Water table depth 0 – 36 in Aspect Aspect is not a significant factor Climatic features
MLRA 78C lies within the subtropical sub-humid climate regime. This regime is characterized by rapid changes in temperature; marked extremes, both daily and annual; and rather erratic rainfall. The weather is alternately influenced by cold dry air from the Arctic Circle, and warm moist air from the Gulf of Mexico.
Seasonal changes are gradual. Spring is a season of variable weather and relatively high precipitation with prevailing winds from the southwest. Summers are generally hot with low humidity. Fall has long periods of pleasant weather interspersed with moderate to heavy rains. Winter is open and moderate to cold with winds from the north and infrequent snows.
Wind speeds average more than eleven miles an hour with prevailing southern winds. Rather strong winds can occur in all months of the year. While strong gusty winds occur, severe dust storms are rare.
Approximately 75 percent of the rainfall occurs during the warm season, and much of it comes in storms of high intensity and short duration in May and June. These rains can be particularly erosive on sites where vegetation is sparse. Occasional droughts are to be expected. Lack of rainfall and hot, dry winds often curtail forage production during July and August.Table 3 Representative climatic features
Frost-free period (characteristic range) 150-180 days Freeze-free period (characteristic range) 190-200 days Precipitation total (characteristic range) 30-30 in Frost-free period (actual range) 140-190 days Freeze-free period (actual range) 180-210 days Precipitation total (actual range) 30-30 in Frost-free period (average) 160 days Freeze-free period (average) 190 days Precipitation total (average) 30 in Characteristic rangeActual rangeBarLineFigure 3. Monthly precipitation range
Characteristic rangeActual rangeBarLineFigure 4. Monthly minimum temperature range
Characteristic rangeActual rangeBarLineFigure 5. Monthly maximum temperature range
BarLineFigure 6. Monthly average minimum and maximum temperature
Figure 7. Annual precipitation pattern
Figure 8 Annual average temperature pattern
Climate stations used
-
(1) FREDERICK [USC00343353], Frederick, OK
-
(2) BUFFALO 2 SSW [USC00341243], Buffalo, OK
-
(3) CHEROKEE 4W [USC00341724], Cherokee, OK
-
(4) TALOGA [USC00348708], Taloga, OK
-
(5) ARNETT 3NE [USC00340332], Arnett, OK
-
(6) HOBART MUNI AP [USW00093986], Hobart, OK
-
(7) FREEDOM [USC00343358], Freedom, OK
">Influencing water features
The Carwile soil series is listed on the national hydric soils list. There are sometimes areas of wetland vegetation found on these depressional upland sites due to the presence of ponded and/or saturated surface layers. Consult a trained specialist when attempting to delineate wetland areas.
Soil features
Soils are mapped for each county within the MLRA. Mapunits are representations of the major soil series component(s) and named accordingly. Each Mapunit is spatially represented on a digital soils map as polygons of different shapes and sizes. Within these Mapunits, there are often minor soil series components included. These minor components are soils that occur within a Mapunit polygon but are of small extent (15% or less of the Mapunit area). However, it is difficult to separate these minor soils spatially due to the scale of soil mapping.
Ecological sites are correlated at the component level of the soil survey. Therefore, a single Mapunit may contain multiple Ecological Sites just as it may contain multiple soil components. This is important to understand when investigating soils and Ecological Sites. A soil survey Mapunit may be correlated to a single Ecological Site based on the major component; however, there may be inclusional areas of additional Ecological Sites which are correlated to the minor components of that particular soil Mapunit.
Representative soils for this site include:
Carwile Loam
The Carwile series consists of very deep, poorly drained, slowly permeable soils that formed in loamy alluvium or eolian sediments of Pleistocene age. They are classified as Fine, mixed, superactive, thermic Typic Argiaquolls.Table 4. Representative soil features
Parent material (1) Alluvium – sandstone and shale
Surface texture (1) Loam
Family particle size (1) Loamy
Drainage class Poorly drained Permeability class Slow to moderately rapid Soil depth 80 in Surface fragment cover <=3" Not specified Surface fragment cover >3" Not specified Available water capacity
(0-40in)4.2 – 7.9 in Calcium carbonate equivalent
(0-40in)0 – 5 % Electrical conductivity
(0-40in)Not specified Sodium adsorption ratio
(0-40in)Not specified Soil reaction (1:1 water)
(0-40in)5.1 – 8.4 Subsurface fragment volume <=3"
(Depth not specified)0 – 1 % Subsurface fragment volume >3"
(Depth not specified)Not specified Ecological dynamics
The information in this ecological site description (ESD), including the state-and-transition model (STM), was developed using archeological and historical data, professional experience, and scientific studies. It is representative of a complex set of plant communities. Not all scenarios or plants are included. Key indicator plants, animals, and ecological processes are described to inform land management decisions.
These sites are often quite small in extent. They are commonly represented on soils maps as minor components of the more dominant sandy soils. However, due the unique plant communities, ecological dynamics, and hydrology, they warrant identification and description.
This ecological site lies within the sand sheet areas predominately north of major river courses in Northern 78C. These eolian or “windblown” deposits are dominated by dune and hummocky sandhill topography with occasional concave depressional areas. It is in the depressional areas where the Depressional Upland ecological site occurs. In contrast to the surrounding course textured soils of the rolling sand hills and dunes, these sites occur on the Carwile soils with a much higher clay content. Because of this increase in clay content, the vegetation can change abruptly. While Sand Sagebrush (Artemisia filifolia) thrives in the deep sandy soils, it rarely grows in these depressional areas of finer soil that tend to pond water. The presence of saturated soil conditions also allows for the growth of more hydrophytic plants not commonly seen in the adjacent sandy areas. Some of these include smartweed (Polygonum spp.), Frogfruit (Phylla spp.), and Willow(Salix spp).
It is also the nature of the periodically saturated clay soils that influence the overall plant community. The reference plant community can vary season to season and year to year, depending on climatic patterns. In contrast to the deep rooted tallgrasses on the adjacent sandy soils, a large portion of the plant community consists of short grasses such as Blue Grama(Bouteloua gracilis) and Buffalograss(Bouteloua dactyloides) that can tolerate inundation for longer periods of time. However, there are mid and tallgrass species that also persist in these depressional areas. Switchgrass(Panicum virgatum), Western Wheatgrass(Pascopyrum smithii), and Vine Mesquite(Panicum obtusum) may all thrive in these areas also.
While woody species are not common in the reference state of this ecosite, some areas may be subjected to invasion by Black Willow, Willow Baccharis, or even Cottonwood if fire is excluded from the ecosystem. This type of woody invasion is more common as you move from west to east across the extent of the ecological site.
In some instances these concave areas were farmed along with the adjacent sandy land and some areas have been put back to introduced pasture. Due to the topography and convenience, many of these sites are the chosen location for windmill and livestock watering tanks.
A state-and-transition model diagram for the Depressional Upland ecological site is shown after this narrative. The descriptions of each state, transition, community phase, and community pathway follow the model. The model is based on expert evaluation of available experimental research, field observations, professional consensus, and interpretations. It is likely to change as knowledge increases.
Plant community response differs across the MLRA because of the naturally occurring variability in weather, soils, and aspect. The reference community phase is not necessarily the management goal. Other vegetative states may be desired plant communities if range health assessments are in the moderate category and above. The biological processes on this site are complex. Representative values are therefore presented in a land management context. The species lists are representative. They are not botanical descriptions of all species occurring, or potentially occurring, on this site. They are not intended to cover every situation or the full range of conditions, species, and responses for the site.
Percent species composition by weight, percent canopy cover, and other metrics may be described. Most observers find it easier to visualize or estimate percent canopy for woody species (trees and shrubs) than to visualize or estimate production by weight. Because of the influence of shade and interception of rainfall, canopy cover can drive the transitions between communities and states. Species composition by dry weight is used for describing the herbaceous community and the community as a whole. Woody species are included in species composition for the site.State and transition model
More interactive model formats are also available. View Interactive Models
Click on state and transition labels to scroll to the respective textT1A - Absence of disturbance and natural regeneration over time, may be coupled with excessive grazing pressure T1B - Extensive soil disturbance followed by seeding R2A - Removal of woody canopy, followed by reintroduction of historic disturbance regimes T3A - Absence of disturbance and natural regeneration over time State 1 submodel, plant communities
State 2 submodel, plant communities
State 3 submodel, plant communities
State 4 submodel, plant communities
State 1
GrasslandThis is the representative state for the Depressional Upland ecological site. It represents the natural variability in plant communities under the evolutionary disturbance regime. The plant communities within this state have been subjected to periodic fires and grazing events with varying lengths of rest periods. Woody species, if present, are generally less than 10 percent canopy cover. This is in contrast with the surrounding sand hills where sagebrush and sandplum may be 10 to 20 percent canopy in the reference state of the Rolling Sands ecosite. This ecological state supports a mixture of grasses and forbs and maintains a resilient plant community under natural conditions.
Community 1.1
Mixedgrass
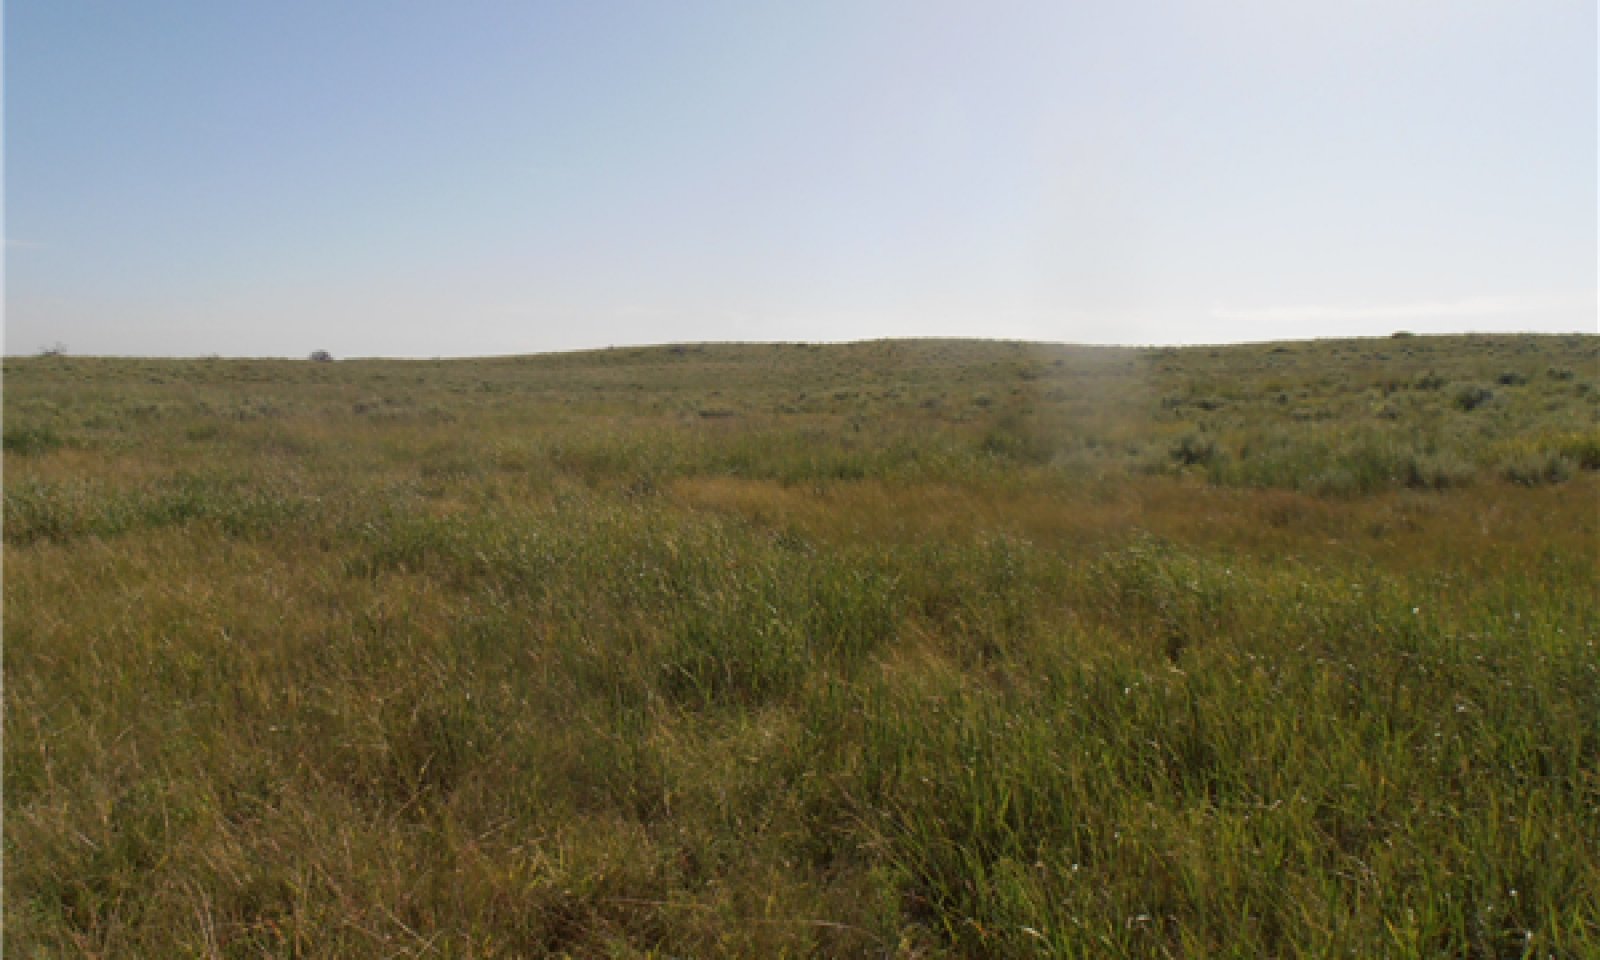
Figure 9. Community phase 1.1. Carwile Soils. Woodward County, OK 2015

Figure 10. Carwile Soils. Woodward County, OK 2015
This plant community is dominated by a mixture of grass and forb species adapted to periodically saturated growing conditions. Due to the concave topography of these sites, it is not uncommon to observe distinct changes in species across the site due to the changes in wetness. In the lowest points, hydrophytic species such as Frogfruit (Phyla spp.) smartweed (Polygonum spp.) and spikerush (Eleocharis spp.) are quite common as these areas stay wet for longer periods of time. Some shortgrass species adapted to periodic inundation may also persist in the wettest areas. Mid and tallgrass species including Switchgrass, Western Wheatgrass, and Canada Wildrye thrive in areas across the site. Major forbs may include Blanketflower (Gaillardia spp.), Golden Tickseed (Coreopsis tinctoria), Sagewort (Artemisia ludoviciana), and Western Ragweed (Ambrosia psilostachya). Woody species, if present, may include Black Willow (Salix nigra), Willow Baccharis (Baccharis salcina), and occasionally coralberry (Symphoricarpos orbiculatus) towards the eastern extent of the site.
Like most sites in the Great Plains, this plant community evolved under periodic disturbances from fire and grazing. The woody species were restricted by a fire return interval of 2-5 years. After these fires, bison would often move in and graze the fresh new growth of the grasses and forbs before moving on across the landscape allowing the recently grazed areas to rest. This plant community represents the result of this rest period and the recovery of the plant community. Bare ground is typically less than 5 percent with litter residue covering 75 percent of the soil between plants.
Figure 11. Annual production by plant type (representative values) or group (midpoint values)
Table 5. Annual production by plant type
Plant type Low
(lb/acre)Representative value
(lb/acre)High
(lb/acre)Grass/Grasslike 1674 2344 3014 Forb 800 1120 1440 Tree 13 18 23 Shrub/Vine 13 18 23 Total 2500 3500 4500 Table 6. Ground cover
Tree foliar cover 0-10% Shrub/vine/liana foliar cover 0-10% Grass/grasslike foliar cover 60-90% Forb foliar cover 10-40% Non-vascular plants 10-40% Biological crusts 0-10% Litter 60-80% Surface fragments >0.25" and <=3" 0% Surface fragments >3" 0% Bedrock 0% Water 0-10% Bare ground 0-10% Figure 12. Plant community growth curve (percent production by month). OK0009 , Native Warm-Season Grasses. The growing season for warm season(C4) grasses in this region runs from last frost to first frost with peak production from mid April through mid July. The curve listed below is intended to be a representative of normal growing conditions. The monthly production pecentages can vary from year to year deopending upon temperature and rainfall variatioins..
Jan Feb Mar Apr May Jun Jul Aug Sep Oct Nov Dec J F M A M J J A S O N D 0 0 3 9 25 28 15 5 10 5 0 0 Community 1.2
Midgrass/Forb
Figure 13. Plant community 1.2. Carwile soils. Woodward County, OK.
This plant community phase is usually the result of abusive grazing practices that exceed the carrying capacity for the given site. The plant community has shifted to favor the less palatable plants and the plants that are more resilient under heavy grazing. Litter coverage may be reduced. Hydrophytic plants still occupy the lowest, wettest areas. Threeawn (Aristida spp.), Little Barley (Hordeum pusillum), and Western Ragweed have increased in abundance due to the increased disturbance. This plant community is often found around watering facilities where cattle loiter after drinking. This community phase may be at an increased risk of woody plant encroachment due to the lack of fuel load and continuity for effective prescribed burning.
Pathway 1.1A
Community 1.1 to 1.2
Mixedgrass
Midgrass/ForbUnder conditions of abusive grazing above the carrying capacity, the plant community may shift towards the less palatable mid and shortgrass species. Species such as Switchgrass and Vine Mesquite may give way to Sand Dropseed (<a class="species-link" href="https://plants.usda.gov/core/profile?symbol=SPCR" target="_blank" title="Open in plants.usda.gov"><i>Sporobolus cryptandrus</i></a>), Silver Bluestem (Bothriacloa laguroides), and many opportunistic forbs.
Pathway 1.2A
Community 1.2 to 1.1
Midgrass/Forb
MixedgrassWith adequate rest the shortgrass/forb plant community may be shifted back towards the community described in 1.1. The amount of rest required for this shift depends on the remaining plants and precipitation patterns.
State 2
Woody EncroachmentIn this vegetative state, woody species have encroached at levels above 30 percent canopy coverage. These species can intercept rainfall and can begin to shade out some of the herbaceous vegetation. As woody species increase, they can alter the energy flow and hydrology of the site. Again, the encroachment of woody species will be more prevalent on the eastern side of MLRA 78C which receive more annual precipitation.
Community 2.1
Woody
Figure 14. Carwile soils with encroaching woody species
The plant community has transitioned from the reference state and has been influenced by the dominance of woody species. These species may include Black Willow, Willow Baccharis, Eastern Cottonwood, and Eastern Redcedar(during dry periods). Due to the periodically wet conditions, this site may be vulnerable to the invasion by Saltcedar (Tamarix spp.) if a seed source is introduced. The increasing woody cover has a negative impact on the herbaceous plant community by shading sunlight and impacting hydrologic flow. These woody species also make suitable perched for avian predators and may reduce the wildlife habitat potential for some species.
State 3
Land Use ConversionThis ecological state is the result if a conversion in land use from rangeland to cropland or tame pasture. The site has been plowed and much of the soil structure in the top six to twelve inches has been compromised. Within this state, soil microbial activity is often decrease and both the energy flow and hydrology have been altered from the reference state.
Community 3.1
CroplandThis plant community can vary from site to site depending on the production system. Most sites in production are planted to small grains with the rare exception of canola or sorghum. Refer to Ag extension publications or Soil Survey crop production reports for soil specific crop yield data.
Community 3.2
Tame PastureThis plant community is often a monoculture of an introduced species. Species diversity is low along with potential for wildlife habitat. Consult the local soil survey manuscript or web soil survey for potential yields of introduced species.
State 4
Alternative StateThis state represents plant communities that follow cultivation or other soil disturbing activities (pipelines, etc.). The sites may have been replanted to native species or abandoned to let whatever seed source remained take over.
Community 4.1
Go-Back
Figure 15. Carwile soils revegetated after soil disturbance. Woodward County, OK
This plant community is the result of abandonment after cultivation or other soil disturbing event. There is a large amount of variability in plant species and amounts depending on many factors including length of time in cultivation, remnant seedstock, and precipitation patterns. Often, there are large amounts of Silver Bluestem, Little Barley, and Brome species.
Community 4.2
Range Planting
Figure 16. Carwile soils planted to Native CRP mix. Woods County, OK
Often, when managers wish to convert cropland back to native vegetation, they will develop a seeding mix of desired species. This process of re-establishing native plants may take several years. The species of a reseeded community will vary depending on the planting mix and conditions after the planting. While a successful range planting can re-establish most of the plants of the reference state, soil properties have been altered significantly and the site may not ever regain the full ecological function.
Transition T1A
State 1 to 2With the removal of fire from the ecosystem, woody plants may increase in abundance. These woody species may continue to encroach and begin to impact the energy flow and hydrology of site if left uncontrolled through prescribed fire or other brush management practices.
Transition T1B
State 1 to 3In many cases, the Depressional Upland site has been plowed and farmed with the adjacent sandy or sandy loam areas. Once the site has been cultivated, the soil structure has been changed and the microbiology of the soil has been altered from that of the reference state.
Restoration pathway R2A
State 2 to 1In most instances, a brush management program will need to be implemented to decrease the woody plant density. Following control of the larger woody species, a program of periodic prescribed fire should be implemented in order to control sapling growth and prevent future encroachment.
Transition T3A
State 3 to 4Once cultivation has ceased on the site, the site may be reseeded to native vegetation or abandoned and left to revegetate naturally.
Additional community tables
Table 7. Community 1.1 plant community composition
Group Common name Symbol Scientific name Annual production () Foliar cover (%) Grass/Grasslike1 Tallgrasses 400–1800 switchgrass PAVI2 Panicum virgatum 150–1800 – little bluestem SCSC Schizachyrium scoparium 0–90 – Indiangrass SONU2 Sorghastrum nutans 0–90 – Grass, perennial 2GP Grass, perennial 0–45 – sand bluestem ANHA Andropogon hallii 0–45 – 2 Cool Season Grass/Grasslike 400–800 western wheatgrass PASM Pascopyrum smithii 100–225 – Canada wildrye ELCA4 Elymus canadensis 75–150 – Texas bluegrass POAR Poa arachnifera 50–125 – sedge CAREX Carex 25–75 – flatsedge CYPER Cyperus 25–75 – bulrush SCIRP Scirpus 0–40 – spikerush ELEOC Eleocharis 0–40 – Heller's rosette grass DIOL Dichanthelium oligosanthes 0–40 – 3 Shortgrass/Midgrass 500–2000 blue grama BOGR2 Bouteloua gracilis 500–1800 – vine mesquite PAOB Panicum obtusum 100–250 – thin paspalum PASE5 Paspalum setaceum 75–200 – sand dropseed SPCR Sporobolus cryptandrus 75–200 – buffalograss BODA2 Bouteloua dactyloides 75–150 – gummy lovegrass ERCU Eragrostis curtipedicellata 0–75 – Grass, perennial 2GP Grass, perennial 0–75 – sand lovegrass ERTR3 Eragrostis trichodes 0–40 – red lovegrass ERSE Eragrostis secundiflora 0–15 – composite dropseed SPCO16 Sporobolus compositus 0–15 – purple lovegrass ERSP Eragrostis spectabilis 0–15 – purple threeawn ARPU9 Aristida purpurea 0–15 – silver beardgrass BOLA2 Bothriochloa laguroides 0–15 – sideoats grama BOCU Bouteloua curtipendula 0–15 – tumble windmill grass CHVE2 Chloris verticillata 0–15 – fall witchgrass DICO6 Digitaria cognata 0–15 – hairy grama BOHI2 Bouteloua hirsuta 0–15 – 4 Annual Grass 17–30 sandbur CENCH Cenchrus 0–15 – little barley HOPU Hordeum pusillum 0–10 – sixweeks fescue VUOC Vulpia octoflora 0–10 – threeawn ARIST Aristida 0–10 – Forb5 Forbs/Legumes 800–1440 Cuman ragweed AMPS Ambrosia psilostachya 40–100 – Forb, perennial 2FP Forb, perennial 0–45 – Spanish gold GRPA8 Grindelia papposa 0–40 – vente conmigo CRGL2 Croton glandulosus 0–40 – Texas croton CRTE4 Croton texensis 0–40 – woolly plantain PLPA2 Plantago patagonica 0–40 – hogwort CRCA6 Croton capitatus 0–40 – Palmer's spectaclepod DICA31 Dimorphocarpa candicans 0–40 – knotweed POLYG4 Polygonum 0–40 – sidebeak pencilflower STBI2 Stylosanthes biflora 0–30 – sessileleaf ticktrefoil DESE Desmodium sessilifolium 0–30 – fourvalve mimosa MIQU2 Mimosa quadrivalvis 0–30 – coastal indigo INMI Indigofera miniata 0–30 – purple poppymallow CAIN2 Callirhoe involucrata 0–30 – amberique-bean STHE9 Strophostyles helvola 0–30 – partridge pea CHFA2 Chamaecrista fasciculata 0–30 – Indian rushpea HOGL2 Hoffmannseggia glauca 0–30 – milkweed ASCLE Asclepias 0–30 – cutleaf geranium GEDI Geranium dissectum 0–30 – prairie clover DALEA Dalea 0–30 – Virginia tephrosia TEVI Tephrosia virginiana 0–30 – hairy false goldenaster HEVI4 Heterotheca villosa 0–30 – white heath aster SYER Symphyotrichum ericoides 0–30 – hoary false goldenaster HECA8 Heterotheca canescens 0–30 – Illinois bundleflower DEIL Desmanthus illinoensis 0–30 – Indian blanket GAPU Gaillardia pulchella 0–25 – whitemouth dayflower COER Commelina erecta 0–25 – fogfruit PHYLA Phyla 0–25 – lemon beebalm MOCI Monarda citriodora 0–25 – azure blue sage SAAZ Salvia azurea 0–25 – silverleaf nightshade SOEL Solanum elaeagnifolium 0–25 – crested pricklypoppy ARPO2 Argemone polyanthemos 0–25 – white sagebrush ARLU Artemisia ludoviciana 0–25 – aster SYMPH4 Symphyotrichum 0–25 – bush morning-glory IPLE Ipomoea leptophylla 0–25 – scarlet beeblossom GACO5 Gaura coccinea 0–25 – annual buckwheat ERAN4 Eriogonum annuum 0–20 – skullcap SCUTE Scutellaria 0–15 – prairie groundcherry PHHI8 Physalis hispida 0–15 – narrowleaf four o'clock MILI3 Mirabilis linearis 0–15 – plains snakecotton FRFL Froelichia floridana 0–10 – pepperweed LEPID Lepidium 0–10 – Hooker's scratchdaisy CRHO7 Croptilon hookerianum 0–10 – soapweed yucca YUGL Yucca glauca 0–10 – camphorweed HESU3 Heterotheca subaxillaris 0–10 – Carolina horsenettle SOCA3 Solanum carolinense 0–10 – Gordon's bladderpod LEGO Lesquerella gordonii 0–10 – prairie broomweed AMDR Amphiachyris dracunculoides 0–10 – clammy groundcherry PHHE5 Physalis heterophylla 0–10 – spurge EUPHO Euphorbia 0–10 – golden tickseed COTI3 Coreopsis tinctoria 0–10 – wavyleaf thistle CIUN Cirsium undulatum 0–5 – tarragon ARDR4 Artemisia dracunculus 0–5 – common yellow oxalis OXST Oxalis stricta 0–5 – shaggy dwarf morning-glory EVNU Evolvulus nuttallianus 0–5 – prairie spiderwort TROC Tradescantia occidentalis 0–5 – Shrub/Vine6 Shrub 0–25 willow baccharis BASA Baccharis salicina 0–15 – Chickasaw plum PRAN3 Prunus angustifolia 0–5 – sand sagebrush ARFI2 Artemisia filifolia 0–5 – Tree7 Tree 0–25 black willow SANI Salix nigra 0–14 – eastern cottonwood PODE3 Populus deltoides 0–9 – Table 8. Community 1.2 plant community composition
Group Common name Symbol Scientific name Annual production () Foliar cover (%) Table 9. Community 2.1 plant community composition
Group Common name Symbol Scientific name Annual production () Foliar cover (%) Table 10. Community 3.1 plant community composition
Group Common name Symbol Scientific name Annual production () Foliar cover (%) Table 11. Community 3.2 plant community composition
Group Common name Symbol Scientific name Annual production () Foliar cover (%) Table 12. Community 4.1 plant community composition
Group Common name Symbol Scientific name Annual production () Foliar cover (%) Table 13. Community 4.2 plant community composition
Group Common name Symbol Scientific name Annual production () Foliar cover (%) Interpretations
Animal community
The plant communities of the reference state have good value for grazing by domestic animals. It also has good value as food and cover for numerous species of wildlife. It provides excellent habitat for northern bobwhite quail. White-tailed deer and wild turkey may frequent the site. A great variety of song birds utilize this site for summer habitat. For more specific guidance, refer to Wildlife Habitat Appraisal Guides that are species specific.
Hydrological functions
These sites exhibit much different hydrology than the surrounding sandhills. They are subjected to runoff from the adjacent areas by both surface movement and subsurface lateral movement of water. This run-on hydrology coupled with the slowly permeable, fine textured subsoil, creates episaturation (perched water table) of the upper soil horizons. Therefore, while the surface may stay wet for extended periods, it actually takes much longer for the water to infiltrate these soils as opposed to the adjacent sandy soils.
Recreational uses
Areas around these sites are well known in Oklahoma for its quail hunting. A multitude of mammals and birds frequent this site, so it is a great area to observe and study Oklahoma animal and plant life. This site is used for many common recreational activities such as hiking, camping, bird watching, hunting and horseback riding.
Other information
The concepts and descriptions presented in this ESD are the product of a combination of historical descriptions, previous drafts, field work, and professional consensus. This report is not intended serve as a complete botanical description, or cover every possible management scenario. It should be considered a working draft and any analysis, input, or constructive critique is welcomed.
Supporting information
Other references
Barnes, P. W., and A. T. Harrison. 1982. Species distribution and community
organization in a Nebraska Sandhills mixed prairie as influenced by plant/ soil water
relationships. Oecologia (Bed.) 52: 192-20l.
Bestelmeyer, B. T., Brown, J. R., Havstad, K. M., Alexander, R., Chavez, G., & Herrick, J. E. (2003). Development and use of state-and-transition models for rangelands. Journal of Range Management, 114-126.
Fuhlendorf, S. D., Engle, D. M., Kerby, J. A. Y., & Hamilton, R. (2009). Pyric herbivory: rewilding landscapes through the recoupling of fire and grazing. Conservation Biology, 23(3), 588-598.
Harlan, J. R. (1957). Grasslands of Oklahoma.
National Soil Information System (NASIS). Accessed 2013
Noy-Meir, I. 1973. Desert Ecosystems: Environment and Producers. Annual Review of Ecology and Systematics, 4:25-51.
Shantz, H. L. (1923). The natural vegetation of the Great Plains region. Annals of the Association of American Geographers, 13(2), 81-107.
Shiflet, T. N. (1994). Rangeland cover types of the United States (Vol. 152). Denver, CO, USA: Society for Range Management.
USDA NRCS Plants Database. Online.Contributors
Colin Walden, Range Specialist, Stillwater, OK
PES Edits by Tyson Morley, MLRA Soil Scientist, Altus, OklahomaApproval
Bryan Christensen, 9/15/2023
Acknowledgments
Site Development and Testing Plan Future work, as described in a Project Plan, to validate the information in this Provisional Ecological Site Description is needed. This will include field activities to collect low, medium and high intensity sampling, soil correlations, and analysis of that data. Annual field reviews should be done by soil scientists and vegetation specialists. A final field review, peer review, quality control, and quality assurance reviews of the ESD will be needed to produce the final document. Annual reviews of the Project Plan are to be conducted by the Ecological Site Technical Team. Brandon Reavis StRMS NRCS Stillwater, OK David Kraft StRMS/Acting QA NRCS Emporia, KS
Rangeland health reference sheet
Interpreting Indicators of Rangeland Health is a qualitative assessment protocol used to determine ecosystem condition based on benchmark characteristics described in the Reference Sheet. A suite of 17 (or more) indicators are typically considered in an assessment. The ecological site(s) representative of an assessment location must be known prior to applying the protocol and must be verified based on soils and climate. Current plant community cannot be used to identify the ecological site.
Author(s)/participant(s) Contact for lead author Date 11/23/2021 Approved by Approval date Composition (Indicators 10 and 12) based on Annual Production Indicators
-
Number and extent of rills:
-
Presence of water flow patterns:
-
Number and height of erosional pedestals or terracettes:
-
Bare ground from Ecological Site Description or other studies (rock, litter, lichen, moss, plant canopy are not bare ground):
-
Number of gullies and erosion associated with gullies:
-
Extent of wind scoured, blowouts and/or depositional areas:
-
Amount of litter movement (describe size and distance expected to travel):
-
Soil surface (top few mm) resistance to erosion (stability values are averages - most sites will show a range of values):
-
Soil surface structure and SOM content (include type of structure and A-horizon color and thickness):
-
Effect of community phase composition (relative proportion of different functional groups) and spatial distribution on infiltration and runoff:
-
Presence and thickness of compaction layer (usually none; describe soil profile features which may be mistaken for compaction on this site):
-
Functional/Structural Groups (list in order of descending dominance by above-ground annual-production or live foliar cover using symbols: >>, >, = to indicate much greater than, greater than, and equal to):
Dominant:
Sub-dominant:
Other:
Additional:
-
Amount of plant mortality and decadence (include which functional groups are expected to show mortality or decadence):
-
Average percent litter cover (%) and depth ( in):
-
Expected annual annual-production (this is TOTAL above-ground annual-production, not just forage annual-production):
-
Potential invasive (including noxious) species (native and non-native). List species which BOTH characterize degraded states and have the potential to become a dominant or co-dominant species on the ecological site if their future establishment and growth is not actively controlled by management interventions. Species that become dominant for only one to several years (e.g., short-term response to drought or wildfire) are not invasive plants. Note that unlike other indicators, we are describing what is NOT expected in the reference state for the ecological site:
-
Perennial plant reproductive capability:
Print Options
Sections
Font
AAAAOther
PrintThe Ecosystem Dynamics Interpretive Tool is an information system framework developed by the USDA-ARS Jornada Experimental Range, USDA Natural Resources Conservation Service, and New Mexico State University.
Accessibility statement


