
Natural Resources
Conservation Service
-
Search


Major Land Resource Area or ecological site by name and/or ID.
PreviousSectionsNextGeneral information
Provisional. A provisional ecological site description has undergone quality control and quality assurance review. It contains a working state and transition model and enough information to identify the ecological site.
Click to explore map
Figure 1. Mapped extent
Areas shown in blue indicate the maximum mapped extent of this ecological site. Other ecological sites likely occur within the highlighted areas. It is also possible for this ecological site to occur outside of highlighted areas if detailed soil survey has not been completed or recently updated.
MLRA notes
Major Land Resource Area (MLRA): 078C–Central Rolling Red Plains, Eastern Part
MLRA 78C is characterized by moderately dissected, rolling plains with prominent ridges and valleys and numerous terraces adjacent to dissecting streams. Loamy and clayey soils are generally deep, well drained, and developed in calcareous and gypsiferous sediments of Permian age.
LRU notes
NA
Classification relationships
This ecological site is correlated to soil components at the Major Land Resource Area (MLRA) level which is further described in USDA Ag Handbook 296.
Ecological site concept
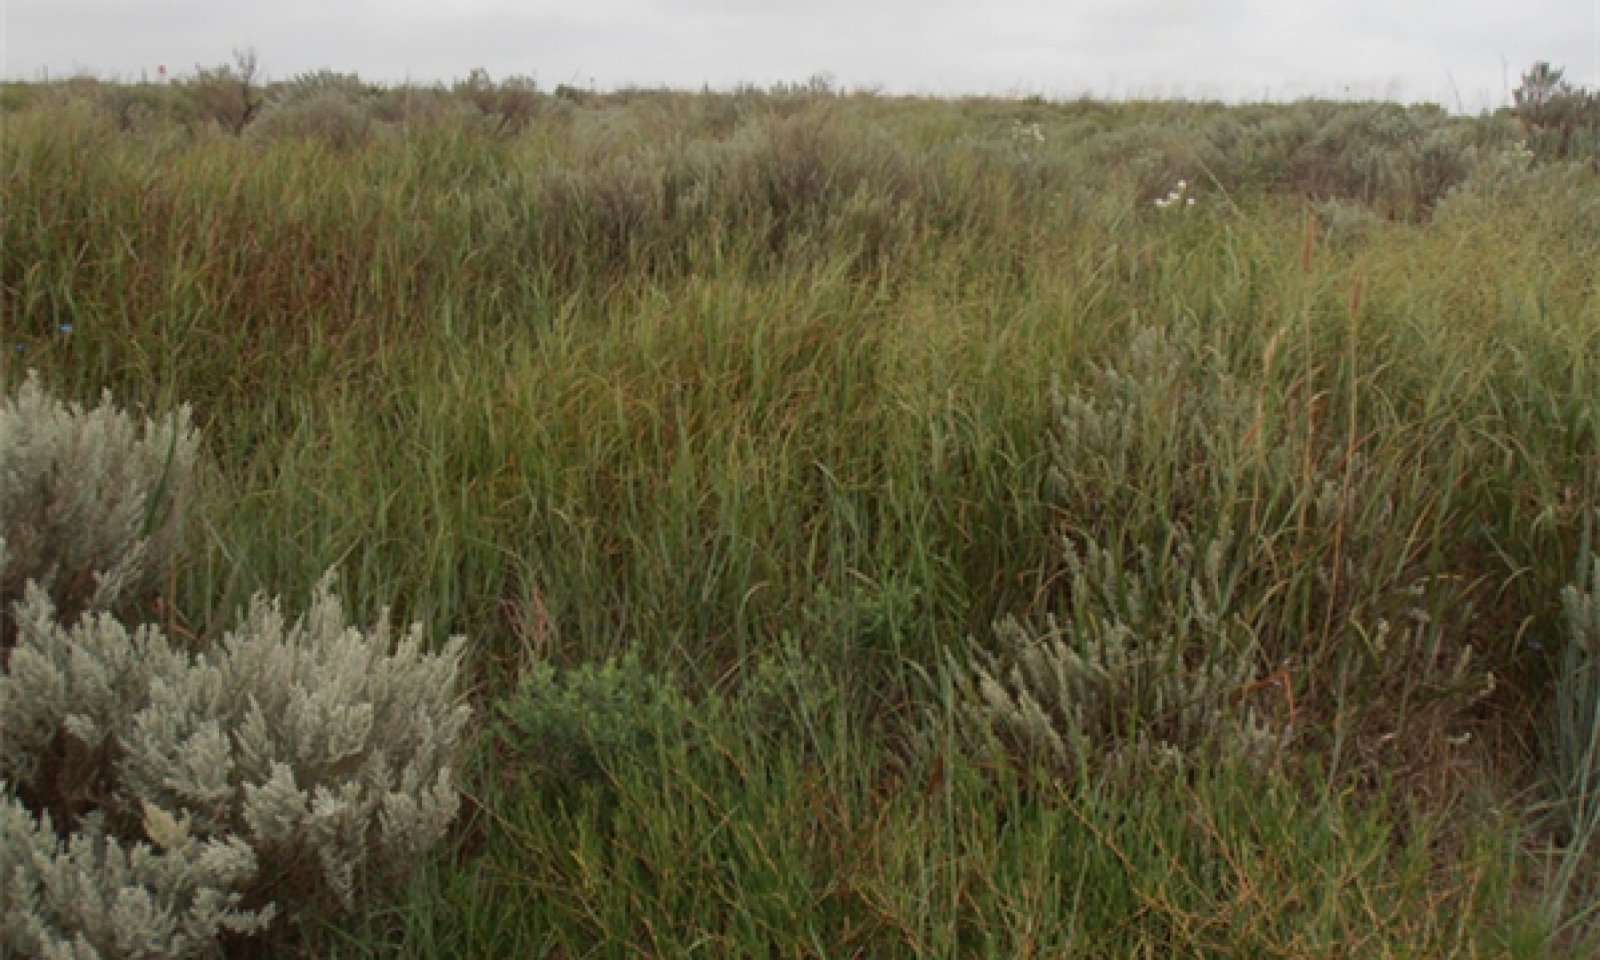
This site consists of deep sandy soils with relatively low water holding capacity and rolling to hummocky relief. The reference plant community is dominated by warm season perennial mid and tall grasses with subdominant perennial forbs and legume species. Woody species canopy cover is generally the least in the reference plant community and generally increases as “time since fire” increases. Productivity on this site may vary greatly from year to year depending on precipitation patterns. In the absence of fire and proper grazing management, this plant community can quickly transition to an alternative plant community.
Associated sites
R078CY017OK Deep Sand Shrubland
Similar landscape as the Rolling Sands. Older, more acidic soils with argillic horizons. Support Shinnery Oak Growth.
Similar sites
R080AY014OK Deep Sand
Correlated to the Eda soil component mapped in MLRA 80A.
Table 1. Dominant plant species
Tree Not specified
Shrub (1) Artemisia filifolia
(2) Prunus angustifoliaHerbaceous (1) Andropogon hallii
(2) Tephrosia virginianaPhysiographic features
These sites are located on nearly level to rolling, hummocky, low dune topography.

Figure 2. Rolling Sand
Table 2. Representative physiographic features
Landforms (1) Alluvial plain > Dune
(2) Alluvial plain > Sand sheet
Runoff class Negligible to very low Flooding frequency None Ponding frequency None Elevation 1000 – 2500 ft Slope 0 – 12 % Ponding depth 0 in Aspect Aspect is not a significant factor Climatic features
MLRA 78C lies within the subtropical sub-humid climate regime. This regime is characterized by rapid changes in temperature; marked extremes, both daily and annual; and rather erratic rainfall. The weather is alternately influenced by cold dry air from the Arctic Circle, and warm moist air from the Gulf of Mexico.
Seasonal changes are gradual. Spring is a season of variable weather and relatively high precipitation with prevailing winds from the southwest. Summers are generally hot with low humidity. Fall has long periods of pleasant weather interspersed with moderate to heavy rains. Winter is open and moderate to cold with winds from the north and infrequent snows.
Wind speeds average more than eleven miles an hour with prevailing southern winds. Rather strong winds can occur in all months of the year. While strong gusty winds occur, severe dust storms are rare.
Approximately 75 percent of the rainfall occurs during the warm season, and much of it comes in storms of high intensity and short duration in May and June. These rains can be particularly erosive on sites where vegetation is sparse. Occasional droughts are to be expected. Lack of rainfall and hot, dry winds often curtail forage production during July and August.Table 3 Representative climatic features
Frost-free period (characteristic range) 160-200 days Freeze-free period (characteristic range) 190-220 days Precipitation total (characteristic range) 30-30 in Frost-free period (actual range) 150-210 days Freeze-free period (actual range) 190-230 days Precipitation total (actual range) 30-30 in Frost-free period (average) 180 days Freeze-free period (average) 210 days Precipitation total (average) 30 in Characteristic rangeActual rangeBarLineFigure 3. Monthly precipitation range
Characteristic rangeActual rangeBarLineFigure 4. Monthly minimum temperature range
Characteristic rangeActual rangeBarLineFigure 5. Monthly maximum temperature range
BarLineFigure 6. Monthly average minimum and maximum temperature
Figure 7. Annual precipitation pattern
Figure 8 Annual average temperature pattern
Climate stations used
-
(1) COLDWATER [USC00141704], Coldwater, KS
-
(2) TALOGA [USC00348708], Taloga, OK
-
(3) CLINTON SHERMAN AP [USW00003932], Dill City, OK
-
(4) LAKE KEMP [USC00414982], Seymour, TX
-
(5) ANSON 3ESE [USC00410268], Anson, TX
">Influencing water features
According to definitions outlined in the ESIS manual, there are no influencing water features on this site.
Wetland description
NA
Soil features
Soils are generally mapped for each county at the Mapunit level. Mapunits are representations of the major soil series component(s) and named accordingly. Each Mapunit is spatially represented on a soils map as polygons of different shapes and sizes. Within these Mapunits, there are often minor soil series components included. These minor components are soils that occur within a Mapunit polygon but are of small extent (15% or less of the Mapunit area). However, it is difficult to separate these minor soils spatially due to the scale of soil mapping.
Ecological sites are correlated at the component level of the soil survey. Therefore, a single Mapunit may contain multiple Ecological Sites just as it may contain multiple soil components. This is important to understand when investigating soils and Ecological Sites. A soil survey Mapunit may be correlated to a single Ecological Site based on the major component; however, there may be inclusional areas of additional Ecological Sites which are correlated to the minor components of that particular soil Mapunit.
The soils of this site are sands with sandy loam subsoils. These soils are very deep and coarse. Infiltration of moisture is rapid. Permeation is rapid and deep. There is very little runoff. Water storage capacity is low, but moisture that is present is usually readily available to plants. Available moisture, coupled with the soil’s deep sandy profile, encourages deep rooted grasses and various species of woody vegetation.
Representative soils for this site include:
Eda and Devol (LFS)
Note: There may be minor components adjacent to these major components that because of mapping scale are not divided out. These may include some Dunal areas of the Tivoli or Jester series (Sand Hills 078CY107TX) or depressional areas of the Carwile series (Depressional Upland 078CY098OK).Table 4. Representative soil features
Parent material (1) Eolian sands
Surface texture (1) Fine sand
(2) Loamy fine sand
Family particle size (1) Sandy
Drainage class Somewhat excessively drained to well drained Permeability class Moderately rapid to rapid Soil depth 60 – 80 in Surface fragment cover <=3" Not specified Surface fragment cover >3" Not specified Available water capacity
(0-40in)0.8 – 5.5 in Calcium carbonate equivalent
(0-40in)Not specified Electrical conductivity
(0-40in)0 – 2 mmhos/cm Sodium adsorption ratio
(0-40in)Not specified Soil reaction (1:1 water)
(0-40in)5.1 – 7.8 Subsurface fragment volume <=3"
(Depth not specified)Not specified Subsurface fragment volume >3"
(Depth not specified)Not specified Ecological dynamics
This plant community evolved during large herbivore grazing and occasional fires. This interaction referred to as pyric herbivory, (Fuhlendorf et al 2008) shaped the grasslands of the Great Plains into a shifting mosaic landscape. Native Americans used fire to alter the landscape and create conditions that large herbivores would have been attracted to. Fire tended to suppress the growth of woody plants and reset the natural advance of these plants on this site. Fires would lead to more open landscapes that would allow for improvement to grazing accessibility and the quality of the herbaceous component of the plant community. Based on historical accounts large herds of herbivores typically Bison, numbering in the hundreds of thousands or possibly millions would have been attracted to areas with an abundance of grasses and moved through consuming a large portion of the plants in their path. This would set back the natural succession of the plants creating a patchy landscape of plant communities that would have been shifting due to the grazing and fire interaction.
In the absence of fire, shrub species generally increase, and may eventually dominate the site up to a stable level. On Rolling sands a scattering of annual plants are common, but usually only increase as the site deteriorates due to overgrazing. Annual plants may also appear on-site because of disturbances by rodents and other small digging mammals, or when normal rainfall patterns return after an extended periods of drought. With the introduction of cool season annual plants during the last hundred years, degraded plant communities have a larger portion of annual plants due to the invasive nature of these plants and their ability to fill a niche in the warm season plant community.
Within the plant community the tallgrass plants are strongly rhizomatous and often form colonies four to six feet across when given the opportunity and dominate the production of the site when given the opportunity. Production can be highly variable from year to year depending on rainfall and/or temperature. Precipitation regimes (precipitation belts of varying widths running north and south through the MLRA) vary considerably in total annual precipitation from west to east. Due to the nature of the soils this site is relatively droughty when rainfall is below normal and can lead to very low production when overgrazed. Heavy grazing can impact the stability of the site and usually results in a gradual decrease of the tallgrass species. The tallgrasses lost to overgrazing are replaced by perennial mid and shortgrasses and varying amounts and species of annuals, both forbs and grasses. When this happens the shallower rooted species do not have access to deep soil moisture during these dry periods and during prolonged periods of drought herbage production will be reduced. When overgrazing occurs during years of below average rainfall over consecutive years the productivity of this site falls quickly and can be difficult to recover especially if constant over stocking continues. When overgrazed, the site will exhibit a midgrass and sagebrush dominated landscapes and typically only a few tallgrass species will be seen, specifically in areas where animals are deterred from grazing. Conversely, deep rooted tallgrasses respond well and vegetative production can be quite high during periods of normal or above normal precipitation. Sand sagebrush is almost always found on the Rolling Sands and should be considered an integral part of the plant community. Typically sand sagebrush stands will not increase in density more than 30% canopy cover overall on the landscape and can be managed with the use of fire to reduce the canopy and stimulate grass growth. Small pockets of higher canopies may be found on the landscape that exceed 30 percent but would be considered atypical.
The general aspect of this site is open shrubland with mid and tallgrasses on nearly level to rolling, hummocky topography. As the site deteriorates from overgrazing, absence of fire, or both, other plant communities result. These communities include a midgrass/shortgrass community and eventually a shrub dominated annual grass community.
State and Transition Model
A State and Transition Model for the Rolling Sands Ecological Site (078CY014) is depicted in Figure 1. Thorough descriptions of each state, transition, plant community, and pathway follow the model. Experts base this model on available experimental research, field observations, professional consensus, and interpretations. It is likely to change as knowledge increases.
Plant communities will differ across the MLRA because of the naturally occurring variability in weather, soils, and aspect. The Reference Plant Community is not necessarily the management goal; other vegetative states may be desired plant communities as long as the Range Health assessments are in the moderate and above category. The biological processes on this site are complex. Therefore, representative values are presented in a land management context. The species lists are representative and are not botanical descriptions of all species occurring, or potentially occurring, on this site. They are not intended to cover every situation or the full range of conditions, species, and responses for the site.
Both percent species composition by weight and percent canopy cover are described as are other metrics. Most observers find it easier to visualize or estimate percent canopy for woody species (trees and shrubs). Canopy cover can drive the transitions between communities and states because of the influence of shade and interception of rainfall. Species composition by dry weight is used for describing the herbaceous community and the community as a whole. Woody species are included in species composition for the site. Calculating similarity index requires use of species composition by dry weight.
The following diagram suggests some pathways that the vegetation on this site might take. There may be other states not shown on the diagram. This information is intended to show what might happen in a given set of circumstances. It does not mean that this would happen the same way in every instance. Local professional guidance should always be sought before pursuing a treatment scenario.State and transition model
More interactive model formats are also available. View Interactive Models
Click on state and transition labels to scroll to the respective textEcosystem states
T1A - Absence of disturbance and natural regeneration over time, may be coupled with excessive grazing pressure R2A - Adequate rest from defoliation, followed by reintroduction of historic disturbance regimes T2A - Absence of disturbance and natural regeneration over time, may be coupled with excessive grazing pressure R3A - Removal of woody canopy and adequate rest from defoliation State 1 submodel, plant communities
State 2 submodel, plant communities
State 3 submodel, plant communities
State 1
Mixed-Grass ShrublandThis ecological state is dominated by warm season native species and is dominated by little bluestem as well as sand bluestem. Shrubs and annual forbs are subdominant although fluctuations naturally occur between the plant communities within this state depending on weather patterns and time since fire. These changes may also be induced by changes in management and use.
Community 1.1
Tallgrass/Midgrass/Shrub (Reference Community)
Figure 9. Tallgrass/Midgrass/Shrub plant community on Eda soils. Woodward County, OK

Figure 10. Tallgrass/Midgrass/Shrub plant community on Eda soils. Woodward County, OK
This is the reference or interpretive community for the site. The description is based on early range site descriptions, historical documents, clipping data, professional consensus of experienced range specialists, and analysis of field work.
The Mixed-grass dominated community is the reference plant community for this site. In reference condition, this site is a fire/herbivory dependent; Mixed-grass dominated community with about 10 percent woody canopy cover. Plant communities are dynamic in nature and fluctuations in the landscape would have been continuous based on natural and anthropogenic disturbance patterns. This plant community is dominated by warm season, perennial tall and midgrasses and has a shrub component that could be considered an essential part of the plant community. The dominance of grasses can vary widely across the site based on clay content in the soil, depth of sand and landscape location. These variations within the site are factors that can make this site sensitive to grazing especially during below average precipitation.
This plant community is dominated by tall, warm season grasses. These include Sand Bluestem (Andropogon hallii), Switchgrass (Panicum virgatum), Indiangrass(Sorghastrum nutans), Little Bluestem(Schizachyrium scoparium) and occasionally Giant Sandreed(Calamovilfa gigantea) . Midgrasses typically found on the site are Sand Dropseed(Sporobolus cryptandrus), Sideoats Grama(Bouteloua curtipendula), Thin Paspalum(Paspalum setaceum), and Sand Lovegrass(Eragrostis trichodes. Some cool-season grasses include Texas Bluegrass(Poa arachnifera), Western Wheatgrass(Pascopyrum smithii), Scribner’s Panicum(Dichanthelium oligosanthes) and Canada Wildrye(Elymus canadensis). Scattered throughout this site is small amounts of shortgrasses, consisting primarily of Blue Grama(Bouteloua gracilis), and Hairy Grama(Bouteloua hirsuta).
Forbs in this community include Pitcher’s Sage(Salvia azurea), Erect Dayflower(Commelina erecta), Scarlet Guara(Gaura coccinea),Queen’s Delight(Stillingia sylvatica), Ground Cherry(Physalis spp.), Globemallow(Spaeralcea spp.), and many others.
Legumes include Indian Rushpea(Hoffmannseggia glauca), Goat’s Rue(Tephrosia virginiana), Roundhead Lespedeza(Lespedeza capitata), and Showy Partridge Pea(Chamaecrista fasciculata)Typically, a few shrubs such as Sand Sagebrush(Artemisia filifolia), Fragrant Sumac(Rhus aromatica), and Sand Plum(Prunus angustifolia) occur on the site with Sand Sagebrush being the dominant shrub component.
Annuals that commonly occur following rodent disturbances and drought include Fourpoint Evening-primrose(Oenothera rhombipetala), Annual Buckwheat(Eriogonum annuum), Cheatgrass(Bromus tectorum), and Camphorweed(Heterotheca subaxillaris).
This plant community is relatively stable and can withstand short term droughts although production can fluctuate accordingly. If the site is abused by overgrazing, a reduction of the more palatable tall and mid grasses, forbs, and legumes will occur. When this happens the overall productivity of the site can decrease because of the loss of deep rooted highly productive tall grass species. The cool season plants will also be more prominent when abundant fall rains occur.
Fire on a 2 to 5 year frequency will help suppress shrubs and enhance the cycling of minerals and nutrients. Once fire return intervals exceed this frequency additional management like grazing deferment may need to be used to increase fine fuels to carry a fire through the plant community.
Grazing has a dual effect in maintaining this grassland. Grazing assists in nutrient cycling by digesting coarse grasses and depositing the digested plants through manure back to the soil surface. However, overgrazing can shift the plants within this community, create bare ground, and remove any opportunity for burning for that season. Typically these sites when well managed would show very little signs of erosion and the use of fire would not accelerate this process because of the below ground biomass produced when perennial grasses and shrubs are present to protect the soil.Figure 11. Annual production by plant type (representative values) or group (midpoint values)
Table 5. Annual production by plant type
Plant type Low
(lb/acre)Representative value
(lb/acre)High
(lb/acre)Grass/Grasslike 1050 2100 3150 Forb 300 600 900 Shrub/Vine 135 270 405 Tree 15 30 45 Total 1500 3000 4500 Table 6. Ground cover
Tree foliar cover 0% Shrub/vine/liana foliar cover 0% Grass/grasslike foliar cover 0% Forb foliar cover 0% Non-vascular plants 0% Biological crusts 0% Litter 60-80% Surface fragments >0.25" and <=3" 0% Surface fragments >3" 0% Bedrock 0% Water 0% Bare ground 0-10% Figure 12. Plant community growth curve (percent production by month). OK0009 , Native Warm-Season Grasses. The growing season for warm season(C4) grasses in this region runs from last frost to first frost with peak production from mid April through mid July. The curve listed below is intended to be a representative of normal growing conditions. The monthly production pecentages can vary from year to year deopending upon temperature and rainfall variatioins..
Jan Feb Mar Apr May Jun Jul Aug Sep Oct Nov Dec J F M A M J J A S O N D 0 0 3 9 25 28 15 5 10 5 0 0 Community 1.2
Midgrass/Tallgrass/Shrub
Figure 13. Midgrass/Tallgrass/Shrub plant community in foreground. Transitioning to plant community 2.1 in the background.
This plant community is still dominated by warm season mid and tallgrasses. However, there is reduced vigor among the tallgrasses and there may be an increase in both brush canopy and annual forbs depending on time since fire and vigor of perennial grasses. In many instances Sand Sagebrush has become “visually dominant” due to the reduced vigor and structure of the perennial grass component. This community is considered “at risk” of crossing a threshold to a Midgrass Shrubland Sate 2. Special consideration should be taken to ensure the health and vigor of the tallgrass species if the objective is to manage the site as the reference state.
Figure 14. Annual production by plant type (representative values) or group (midpoint values)
Table 7. Annual production by plant type
Plant type Low
(lb/acre)Representative value
(lb/acre)High
(lb/acre)Grass/Grasslike 975 1950 2925 Forb 330 660 990 Shrub/Vine 180 360 540 Tree 15 30 45 Total 1500 3000 4500 Figure 15. Plant community growth curve (percent production by month). OK0009 , Native Warm-Season Grasses. The growing season for warm season(C4) grasses in this region runs from last frost to first frost with peak production from mid April through mid July. The curve listed below is intended to be a representative of normal growing conditions. The monthly production pecentages can vary from year to year deopending upon temperature and rainfall variatioins..
Jan Feb Mar Apr May Jun Jul Aug Sep Oct Nov Dec J F M A M J J A S O N D 0 0 3 9 25 28 15 5 10 5 0 0 Pathway 1.1A
Community 1.1 to 1.2
Tallgrass/Midgrass/Shrub (Reference Community)
Midgrass/Tallgrass/ShrubWhen grazing pressure exceeds the carrying capacity for the site; the plant community may shift to community 1.2. Excessive grazing pressure shifts the grass and forb component between the two plant communities while sagebrush percentage typically is not affected by grazing. This shift could also be the result of long term drought and/or the exclusion of fire. The lack of fire allows individual sagebrush plants to grow increasing canopy percentages. Within these communities, fine fuel continuity is typically sufficient to conduct a prescribed burn. This pathway would be seen as consistent within the historical fire return interval.
Pathway 1.2A
Community 1.2 to 1.1
Midgrass/Tallgrass/Shrub
Tallgrass/Midgrass/Shrub (Reference Community)With proper grazing management, prescribed burning, periodic rest, and favorable precipitation, this community may shift back to the reference community 1.1. Grazing disturbance typically does not affect the sagebrush canopy and only provides for an increase in the number and amount of tall and midgrass species within the community. Decrease in sagebrush canopy must be accomplished by another disturbance such as fire or mechanical methods that provide for a short term removal of canopy that typically does not alter the number of plants per acre. Fire can also stimulate the growth of fire tolerant grass species like Sand Bluestem for a period of time post burn. This pathway would be consistent within historical fire return intervals.
State 2
Midgrass ShrublandThis ecological state is the result of a transition across a threshold from the reference state (1). It is dominated by midgrass species with subdominant annual forbs and grasses. Shrub species are still subdominant, but have exceeded the threshold of 20% canopy cover. This state is less resilient to disturbances than the reference state (1). Transition to this state may decrease species diversity and above ground herbaceous biomass production.
Community 2.1
MIdgrass/Shortgrass/Shrub
Figure 16. Community 2.1 Midgrass/Shortgrass/Shrub plant community on Eda soils.
This plant community is dominated by midgrasses including, Sand Dropseed (Sporobolus cryptandrus), Sand Paspalum (Paspalum setaceum), and Lovegrass species (Eragrostis spp.).
Texas Bluegrass (Poa arachnifera) may be abundant depending on season of use by grazing animals. Many perennial forbs and tallgrasses have been replaced by opportunistic annual forbs and annual cool-season grasses. These forbs include Camphorweed (Heterotheca subaxillaris), Sand Sunflower (Helianthus petiolaris), Annual Buckwheat (Eriogonum annuum), and Dozedaisy (Aphanostephus skirrhobasis). Cool-season annual grasses include Brome species (Bromus spp.), Little Barley (Hordeum pusillum), and Six-weeks Fescue (Vulpia octoflora). Sand sagebrush (Artemisia filifolia), Fragrant Sumac (Rhus aromatica), and Sand Plum (Prunus angustifolia) have exceeded 20% canopy cover. This site is susceptible to invasion by Eastern Red Cedar due to the lack of fire.
Figure 17. Annual production by plant type (representative values) or group (midpoint values)
Table 8. Annual production by plant type
Plant type Low
(lb/acre)Representative value
(lb/acre)High
(lb/acre)Forb 525 945 1400 Grass/Grasslike 510 918 1360 Shrub/Vine 450 810 1200 Tree 15 27 40 Total 1500 2700 4000 Figure 18. Plant community growth curve (percent production by month). OK0004 , Warm season midgrass/shrub.
Jan Feb Mar Apr May Jun Jul Aug Sep Oct Nov Dec J F M A M J J A S O N D 0 1 3 15 25 22 10 8 10 4 1 1 State 3
ShrublandThis ecological state is the result of a transition across a threshold from the Midgrass Shrubland State (2). It is dominated by woody species with an understory of annual grasses, forbs, and an abundant amount of bare ground. Very few remnant tallgrasses or midgrasses will be found in this plant community.
Community 3.1
Shrub dominant with annuals
Figure 19. Shrub dominated plant community
This plant community is dominated by Sand Sagebrush(Artemisia filifolia), along with Sand Plum(Prunus angustifolia), and Fragrant Sumac(Rhus aromatica). The dominant herbaceous components are annual grasses and forbs including Annual Buckwheat (Eriogonum Annuum) and Camphorweed (Heterotheca subaxillaris). Annual grass including Sand Bur, (Cenchrus sp.), Brome (Bromus spp.) and Little Barley (Hordeum pusillum) thrive in the interspaces and areas of bare ground. Few traces of tall and midgrass species persist within this plant community and are typically found in areas where grazing is inaccessible. Typically this site has been invaded by Eastern Red Cedar and accounts for a portion of the canopy cover.
Figure 20. Annual production by plant type (representative values) or group (midpoint values)
Table 9. Annual production by plant type
Plant type Low
(lb/acre)Representative value
(lb/acre)High
(lb/acre)Shrub/Vine 675 1125 1575 Forb 435 725 1015 Grass/Grasslike 375 625 875 Tree 15 25 35 Total 1500 2500 3500 Figure 21. Plant community growth curve (percent production by month). OK0010 , Shrub dominant with annuals and few perennials.
Jan Feb Mar Apr May Jun Jul Aug Sep Oct Nov Dec J F M A M J J A S O N D 0 1 5 22 30 24 6 4 4 2 1 1 Transition T1A
State 1 to 2Lack of disturbance such as fire within the historic fire return interval has allowed sagebrush canopy to increase to a steady level that typically does not exceed 30% on the average within management units. Small inclusions of sagebrush that exceeds 30% may be present but typically is not normal on a landscape basis. Grazing has continued to impact the palatable grasses and forbs while an increase in annual forbs and the lack of most tallgrasses in any measurable amount is typical.
Restoration pathway R2A
State 2 to 1With the implementation of both Prescribed Grazing (seasonal deferment) and disturbance like Prescribed Burning conservation practices, the Midgrass Shrubland State may be restored back to the Mixed-grass Shrubland State. Prescribed grazing to decrease the pressure on palatable species will improve the grass and forb component. This will also increase the amount of fine fuel needed to effectively implement prescribed fire to reduce the canopy cover of sand sagebrush and promote fire tolerant grass species. This restoration timeframe is dependent upon the degree of degradation, available moisture during rest periods, fire return intervals, and the management strategies.
Transition T2A
State 2 to 3With continuous abusive grazing, no disturbance such as fire or brush management, the Midgrass Shrubland State will transition into the Shrubland State. This transition is due to the loss of or lack of any harvestable production of perennial grass species. Sand Sagebrush canopy is consistent as it is not typically affected by overgrazing by herbivores but other brush species have increased in response to the lack of a disturbance like fire. (Ex - Eastern Red Cedar) Most production is made up of a few perennial grass and forb species along with a surge in annual grass and forb production.
Restoration pathway R3A
State 3 to 2Restoration of this severely degraded state requires long term planning. Depending on the remaining grass species, it may take years (decades) of season long grazing deferment as well as suitable weather conditions to recover. Implementation of a prescribed fire program is also key to the restoration of this state. Burning will return sagebrush cover to a lower canopy percent and provide control of Eastern Redcedar, but may not recover the perennial grass component rapidly. Over time, with the implementation of proper stocking rates and prescribed burning program, this state may be restored to a Midgrass Shrubland State (2).
Additional community tables
Table 10. Community 1.1 plant community composition
Group Common name Symbol Scientific name Annual production () Foliar cover (%) Grass/Grasslike1 Tallgrasses 682–2048 sand bluestem ANHA Andropogon hallii 200–700 – little bluestem SCSC Schizachyrium scoparium 240–600 – switchgrass PAVI2 Panicum virgatum 70–200 – giant sandreed CAGI3 Calamovilfa gigantea 30–100 – Indiangrass SONU2 Sorghastrum nutans 30–100 – purpletop tridens TRFL2 Tridens flavus 30–100 – Grass, perennial 2GP Grass, perennial 30–100 – big bluestem ANGE Andropogon gerardii 40–100 – 2 Midgrass/Shortgrass 210–630 thin paspalum PASE5 Paspalum setaceum 35–100 – sand dropseed SPCR Sporobolus cryptandrus 35–100 – sideoats grama BOCU Bouteloua curtipendula 30–80 – witchgrass PACA6 Panicum capillare 20–60 – sand lovegrass ERTR3 Eragrostis trichodes 20–60 – Grass, perennial 2GP Grass, perennial 10–30 – red lovegrass ERSE Eragrostis secundiflora 10–30 – composite dropseed SPCO16 Sporobolus compositus 10–30 – fall witchgrass DICO6 Digitaria cognata 10–30 – gummy lovegrass ERCU Eragrostis curtipedicellata 6–20 – purple lovegrass ERSP Eragrostis spectabilis 6–20 – blue grama BOGR2 Bouteloua gracilis 5–15 – hairy grama BOHI2 Bouteloua hirsuta 5–15 – silver beardgrass BOLA2 Bothriochloa laguroides 0–6 – tumble windmill grass CHVE2 Chloris verticillata 0–6 – tumblegrass SCPA Schedonnardus paniculatus 0–6 – purple threeawn ARPU9 Aristida purpurea 0–6 – 3 Cool-Season Perennial Grasses 147–441 Heller's rosette grass DIOL Dichanthelium oligosanthes 40–100 – Canada wildrye ELCA4 Elymus canadensis 40–100 – sedge CAREX Carex 30–80 – Texas bluegrass POAR Poa arachnifera 30–80 – western wheatgrass PASM Pascopyrum smithii 10–40 – 4 Annual Grasses 10–32 sandbur CENCH Cenchrus 0–15 – sixweeks fescue VUOC Vulpia octoflora 0–15 – little barley HOPU Hordeum pusillum 0–4 – threeawn ARIST Aristida 0–2 – Forb5 Annual Forbs 30–90 Cuman ragweed AMPS Ambrosia psilostachya 5–10 – sunflower HELIA3 Helianthus 3–10 – tenpetal blazingstar MEDE2 Mentzelia decapetala 3–10 – evening primrose OENOT Oenothera 3–10 – woolly plantain PLPA2 Plantago patagonica 0–5 – smooth jewelflower STHY Streptanthus hyacinthoides 0–5 – cutleaf geranium GEDI Geranium dissectum 0–5 – Spanish gold GRPA8 Grindelia papposa 0–5 – camphorweed HESU3 Heterotheca subaxillaris 0–5 – hogwort CRCA6 Croton capitatus 0–5 – vente conmigo CRGL2 Croton glandulosus 0–5 – Texas croton CRTE4 Croton texensis 0–5 – Palmer's spectaclepod DICA31 Dimorphocarpa candicans 0–5 – annual buckwheat ERAN4 Eriogonum annuum 0–5 – Indian blanket GAPU Gaillardia pulchella 0–3 – lemon beebalm MOCI Monarda citriodora 0–3 – prairie broomweed AMDR Amphiachyris dracunculoides 0–2 – scratchdaisy CROPT Croptilon 0–2 – Gordon's bladderpod LEGO Lesquerella gordonii 0–2 – pepperweed LEPID Lepidium 0–2 – spurge EUPHO Euphorbia 0–2 – plains snakecotton FRFL Froelichia floridana 0–2 – Arkansas dozedaisy APSK Aphanostephus skirrhobasis 0–2 – crested pricklypoppy ARPO2 Argemone polyanthemos 0–2 – lambsquarters CHAL7 Chenopodium album 0–2 – soft goldenaster CHPI8 Chrysopsis pilosa 0–2 – golden tickseed COTI3 Coreopsis tinctoria 0–2 – 6 Perennial Forbs 210–630 queen's-delight STSY Stillingia sylvatica 20–60 – dayflower COMME Commelina 20–60 – mat sandbur CELO3 Cenchrus longispinus 21–36 – little barley HOPU Hordeum pusillum 21–36 – globemallow SPHAE Sphaeralcea 10–30 – soapweed yucca YUGL Yucca glauca 10–30 – clammy groundcherry PHHE5 Physalis heterophylla 10–30 – prairie groundcherry PHHI8 Physalis hispida 10–30 – azure blue sage SAAZ Salvia azurea 10–30 – beeblossom GAURA Gaura 10–30 – hoary false goldenaster HECA8 Heterotheca canescens 10–30 – hairy false goldenaster HEVI4 Heterotheca villosa 10–30 – bush morning-glory IPLE Ipomoea leptophylla 10–30 – Forb, perennial 2FP Forb, perennial 10–30 – white sagebrush ARLU Artemisia ludoviciana 6–18 – milkweed ASCLE Asclepias 4–12 – aster ASTER Aster 4–12 – tarragon ARDR4 Artemisia dracunculus 4–12 – soft greeneyes BEPU2 Berlandiera pumila 0–6 – purple poppymallow CAIN2 Callirhoe involucrata 0–6 – yellow sundrops CASE12 Calylophus serrulatus 0–6 – yellowspine thistle CIOC2 Cirsium ochrocentrum 0–6 – wavyleaf thistle CIUN Cirsium undulatum 0–6 – Texas bullnettle CNTE Cnidoscolus texanus 0–6 – dotted blazing star LIPU Liatris punctata 0–6 – rush skeletonplant LYJU Lygodesmia juncea 0–6 – lacy tansyaster MAPI Machaeranthera pinnatifida 0–6 – narrowleaf four o'clock MILI3 Mirabilis linearis 0–6 – common yellow oxalis OXST Oxalis stricta 0–6 – yellow nailwort PAVI4 Paronychia virginica 0–6 – skullcap SCUTE Scutellaria 0–6 – Carolina horsenettle SOCA3 Solanum carolinense 0–6 – silverleaf nightshade SOEL Solanum elaeagnifolium 0–6 – white heath aster SYER Symphyotrichum ericoides 0–6 – late purple aster SYPA11 Symphyotrichum patens 0–6 – prairie spiderwort TROC Tradescantia occidentalis 0–6 – nettleleaf noseburn TRUR2 Tragia urticifolia 0–6 – Missouri gourd CUFO Cucurbita foetidissima 0–6 – shaggy dwarf morning-glory EVNU Evolvulus nuttallianus 0–6 – 7 Legumes 60–180 Virginia tephrosia TEVI Tephrosia virginiana 10–40 – roundhead lespedeza LECA8 Lespedeza capitata 10–25 – slender lespedeza LEVI7 Lespedeza virginica 4–12 – leadplant AMCA6 Amorpha canescens 4–12 – sessileleaf ticktrefoil DESE Desmodium sessilifolium 4–12 – Indian rushpea HOGL2 Hoffmannseggia glauca 4–12 – coastal indigo INMI Indigofera miniata 4–12 – prairie clover DALEA Dalea 0–10 – Forb, perennial 2FP Forb, perennial 0–10 – fourvalve mimosa MIQU2 Mimosa quadrivalvis 0–10 – sidebeak pencilflower STBI2 Stylosanthes biflora 0–5 – Shrub/Vine8 Shrubs 135–405 sand sagebrush ARFI2 Artemisia filifolia 70–200 – Chickasaw plum PRAN3 Prunus angustifolia 40–120 – fragrant sumac RHAR4 Rhus aromatica 20–50 – smooth sumac RHGL Rhus glabra 6–20 – Havard oak QUHA3 Quercus havardii 0–10 – twistspine pricklypear OPMA2 Opuntia macrorhiza 0–5 – Tree9 Trees 15–45 netleaf hackberry CELAR Celtis laevigata var. reticulata 8–25 – blackjack oak QUMA3 Quercus marilandica 0–10 – post oak QUST Quercus stellata 0–10 – western soapberry SASAD Sapindus saponaria var. drummondii 0–5 – Table 11. Community 1.2 plant community composition
Group Common name Symbol Scientific name Annual production () Foliar cover (%) Table 12. Community 2.1 plant community composition
Group Common name Symbol Scientific name Annual production () Foliar cover (%) Table 13. Community 3.1 plant community composition
Group Common name Symbol Scientific name Annual production () Foliar cover (%) Interpretations
Animal community
This plant community has good value for grazing by domestic animals. It also has good value as food and cover for numerous species of wildlife. It provides excellent habitat for northern bobwhite quail as well as Lesser Prairie chicken where they are found. White-tailed deer and wild turkey frequent the site. A great variety of song birds utilize this site for summer habitat. This community is particularly important for Cassin’s sparrow when shrub cover is high. For more specific guidance, refer to Wildlife Habitat Appraisal Guides that are species specific.
Hydrological functions
The soils of this site are rapidly permiable and excessively drained. Most available moisture permiates through the soil profile rather quickly. This should be taken into consideration before applying any soil ammendments or herbicides. Many of these sites have inclusional areas of Carwile soils(Depressional Upland) which may pond water from time to time.
Recreational uses
This site is well known in Oklahoma for its quail hunting. A multitude of mammals and birds frequent this site, so it is a great area to observe and study Oklahoma animal and plant life. This site is used for many common recreational activities such as hiking, camping, bird watching, hunting and horseback riding.
Wood products
None
Other products
There is potential for recreational harvesting of sand plums where they occur throughout the site.
Supporting information
Inventory data references
Inventory Data References: Information presented has been derived from NRCS clipping data, research from Oklahoma State University, field observations and measurements by trained range personnel. Most of the clipping data was gathered by a team consisting of a range conservationist and a soil scientist and was site/soil specific. Yields were taken at the end of the growing season and, as near as possible, were obtained from areas that were un-grazed that year. Clipping data repository is in the NRCS State Office in Stillwater, OK.
Other references
Bestelmeyer, B. T., Brown, J. R., Havstad, K. M., Alexander, R., Chavez, G., & Herrick, J. E. (2003). Development and use of state-and-transition models for rangelands. Journal of Range Management, 114-126.
Collins, S. L., Bradford, J. A., & Sims, P. L. (1988). Succession and fluctuation in Artemisia dominated grassland. Vegetation, 73(2), 89-99.
Fuhlendorf, S. D., Engle, D. M., Kerby, J. A. Y., & Hamilton, R. (2009). Pyric herbivory: rewilding landscapes through the recoupling of fire and grazing. Conservation Biology, 23(3), 588-598.
Gillen, R. L., & Sims, P. L. (2004). Stocking rate, precipitation, and herbage production on sand sagebrush-grassland. Rangeland Ecology & Management, 57(2), 148-152.
Gunter, S. A., Thacker, E. T., Gillen, R. L., Springer, T. L., & Jones, R. D. (2012). Effects of sand sagebrush control in southern mixed-grass prairie rangeland on cattle performance and economic return. The Professional Animal Scientist, 28(2), 204-212.
Harlan, J. R. (1957). Grasslands of Oklahoma.
McIlvain, E. H., & Savage, D. A. (1951). Eight-year comparisons of continuous and rotational grazing on the Southern Plains Experimental Range. Journal of Range Management, 42-47.
National Soil Information System (NASIS). Accessed 2013
Shantz, H. L. (1923). The natural vegetation of the Great Plains region. Annals of the Association of American Geographers, 13(2), 81-107.
Shiflet, T. N. (1994). Rangeland cover types of the United States (Vol. 152). Denver, CO, USA: Society for Range Management.
Sims, P. L. (1993). Cow weights and reproduction on native rangeland and native rangeland-complementary forage systems. Journal of Animal Science, 71(7), 1704-1711.
USDA NRCS Plants Database. Online.
USDA-SCS Oklahoma Range Site Descriptions(1960s)
Vermiere, L. T., Mitchell, R. B., & Fuhlendorf, S. D. (2001). Sand sagebrush response to fall and spring prescribed burns. Shrubland ecosystem genetics and biodiversity: proceedings. USDA-Forest Service, Proceedings RMRS-P-21, 233-235.
Winter, S. L., Fuhlendorf, S. D., Goad, C. L., Davis, C. A., Hickman, K. R., & Leslie Jr, D. M. (2011). Fire tolerance of a resprouting Artemisia (Asteraceae) shrub. Plant Ecology, 212(12), 2085-2094.
Reviewers/Contributors
Harry Fritzler, Range Specialist NRCS
Mike Sams, Wildlife Biologist NRCS
Mark Moseley, SSRO 9 ESS
Steve McGowen, Soil Scientist NRCS
Tyson Morley, Soil Scientist NRCS
Dwayne Elmore,PhD, Extension Wildlife Specialist Oklahoma State University
It is important to remember that ESDs always ramain as draft documents and as more information is collected, they are updated accordingly through update projects. The concepts within this report were developed using the current information available at the time.Contributors
Colin Walden, Range Specialist(ESI), Stillwater, OK
Dr. Jack Eckroat, Grazing Lands Specialist, NRCS, Oklahoma
PES Edits by Tyson Morley, MLRA Soil Scientist, Altus, OklahomaApproval
Bryan Christensen, 9/15/2023
Acknowledgments
Site Development and Testing Plan Future work, as described in a Project Plan, to validate the information in this Provisional Ecological Site Description is needed. This will include field activities to collect low, medium and high intensity sampling, soil correlations, and analysis of that data. Annual field reviews should be done by soil scientists and vegetation specialists. A final field review, peer review, quality control, and quality assurance reviews of the ESD will be needed to produce the final document. Annual reviews of the Project Plan are to be conducted by the Ecological Site Technical Team.
Rangeland health reference sheet
Interpreting Indicators of Rangeland Health is a qualitative assessment protocol used to determine ecosystem condition based on benchmark characteristics described in the Reference Sheet. A suite of 17 (or more) indicators are typically considered in an assessment. The ecological site(s) representative of an assessment location must be known prior to applying the protocol and must be verified based on soils and climate. Current plant community cannot be used to identify the ecological site.
Author(s)/participant(s) Colin Walden (Edited original version by Mark Moseley & Jack Eckroat 2004) Contact for lead author colin.walden@ok.usda.gov Date 08/01/2013 Approved by Approval date Composition (Indicators 10 and 12) based on Annual Production Indicators
-
Number and extent of rills:
There should be no rills due to the rapidly permeable soils -
Presence of water flow patterns:
No water flow patterns should be present -
Number and height of erosional pedestals or terracettes:
Rare occurence of pedestals <1inch on areas of steeper slopes -
Bare ground from Ecological Site Description or other studies (rock, litter, lichen, moss, plant canopy are not bare ground):
Some variability from year to year with precipitation patterns. No more than 15% -
Number of gullies and erosion associated with gullies:
No evidence of gullies -
Extent of wind scoured, blowouts and/or depositional areas:
No evidence of wind scouring -
Amount of litter movement (describe size and distance expected to travel):
Very little litter movement due to rapidly permeable soils -
Soil surface (top few mm) resistance to erosion (stability values are averages - most sites will show a range of values):
Soil Stability scores of 5 and 6 for canopy and interspaces -
Soil surface structure and SOM content (include type of structure and A-horizon color and thickness):
0 to 16 inches; brown (7.5YR 5/4) crushed loamy fine sand, brown (7.5YR 4/4) crushed moist; weak medium subangular blocky structure parting to structureless, single grained; loose, very friable, non sticky, non plastic -
Effect of community phase composition (relative proportion of different functional groups) and spatial distribution on infiltration and runoff:
Very little runoff due to rapidly permeable soils regardless of functional group proportions -
Presence and thickness of compaction layer (usually none; describe soil profile features which may be mistaken for compaction on this site):
No compaction Layer -
Functional/Structural Groups (list in order of descending dominance by above-ground annual-production or live foliar cover using symbols: >>, >, = to indicate much greater than, greater than, and equal to):
Dominant:
Warm-Season Midgrasses & Tallgrasses codominantSub-dominant:
Perennial Forbs>Shrubs>Cool-Season Grasses>AnnualsOther:
Additional:
Some of the soil series associated with the Rolling Sands Ecological Site sustain populations of plants that would refer to a different ecological site. Refer to 078CY017 or 080AY018 based on the dominant overstory of shrub or other woody species. -
Amount of plant mortality and decadence (include which functional groups are expected to show mortality or decadence):
Some mortality from year to year < 10% -
Average percent litter cover (%) and depth ( in):
Litter cover should average 75% at a depth of 1/2 inch -
Expected annual annual-production (this is TOTAL above-ground annual-production, not just forage annual-production):
1500 - 4500 lb/ac -
Potential invasive (including noxious) species (native and non-native). List species which BOTH characterize degraded states and have the potential to become a dominant or co-dominant species on the ecological site if their future establishment and growth is not actively controlled by management interventions. Species that become dominant for only one to several years (e.g., short-term response to drought or wildfire) are not invasive plants. Note that unlike other indicators, we are describing what is NOT expected in the reference state for the ecological site:
Potential invases: Eastern Redcedar, Brome, Sericea Lespedeza(uncommon). -
Perennial plant reproductive capability:
All plants should be capable of reproducing every 2-3 years
Print Options
Sections
Font
AAAAOther
PrintThe Ecosystem Dynamics Interpretive Tool is an information system framework developed by the USDA-ARS Jornada Experimental Range, USDA Natural Resources Conservation Service, and New Mexico State University.
Accessibility statement


