
Natural Resources
Conservation Service
Ecological site R077EY098OK
Depression
16-24" PZ
Last updated: 9/12/2023
Accessed: 10/08/2026
-
Search


Major Land Resource Area or ecological site by name and/or ID.
PreviousSectionsNextGeneral information
Provisional. A provisional ecological site description has undergone quality control and quality assurance review. It contains a working state and transition model and enough information to identify the ecological site.
MLRA notes
Major Land Resource Area (MLRA): 077E–Southern High Plains, Breaks
MLRA 77E occurs along moderately sloping breaks and steep escarpments associated with dissecting river systems and erosional margins of the Southern High Plains. Soil temperature regime is thermic and soil moisture regime is ustic bordering on aridic. Loamy and sandy soils are generally well drained, range from shallow to deep, and developed in Ogallala Formation sediments.
Classification relationships
This ecological site is correlated to soil components at the Major Land Resource Area (MLRA) level which is further described in USDA Ag Handbook 296.
Ecological site concept
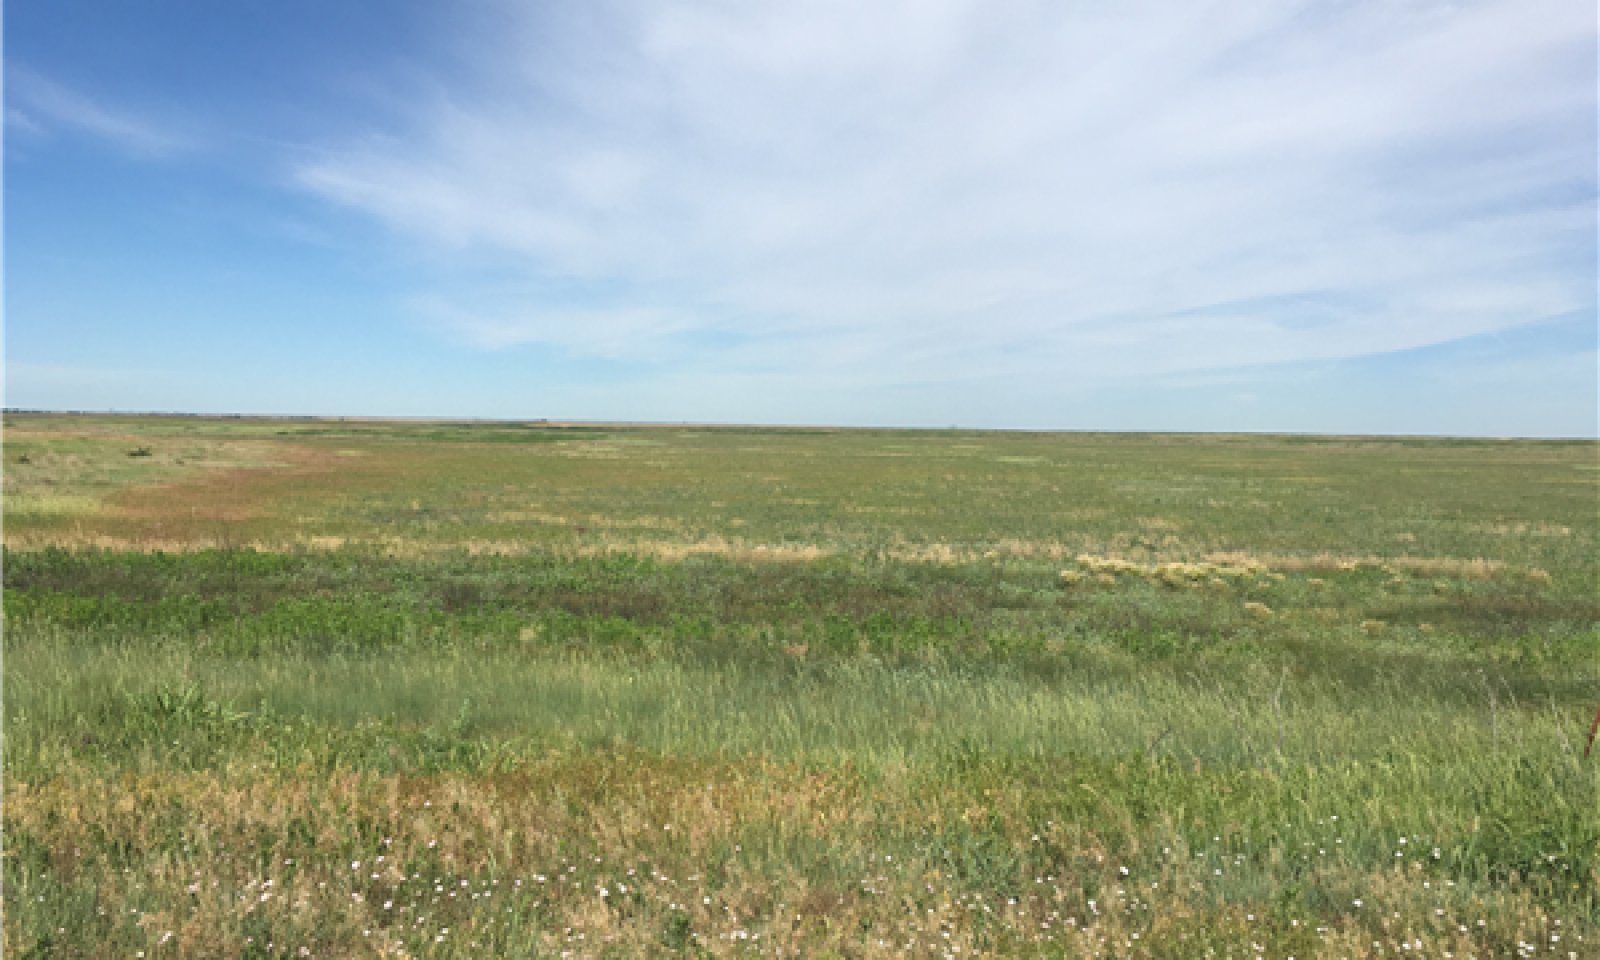
This site occurs on closed depressions over clayey soils. Water is ponded for various lengths of time. Vegetation may fluctuate as a result of the duration and depth of ponding.
While these sites are often inclusions areas and often small in spatial extent, they may warrant special consideration when making management decisions.Associated sites
R077EY056OK Loamy Upland 16-24" PZ
Nearly level to sloping very deep fine-loamy and fine-silty soils on higher stream terraces, remnant stream terraces, paleoterraces, and aggraded hillslopes. Mid and tallgrass with forbs and very few woody species
R077EY058TX Loamy Bottomland 16-24" PZ
Nearly level to very gently sloping, very deep loamy alluvial soils on higher floodplains. Tallgrass dominated plant community with forbs and scattered trees.
Similar sites
R077AY005TX Playa 16-22" PZ
A similar site in MLRA 77A with soils formed in a slightly cooler mesic soil temperature regime.
R078CY025OK Depressional Upland
A similar site in MLRA 78C with soils formed in loamy eolian deposits.
Table 1. Dominant plant species
Tree (1) Baccharis salicina
Shrub Not specified
Herbaceous (1) Pascopyrum smithii
(2) Phyla nodifloraPhysiographic features
These sites are in depressions 3 to 10 feet below the surrounding plain and range in size from a few acres to more than 40 acres. Slopes are nearly level with concave surfaces.
Table 2. Representative physiographic features
Landforms (1) Plains > Depression
(2) Plains > Playa
Runoff class Negligible Ponding duration Brief (2 to 7 days) to long (7 to 30 days) Ponding frequency Frequent Elevation 2000 – 3000 ft Slope 0 – 1 % Ponding depth 4 – 36 in Table 3. Representative physiographic features (actual ranges)
Runoff class Negligible Ponding duration Long (7 to 30 days) to brief (2 to 7 days) Ponding frequency Occasional to frequent Elevation 2000 – 3000 ft Slope 0 – 1 % Ponding depth 4 – 36 in Climatic features
Climate is a cold semi-arid steppe (Koppen-Geiger classification BSk). Summers are hot and winters are cold. Temperature extremes are common. Humidity is generally low, evaporation is high, and short-term droughts are common. Average annual wind speed is 12 mph with highest winds in early spring. The prevailing wind direction is south. Summertime brings strong high pressure systems that build into heat domes with highs in the upper 90 to mid-100 degree F range. Evaporation in summer is high and open pan evaporation exceeds 6 feet per year. Early autumn temperatures are mild, with Canadian and Pacific cold fronts bringing cold air in mid-autumn throughout winter. Arctic air can settle in and dominate for several weeks during winter with very cold air in place for 2 to 3 weeks at a time.
Most of the precipitation comes in the form of rain from May through September. Rainfall events often occur as intense showers of relatively short duration. Snowfall average is about 17 inches but is also variable from 8 to 36 inches annually. Long term droughts are likely to occur every 15 to 20 years and may last 4 to 5 years. Mean precipitation is around 21 inches but varies significantly from year to year. Rainfall amounts over the last 100 years have varied from as little as 9 inches to as much as 37 inches. The probability is about 70% that precipitation will fall between 14 to 24 inches. Growing season averages 190 days. Average first frost is around October 22, and the last freeze of the season occurs around April 15.Table 4 Representative climatic features
Frost-free period (characteristic range) 140-160 days Freeze-free period (characteristic range) 180-190 days Precipitation total (characteristic range) 20-30 in Frost-free period (actual range) 140-160 days Freeze-free period (actual range) 180-200 days Precipitation total (actual range) 20-30 in Frost-free period (average) 150 days Freeze-free period (average) 190 days Precipitation total (average) 20 in Characteristic rangeActual rangeBarLineFigure 1. Monthly precipitation range
Characteristic rangeActual rangeBarLineFigure 2. Monthly minimum temperature range
Characteristic rangeActual rangeBarLineFigure 3. Monthly maximum temperature range
BarLineFigure 4. Monthly average minimum and maximum temperature
Figure 5. Annual precipitation pattern
Figure 6 Annual average temperature pattern
Climate stations used
-
(1) GATE [USC00343489], Gate, OK
-
(2) FOLLETT [USC00413225], Follett, TX
-
(3) CANADIAN [USC00411412], Canadian, TX
-
(4) BEAVER [USC00340593], Beaver, OK
-
(5) MEADE [USC00145171], Meade, KS
-
(6) LIPSCOMB [USC00415247], Booker, TX
-
(7) COLDWATER [USC00141704], Coldwater, KS
-
(8) REYDON 2SSE [USC00347579], Reydon, OK
">Influencing water features
This site receives some runoff from surrounding areas. The depression sites are generally closed basins with no outlet, therefore runoff collects and ponds for several days to several months. Infiltration is very slow due to the heavy clay soils.
Wetland description
There is high degree of variability to the water status in individual playas. Some playas exhibit wetland hydrology, have hydric soils, and have predominantly hydrophytic vegetation. The dryer, grass dominated playas often do not exhibit all three of these characteristics.
Soil features
Soils are mapped for each county within the MLRA. Mapunits are representations of the major soil series component(s) and named accordingly. Each Mapunit is spatially represented on a digital soils map as polygons of different shapes and sizes. Within these Mapunits, there are often minor soil series components included. These minor components are soils that occur within a Mapunit polygon but are of small extent (15% or less of the Mapunit area). However, it is difficult to separate these minor soils spatially due to the scale of soil mapping.
Ecological sites are correlated at the component level of the soil survey. Therefore, a single Mapunit may contain multiple Ecological Sites just as it may contain multiple soil components. This is important to understand when investigating soils and Ecological Sites. A soil survey Mapunit may be correlated to a single Ecological Site based on the major component; however, there may be inclusions of areas of additional Ecological Sites which are correlated to the minor components of that particular soil Mapunit.
This group of soils consists of very deep, poorly drained, very slowly permeable soils that formed in clayey lacustrine sediments. These soils occupy closed drainage depressions on stream terraces or stream terrace remnants. They have silty clay or clay surface textures and fine textured subsurface textures that shrink when dried and swell when wet. Slopes range from 0 to 1 percent. Runoff is from surrounding areas collects in the closed basins where this soil resides, and frequent, long duration ponding is typical. Aquic conditions are present in the soil and hydrophytic vegetation may dominate the sites.
Representative soil components for this site include: Rosston. Some older surveys may include the Ness series.Table 5. Representative soil features
Parent material (1) Lacustrine deposits
Surface texture (1) Clay
(2) Silty clay
Family particle size (1) Fine
Drainage class Very poorly drained to poorly drained Permeability class Very slow Soil depth 80 in Surface fragment cover <=3" Not specified Surface fragment cover >3" Not specified Available water capacity
(0-40in)4.6 – 7.1 in Calcium carbonate equivalent
(0-40in)0 – 1 % Electrical conductivity
(0-40in)0 – 2 mmhos/cm Sodium adsorption ratio
(0-40in)0 – 1 Soil reaction (1:1 water)
(0-40in)6.6 – 8.4 Subsurface fragment volume <=3"
(0-40in)Not specified Subsurface fragment volume >3"
(0-40in)Not specified Ecological dynamics
The information contained in the State and Transition Diagram (STD) and the Ecological Site Description was developed using archeological and historical data, professional experience, and scientific studies. The information presented is representative of a very complex set of plant communities. Not all scenarios or plants are included. Key indicator plants, animals and ecological processes are described to inform land management decisions.
These Depression sites are unique features on the high plains. The availability of surface water has always been a draw for wild and domestic animals. As with most other Great Plains ecosites, these areas evolved under periodic fires and grazing events. However, differing from many other sites, frequency and duration of inundation is the primary driver of the plant community. The longer the site is covered in water, the more hydrophytic plants will dominate the community. As these sites dry up for long periods of time, the hydrophytes will decline and give way to more midgrasses and shortgrasses.
Many of these areas have been altered from their historical hydrology. Through cultivation, land leveling, and field draining, many of the formerly closed depressions have been drained or filled. However, there are many sites that remain intact due to the perennial wetness that is not conducive to farming.
State and Transition Diagram:
A State and Transition Diagram for the Depression (R077EY098OK) site is depicted below. Thorough descriptions of each state, transition, and pathway follow the model. Experts base this model on available experimental research, field observations, professional consensus, and interpretations. It is likely to change as knowledge increases.
Plant communities will differ across the MLRA because of the natural variability in weather, soils, and aspect. The Reference Plant Community is not necessarily the management goal; other vegetative states may be desired plant communities as long as the Range Health assessments are in the moderate and above category.
The biological processes on this site are complex. Therefore, representative values are presented in a land management context. The species lists are representative and are not botanical descriptions of all species occurring, or potentially occurring, on this site. They are not intended to cover every situation or the full range of conditions, species, and responses for the site.
The following diagram suggests some pathways that the vegetation on this site might take. There may be other states not shown on the diagram. This information is intended to show what might happen in a given set of circumstances. It does not mean that this would happen the same way in every instance. Local professional guidance should always be sought before pursuing a treatment scenario.State and transition model
Custom diagramStandard diagram
Figure 7. R077EY098OK
More interactive model formats are also available. View Interactive Models
More interactive model formats are also available. View Interactive Models
Click on state and transition labels to scroll to the respective textEcosystem states
T1A - Extensive soil disturbance and crop cultivation T2A - Rangeland seeding or natural regeneration in the absence of disturbance State 1 submodel, plant communities
State 2 submodel, plant communities
State 3 submodel, plant communities
State 1
Wet Grassland (R)This is the reference or diagnostic community for the site. The description is based on early range site descriptions, clipping data, professional consensus of experienced range specialists, and analysis of field work.
This reference state represents the natural variability of the fluctuating plant community that evolved under the historical disturbance regime. Through periodic drought and wet periods the vegetation may shift back and forth across these “community phases” without crossing an ecological threshold.Community 1.1
Midgrass/Grasslikes
Figure 8. Rosston series. Harper County, OK
This is the reference plant community for the Depression site. The plant community is dominated by midgrasses and grasslike plants. Midgrasses include species that can with stand wet soil conditions for short periods such as vine mesquite and western wheatgrass. Grasslikes include many species of sedges (Carex spp.), rushes (Juncus spp.) and bulrushes (Scirpus spp.). Buffalograss and various forbs also occur in this community phase. Annual vegetative production is estimated at 1,400 to 3,000 pounds per acre.
Community 1.2
Shortgrass/ForbIf the depression site stays dry for prolonged periods, the plant community may shift toward species adapted to dry conditions. Buffalograss and other shortgrasses may dominate along with numerous forbs such as western ragweed and others.
Community 1.3
HydrophytesProlonged inundation may lead to a plant community dominated by hydrophytic plants. Many aquatic plants including smartweeds (Polygonum spp.), and rushes may dominate the site. Some woody plants including willows (Salix spp.) and Tamarisk may occupy the edges of the ponded water.
Pathway 1.1A
Community 1.1 to 1.2Over long dry periods, this community may shift towards community 1.2 as the clay soils dry out.
Pathway 1.1B
Community 1.1 to 1.3Over long wet periods, this community may shift towards community 1.3 as water is ponded for long periods and favors many hydrophytic species.
Pathway 1.2A
Community 1.2 to 1.1With the return of o favorable precipitation cycle, the community may shift back towards community 1.1
Pathway 1.3A
Community 1.3 to 1.1As the water evaporates and the depressions dry out, the plant community may shift toward community 1.1.
State 2
Land Use ConversionThis is an alternative state from the reference. Hydrologic and ecological functions have been altered.
Community 2.1
Cropland/Tame PastureThis community phase is in current crop production or has been tilled and seeded to an introduced forage. The hydrology has been altered and requires different management. See Soil Survey or Extension publications for yield data.
State 3
Alternative StateThis is an alternative state from the reference. Hydrologic and ecological functions have been altered.
Community 3.1
Go Back/ReseededThis plant community is the result of abandonment or range seeding after crop production ends. The plant community will be highly variable depending on seed sources, precipitation patterns and management. Consult your local field office for a site specific management plan.
Transition T1A
State 1 to 2Through cultivation and seeding these sites may be converted to crop production or introduced forages.
Transition T2A
State 2 to 3If cultivation is ceased, the site may be reseeded or left to re-vegetate naturally.
Additional community tables
Table 6. Community 1.1 plant community composition
Group Common name Symbol Scientific name Annual production () Foliar cover (%) Table 7. Community 1.2 plant community composition
Group Common name Symbol Scientific name Annual production () Foliar cover (%) Table 8. Community 1.3 plant community composition
Group Common name Symbol Scientific name Annual production () Foliar cover (%) Table 9. Community 2.1 plant community composition
Group Common name Symbol Scientific name Annual production () Foliar cover (%) Table 10. Community 3.1 plant community composition
Group Common name Symbol Scientific name Annual production () Foliar cover (%) Interpretations
Animal community
A variety of animals utilize the site. Small mammals use the site for food and cover. Frogs and salamanders are found in abundance in wet seasons. Predators such as skunks, coyotes and snakes find food and cover there. Pronghorn will sometime graze around the perimeter of playas. Raptors such as hawks (especially harriers) favor the site as hunting areas. Many species of shorebirds and waterfowl utilize the lakes in wetter seasons. Herons and egrets utilize the wetter playas.
Vegetative cover provided by playas is valuable for species such as waterfowl and a variety of upland birds during the nesting season. Also in the fall and winter the playas provide thermal cover and escape cover.
Plant preference by animal kind:
This rating system provides general guidance as to animal preference for plant species. It also indicates possible competition between kinds of herbivores for various plants. Grazing preference changes from time to time, especially between seasons, and between animal kinds and classes. Grazing preference does not necessarily reflect the ecological status of the plant within the plant community. For wildlife, plant preferences for food and plant suitability for cover are rated.
Preferred (P) – Percentage of plant in animal diet is greater than it occurs on the land
Desirable (D) – Percentage of plant in animal diet is similar to the percentage composition on the land
Undesirable (U) – Percentage of plant in animal diet is less than it occurs on the land
Not Consumed (N) – Plant would not be eaten under normal conditions. It is only consumed when other forages not available.
Toxic (T) – Rare occurrence in diet and, if consumed in any tangible amounts results in death or severe illness in animalHydrological functions
The site captures runoff water from surrounding sites. Playas are recharge sites for the Ogallala aquifer.
Recreational uses
Hunting, birdwatching, and nature study areas.
Wood products
None
Other products
None
Other information
None
Supporting information
Inventory data references
Old range site descriptions, condition class worksheets, and soil survey manuscripts were used in the development of this provisional ESD. USDA, Soil Survey Reports, Soil Series Narratives, USDA-NRCS Hatch, Gandhi and Brown, Checklist of the Vascular Plants of Texas (Texas A&M, 1990) Haukos and Smith, Common Flora of the Playa Lakes, Texas Tech University Press, 1997 Correll and Correll, Aquatic and Wetland Plants of the Southwestern United States, 1975
Other references
USDA-NRCS (Formerly Soil Conservation Service) Range Site Descriptions (1960s)
USDA-NRCS (Formerly Soil Conservation Service) Ag Handbook 296 (2006)Contributors
Colin Walden Range Specialist Stillwater OK
Steven McGowen, MLRA Office Leader, NRCS, Woodward, OKApproval
Bryan Christensen, 9/12/2023
Acknowledgments
Site Development and Testing Plan Future work, as described in a Project Plan, to validate the information in this Provisional Ecological Site Description is needed. This will include field activities to collect low, medium and high intensity sampling, soil correlations, and analysis of that data. Annual field reviews should be done by soil scientists and vegetation specialists. A final field review, peer review, quality control, and quality assurance reviews of the ESD will be needed to produce the final document. Annual reviews of the Project Plan are to be conducted by the Ecological Site Technical Team.
Rangeland health reference sheet
Interpreting Indicators of Rangeland Health is a qualitative assessment protocol used to determine ecosystem condition based on benchmark characteristics described in the Reference Sheet. A suite of 17 (or more) indicators are typically considered in an assessment. The ecological site(s) representative of an assessment location must be known prior to applying the protocol and must be verified based on soils and climate. Current plant community cannot be used to identify the ecological site.
Author(s)/participant(s) Contact for lead author Date 10/08/2026 Approved by Approval date Composition (Indicators 10 and 12) based on Annual Production Indicators
-
Number and extent of rills:
-
Presence of water flow patterns:
-
Number and height of erosional pedestals or terracettes:
-
Bare ground from Ecological Site Description or other studies (rock, litter, lichen, moss, plant canopy are not bare ground):
-
Number of gullies and erosion associated with gullies:
-
Extent of wind scoured, blowouts and/or depositional areas:
-
Amount of litter movement (describe size and distance expected to travel):
-
Soil surface (top few mm) resistance to erosion (stability values are averages - most sites will show a range of values):
-
Soil surface structure and SOM content (include type of structure and A-horizon color and thickness):
-
Effect of community phase composition (relative proportion of different functional groups) and spatial distribution on infiltration and runoff:
-
Presence and thickness of compaction layer (usually none; describe soil profile features which may be mistaken for compaction on this site):
-
Functional/Structural Groups (list in order of descending dominance by above-ground annual-production or live foliar cover using symbols: >>, >, = to indicate much greater than, greater than, and equal to):
Dominant:
Sub-dominant:
Other:
Additional:
-
Amount of plant mortality and decadence (include which functional groups are expected to show mortality or decadence):
-
Average percent litter cover (%) and depth ( in):
-
Expected annual annual-production (this is TOTAL above-ground annual-production, not just forage annual-production):
-
Potential invasive (including noxious) species (native and non-native). List species which BOTH characterize degraded states and have the potential to become a dominant or co-dominant species on the ecological site if their future establishment and growth is not actively controlled by management interventions. Species that become dominant for only one to several years (e.g., short-term response to drought or wildfire) are not invasive plants. Note that unlike other indicators, we are describing what is NOT expected in the reference state for the ecological site:
-
Perennial plant reproductive capability:
Print Options
Sections
Font
AAAAOther
PrintThe Ecosystem Dynamics Interpretive Tool is an information system framework developed by the USDA-ARS Jornada Experimental Range, USDA Natural Resources Conservation Service, and New Mexico State University.
Accessibility statement


