
Natural Resources
Conservation Service
-
Search


Major Land Resource Area or ecological site by name and/or ID.
PreviousSectionsNextGeneral information
Provisional. A provisional ecological site description has undergone quality control and quality assurance review. It contains a working state and transition model and enough information to identify the ecological site.
MLRA notes
Major Land Resource Area (MLRA): 051X–High Intermountain Valleys
This MLRA encompasses the San Luis Valley in south central Colorado and the Taos Plateau and Taos alluvial fans of north central New Mexico. As part of the northern portion of the Rio Grande Rift, the MLRA consists of large, alluvium filled basins washed down from adjacent mountain ranges. The Rio Grande River flows through this MLRA, continuing its long function of carrying mountain sediment down to the basin. Cenozoic volcanism is an extensive characteristic of the MLRA where large basalt flows with volcanic hills and domes are abundant. Ancient Lake Alamosa is a large feature within the MLRA..
LRU notes
A large portion of the San Luis Valley, north of Alamosa is a closed basin. Drainages flowing into this closed basin include: irrigation diversions from the Rio Grande River; Carnero, La Garita, and Saguache Creeks from the west; San Luis Creek from the north; and North Crestone and Sand creeks from the east. This low area or "sump" extends from San Luis Lake to the Blanca wetlands. As water flows into the closed basin it spreads out across the valley floor where it evaporates or infiltrates, recharging the underground aquifer.
Classification relationships
NRCS:
Major Land Resource Area 51, High Intermountain Valleys (United States Department of Agriculture, Natural Resources Conservation Service, 2006).
USFS:
331J – Northern Rio Grande Basin M331Ic > 331Ja - San Luis Valley, 331Jb - San Luis Hills and 331C - Mogotes
EPA:
22 - Arizona/New Mexico Plateau > 22a - San Luis Shrublands and Hills ; 22b -San Luis Alluvial Flats and Wetlands ; 22c - Salt Flats; 22e - Sand Dunes and Sand Sheets and 22f -Taos Plateau (Griffith, 2006).
USGS:
Southern Rocky Mountain ProvinceEcological site concept
This site exists in the lowest reaches of a closed basin. It is intermingled with the alkali overflow site and is correlated to the playa dunes component of the basin floor. Because the soils were developed from coarse, wind-blown material on the leeward side of a playa and erosion and deposition are a constant issue, this site can develop "hummocks" and the plant community exists as a sparse, uneven cover of grass and shrubs.
The site also exists on the leeward side of drainages throughout the drained basin. This site occurs where sand has been lifted and deposited to form small dunes with heights ranging from 2-15 feet and an area from a few square yards to 10 acres.Associated sites
R051XY314CO Alkali Overflow
The sand hummocks and the alkali overflow make up the major components of the playa system. The alkali overflow exists on the portions that is regularly flooded such as the playa floor, step, and slope. The sand hummocks exist on the playa dune.
R051XY264CO Chico Land
Chico land, like the salt flats exists on the alluvial flat, it is not part of the playa complex. Chico land is associated with the salt flats site where soils become higher in alkalinity and production is sparser.
R051XY267CO Salt Meadow
Salt Meadows occur as thin bands between the salt flats and the wet meadows. And sometimes the two are intermingled. Salt meadows support higher amounts of salt tolerant species such as alkali sacaton and inland saltgrass.
R051XY263CO Salt Flats
The salt flats exists adjacent to the playa floor on the alluvial flat. It is not part of the playa complex and is an upland site that is more stable with a mix of grasses and shrubs.
Similar sites
R051XY275CO Deep Sands 7-9 PZ
This site is coarse loamy; deep to very deep in depth and is non-saline. It occurs on dunes and sand sheets. Sand Hummocks occur as dunes in the playa and are saline.
Table 1. Dominant plant species
Tree Not specified
Shrub (1) Sarcobatus vermiculatus
Herbaceous (1) Distichlis spicata
(2) Sporobolus airoidesPhysiographic features
This site also occurs adjacent to drainages along the valley floor where alluvial material has been scoured, uplifted and blown onto landscapes creating a small dunes or hummocks. These hummocks have slopes which range from 3-15%; heights which range from 2-15 feet; and area ranging from a few square yards to 10 acres in size.
The playa dune is the linear or curvilinear ridge of windblown, sands removed from the adjacent basin by wind erosion, and deposited on the leeward (prevailing downwind) margin of a playa, playa basin, or saline basin.
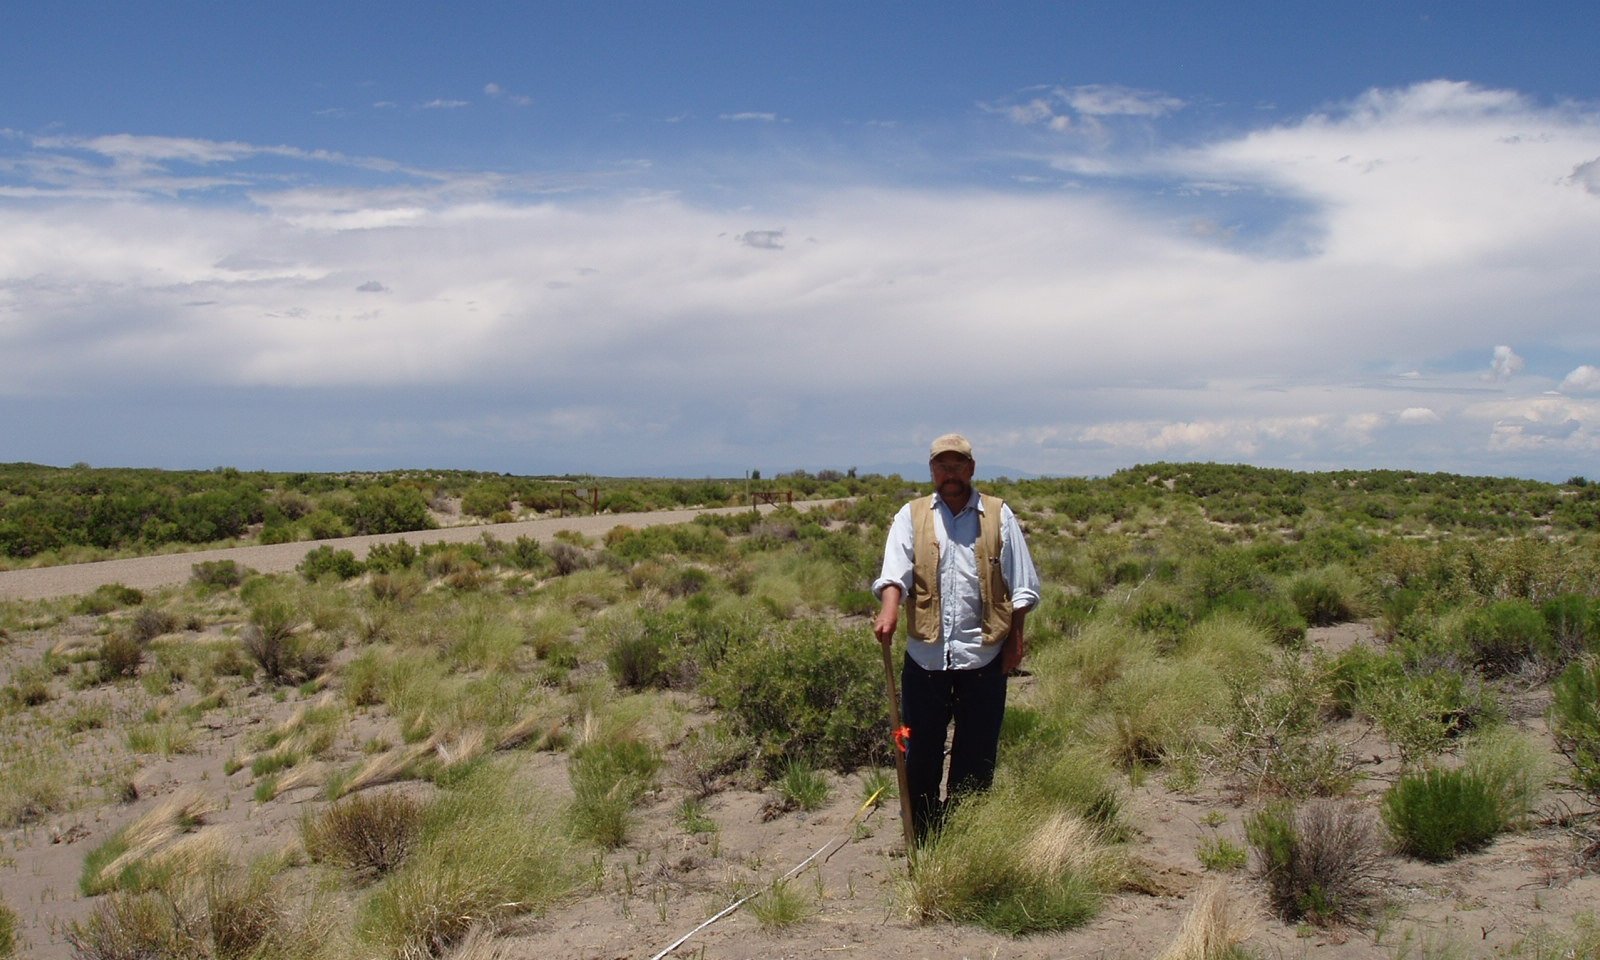
Figure 1. Sand Hummocks occurs on the playa dune landform

Figure 2. The Sand Hummocks on the playa dune in the foreground.
Table 2. Representative physiographic features
Landforms (1) Playa dune
(2) Dune
Runoff class Very low to low Flooding frequency None Ponding frequency None Elevation 7500 – 7900 ft Slope 0 – 25 % Aspect Aspect is not a significant factor Climatic features
The climate that typifies the High Intermountain Valley, ranges from arid to semi-arid, and is characterized by cold winters, moderate summers, and much sunshine. Average annual precipitation ranges from 6 to 10 inches along the valley floor and throughout most of the resource area. Approximately 55-60 percent of the annual precipitation falls between May 1 and September 1. May and June are normally dry. Precipitation comes mostly from short duration high intensity thundershowers in July and August. Wide seasonal and yearly variations are common. The San Juan mountain range to the west and the Sangre de Cristo Mountains to the east intercept much of the precipitation causing a two-way rain shadow effect.
Cold air from the encompassing mountain ranges drain into the valley and settle. This phenomena results in long cold winters and moderate summer temperatures. Mean average annual temperature ranges between 42 to 44 degrees F. July is the hottest month and January is the coldest. Summer temperatures range from highs in the upper 70’s and low 80’s and occasionally reach to the mid 90 degrees F. Summer nights are cool. Average frost-free period is 90-115 days, from late May or early June to September. There is a 50% probability that the first frost in the fall will occur near September 16, and the last frost in the spring on about June 9. Most major plant species initiate growth between mid May and late July, but growth may extend into September. Some cool season plants begin growth earlier and complete growth by mid June. There may be late re-growth on some of the plants.
Wind speeds average 7 miles per hour annually. Wind that often reaches high velocities are common, especially in the spring. Relative humidity is usually low. Even so, evaporation rates average lower than those of many dry regions because of the cooler climate. Snow cover is often light and is sometimes lacking through much of the winter. There is usually some snow, though, during the coldest weather.Table 3 Representative climatic features
Frost-free period (characteristic range) 70-90 days Freeze-free period (characteristic range) 100-120 days Precipitation total (characteristic range) 10-10 in Frost-free period (actual range) 70-90 days Freeze-free period (actual range) 90-120 days Precipitation total (actual range) 10-10 in Frost-free period (average) 80 days Freeze-free period (average) 110 days Precipitation total (average) 10 in Characteristic rangeActual rangeBarLineFigure 3. Monthly precipitation range
Characteristic rangeActual rangeBarLineFigure 4. Monthly minimum temperature range
Characteristic rangeActual rangeBarLineFigure 5. Monthly maximum temperature range
BarLineFigure 6. Monthly average minimum and maximum temperature
Figure 7. Annual precipitation pattern
Figure 8 Annual average temperature pattern
Climate stations used
-
(1) BLANCA 4 NW [USC00050776], Blanca, CO
-
(2) GREAT SAND DUNES NM [USC00053541], Mosca, CO
-
(3) ALAMOSA SAN LUIS AP [USW00023061], Alamosa, CO
-
(4) CENTER 4 SSW [USC00051458], Center, CO
">Influencing water features
Though this site is associated with the playa system the dune component is an upland position and does not receive the periodic flooding as the playa proper. A water table occurs occasionally on some sites in heavier material underlying the soil, but has little effect on plant growth, except for deep-rooted shrubs such as greasewood.
Soil features
The soils are deep, fine grained sands that are highly alkaline in reaction. Moisture enters the soil easily and moves down through the soil rapidly, favoring the fibrous-rooted bunchgrasses adapted to the sands of this climate. However, the high salt content and deep water table cause salt-tolerant grasses and shrubs to be predominant. The soils are loose and highly susceptible to damage from wind erosion. The typical taxonomic classification= Mixed, frigid Typic Torripsamments.
Typical soils correlated to this site is Corlett.Table 4. Representative soil features
Parent material (1) Eolian deposits – igneous and metamorphic rock
(2) Eolian sands
Surface texture (1) Fine sand
(2) Loamy fine sand
Family particle size Ecological dynamics
As wind and water move soils into areas of erosion and deposition, the site forms sandy hummocks or small dunes. A diversity and density of plants is key to maintaining ecological function and soil stability. Shrubs with deep tap roots that can reach to water and nutrients during drought anchors the site. Grasses provide surface cover which protects the soil from erosion and are sustained by fibrous root systems that take advantage of flash precipitation events. This site can erode quickly if adequate cover is not maintained and organic matter is lost from the soil.
State and transition model
More interactive model formats are also available. View Interactive Models
Click on state and transition labels to scroll to the respective textEcosystem states
State 1 submodel, plant communities
State 2 submodel, plant communities
State 1
Reference
Figure 9. Reference state with shrubs and grasses
The reference state has a mix of shrubs, grass and forbs. It provides the greatest soil stability and ecological services. Bare ground is minimal, creating maximum protection against soil erosion processes.
Resilience management. As occupying a playa dune landform this site is a sink for windblown material and must therefore have a healthy plant community to withstand both erosion and deposition. A high diversity of shrubs, grass, and forbs with minimal bare soil will help sustain ecosystem process and keep the soil stable. Shrubs with deep tap roots that can extend to water and nutrients anchor the site and helps it sustain droughts. Grasses provide litter and cover to help protect the soil surface from wind and soil erosion. Their fibrous root systems also takes advantage of flash precipitation events and provides a valuable source of organic material which stores water and strengthens aggregate stability.
Community 1.1
Shrub and Grass Mix
Figure 10. Shrub-Grass Mix

Figure 11. A mix of bunch and rhizomotous grass species
This plant community has a shrub-grass mix where the production scales vary between exhibiting greater amounts of shrubs, and at times greater amounts of grasses. Bare areas are minimal and plants stabilize the soil.
Resilience management. This plant community provides the greatest number of ecosystem services and stability to the site.
Dominant plant species
-
greasewood (Sarcobatus vermiculatus), shrub
-
saltgrass (Distichlis spicata), grass
-
alkali sacaton (Sporobolus airoides), grass
-
Indian ricegrass (Achnatherum hymenoides), grass
-
sand dropseed (Sporobolus cryptandrus), grass
-
alkali cordgrass (Spartina gracilis), grass
-
alkali wildrye (Leymus simplex), grass
-
lemon scurfpea (Psoralidium lanceolatum), other herbaceous
Figure 12. Annual production by plant type (representative values) or group (midpoint values)
Table 5. Annual production by plant type
Plant type Low
(lb/acre)Representative value
(lb/acre)High
(lb/acre)Grass/Grasslike 195 290 375 Shrub/Vine 90 135 180 Forb 15 25 45 Total 300 450 600 Figure 13. Plant community growth curve (percent production by month). CO5102 , Warm season dominant, cool season sub-dominant; MLRA-51; coarse textured soils.
Jan Feb Mar Apr May Jun Jul Aug Sep Oct Nov Dec J F M A M J J A S O N D 0 0 0 2 15 25 30 20 8 0 0 0 Community 1.2
Shrub Dominant
Figure 14. Shrubs dominant with grasses and forbs minor components

Figure 15. Area of soil instability due to deposition. The shrubs keep the site from further erosion.
This plant community is heavy on the shrubs and light on the grass. Over time shrubs have increased due to their competitive advantage when disturbances occur.
Pathway 1.1A
Community 1.1 to 1.2
Shrub and Grass Mix
Shrub DominantA slow increase in shrubs and a decrease in grass. This can be due to natural or man caused disturbance. Shrubs have the natural competitive advantage to withstand drought with its deep tap root, ability to capture snow drift, and shade cover for the soil surface.
Pathway 1.2A
Community 1.2 to 1.1
Shrub Dominant
Shrub and Grass MixThere is a set back in shrubs and a favorable environment for an increase in grasses.
State 2
Degraded
Figure 16. Accelerated soil loss
This site has very low soil stability manifesting in recent areas of erosion and deposition. Plant species diversity and production is low with a few hardy species hanging on. Sandy hills can be "blown out" when cover is lost.
Community 2.1
Extreme Soil Instability
This community is very low in diversity, cover, and production. There is evidence of extreme soil movement. Ecological services are lowest with this community.
Community 2.2
Initial Stabilization
Soil is starting to stabilize with colonization of remnant shrubs and grasses.
Pathway 2.1A
Community 2.1 to 2.2
Extreme Soil Instability
Initial StabilizationColonization of remnant shrubs and grasses. Alkali sacaton and saltgrass has been observed to survive through harsh, unstable degradation, only to respond with a strong precipitation season.
Pathway 2.2A
Community 2.2 to 2.1
Initial Stabilization
Extreme Soil InstabilityInitial colonization is set back with further disturbance.
Transition T1A
State 1 to 2
Reference
DegradedThe major long-term driver is repetitive defoliation at high utilization, especially during drought. Plants lose vigor, become stressed and die. The reduction of cover and root systems causes feedback loops which weaken ecological processes and exacerbates soil loss.
Restoration pathway R2A
State 2 to 1
Degraded
ReferenceThe soil needs to re-stabilized through increased organic matter from the re-establishment of plants. This can begin to occur during a favorable precipitation season where remnant grasses can quickly expand and start to stabilize the soil. Great care must be taken to minimize grazing during the critical early stage of recovery.
Additional community tables
Table 6. Community 1.1 plant community composition
Group Common name Symbol Scientific name Annual production () Foliar cover (%) Grass/Grasslike1 200–350 saltgrass DISP Distichlis spicata 45–90 – alkali sacaton SPAI Sporobolus airoides 30–60 – western wheatgrass PASM Pascopyrum smithii 30–60 – Indian ricegrass ACHY Achnatherum hymenoides 30–60 – blue grama BOGR2 Bouteloua gracilis 30–60 – thickspike wheatgrass ELLAL Elymus lanceolatus ssp. lanceolatus 15–30 – needle and thread HECOC8 Hesperostipa comata ssp. comata 1–10 – sandhill muhly MUPU2 Muhlenbergia pungens 1–10 – blowout grass REFL Redfieldia flexuosa 1–10 – alkali cordgrass SPGR Spartina gracilis 1–10 – sand dropseed SPCR Sporobolus cryptandrus 1–10 – Forb2 15–50 aster ASTER Aster 1–5 – snowball sand verbena ABFR2 Abronia fragrans 0–3 – Rocky Mountain beeplant CLSE Cleome serrulata 0–3 – annual buckwheat ERAN4 Eriogonum annuum 0–3 – tenpetal blazingstar MEDE2 Mentzelia decapetala 0–3 – crownleaf evening primrose OECO2 Oenothera coronopifolia 0–3 – lemon scurfpea PSLA3 Psoralidium lanceolatum 0–3 – Shrub/Vine3 100–175 greasewood SAVE4 Sarcobatus vermiculatus 45–90 – fourwing saltbush ATCA2 Atriplex canescens 30–60 – rubber rabbitbrush ERNAC2 Ericameria nauseosa ssp. consimilis 30–60 – Greene's rabbitbrush CHGR6 Chrysothamnus greenei 15–30 – plains pricklypear OPPO Opuntia polyacantha 0–6 – Table 7. Community 1.2 plant community composition
Group Common name Symbol Scientific name Annual production () Foliar cover (%) Table 8. Community 2.1 plant community composition
Group Common name Symbol Scientific name Annual production () Foliar cover (%) Table 9. Community 2.2 plant community composition
Group Common name Symbol Scientific name Annual production () Foliar cover (%) Interpretations
Supporting information
Inventory data references
Location of Typical Example Site: San Luis Lakes and Dry Lakes area northeast of Alamosa, Alamosa County. Field Offices in Colorado where the site occurs: Alamosa, and Center
References
-
. 2021 (Date accessed). USDA PLANTS Database. http://plants.usda.gov.
Other references
Chapman, S.S., G.E. Griffith, J.M. Omernik, A.B. Price, J. Freeouf, and D.L. Schrupp. 2006. Ecoregions of Colorado. (2-sided color posterwith map, descriptive text, summary tables, and photographs). U.S. Geological Survey, Reston, VA. Scale 1:1,200,000.
Cleland, D.T.; Freeouf, J.A.; Keys, J.E.; Nowacki, G.J.; Carpenter, C.A.; and McNab, W.H. 2007. Ecological Subregions: Sections andSubsections for the conterminous United States. Gen. Tech. Report WO-76D [Map on CD-ROM] (A.M. Sloan, cartographer). Washington,DC: U.S. Department of Agriculture, Forest Service, presentation scale 1:3,500,000; colored.
Soil Conservation Service (SCS). August 1975. Range Site Description for Sand Hummocks #312. : USDA, Denver Colorado.
United States Department of Agriculture, Natural Resources Conservation Service. 2006. Land Resource Regions and Major Land Resource Areas of the United States, the Caribbean, and the Pacific Basin. U.S. Department of Agriculture Handbook 296.Approval
Kirt Walstad, 12/12/2024
Acknowledgments
Project Staff: Suzanne Mayne-Kinney, Ecological Site Specialist, NRCS MLRA, Grand Junction SSO Alan Stuebe, MLRA Soil Survey Leader, NRCS MLRA Alamosa SSO Program Support: Rachel Murph, NRCS CO State Rangeland Management Specialist, Denver Eva Muller, Regional Director, Rocky Mountain Regional Soil Survey Office, Bozeman, MT B.J. Shoup, CO State Soil Scientist, Denver Eugene Backhaus, CO State Resource Conservationist, Denver --Site Development and Testing Plan--: Future work to validate and further refine the information in this Provisional Ecological Site Description is necessary. This will include field activities to collect low-, medium-, and high-intensity sampling, soil correlations, and analysis of that data. Additional information and data are required to refine the Plant Production and Annual Production tables for this ecological site. The extent of MLRA 51 must be further investigated. Field testing of the information contained in this Provisional ESD is required. As this ESD is moved to the Approved ESD level, reviews from the technical team, quality control, quality assurance, and peers will be conducted.
Rangeland health reference sheet
Interpreting Indicators of Rangeland Health is a qualitative assessment protocol used to determine ecosystem condition based on benchmark characteristics described in the Reference Sheet. A suite of 17 (or more) indicators are typically considered in an assessment. The ecological site(s) representative of an assessment location must be known prior to applying the protocol and must be verified based on soils and climate. Current plant community cannot be used to identify the ecological site.
Author(s)/participant(s) C. Villa, H. Garcia Contact for lead author Rachel Meade, CO NRCS State Rangeland Management Specialist Date 12/15/2004 Approved by Approval date Composition (Indicators 10 and 12) based on Annual Production Indicators
-
Number and extent of rills:
None -
Presence of water flow patterns:
None -
Number and height of erosional pedestals or terracettes:
Pedestalled plants are common at or near wind scoured areas. -
Bare ground from Ecological Site Description or other studies (rock, litter, lichen, moss, plant canopy are not bare ground):
45-60% bare ground, with bare patches ranging from 18-24 inches in diameter. Prolonged drought will cause bare ground to increase upwards to 75% with bare patches ranging from 24-36 inches in diameter. -
Number of gullies and erosion associated with gullies:
None -
Extent of wind scoured, blowouts and/or depositional areas:
Wind scouring is inherent to this site. Soil movement can intensify with disturbances such as grazing disturbance and extended drought. -
Amount of litter movement (describe size and distance expected to travel):
Litter will move on this site. Interspaces can be void of litter. Litter collects around base of established vegetation. -
Soil surface (top few mm) resistance to erosion (stability values are averages - most sites will show a range of values):
Stability class rating anticipated to be 2-3 in interspace at soil surface. -
Soil surface structure and SOM content (include type of structure and A-horizon color and thickness):
Soils are deep, excessively drained with a low water holding capacity and rapid permeability. Surface soils are fine sand to loamy fine sand. The A-horizon averages 0-7 inches in depth with a light brownish gray to dark grayish brown color. Single grain and loose granular structure. -
Effect of community phase composition (relative proportion of different functional groups) and spatial distribution on infiltration and runoff:
Plant community composition and spatial distribution of functional groups has little effect on infiltration and runoff on this site. Soil features control hydrologic characteristics. -
Presence and thickness of compaction layer (usually none; describe soil profile features which may be mistaken for compaction on this site):
None -
Functional/Structural Groups (list in order of descending dominance by above-ground annual-production or live foliar cover using symbols: >>, >, = to indicate much greater than, greater than, and equal to):
Dominant:
shrubs >Sub-dominant:
warm season bunchgrass = cool season rhizomatous grass > warm season rhizomatous >Other:
cool season bunchgrass > forbsAdditional:
-
Amount of plant mortality and decadence (include which functional groups are expected to show mortality or decadence):
Minimal. Extended drought will cause mortality and decadence to increase above what naturally occurs. -
Average percent litter cover (%) and depth ( in):
10-15% litter cover or less at 0.25 inch depth. Litter cover during and following drought can range from 0-10%. -
Expected annual annual-production (this is TOTAL above-ground annual-production, not just forage annual-production):
300 lbs./ac. low precipitation years; 450 lbs./ac. average precipitation years; 600 lbs./ac. high precipitation years. After extended drought, production will be reduced by 150 – 200 lbs./ac. or more. -
Potential invasive (including noxious) species (native and non-native). List species which BOTH characterize degraded states and have the potential to become a dominant or co-dominant species on the ecological site if their future establishment and growth is not actively controlled by management interventions. Species that become dominant for only one to several years (e.g., short-term response to drought or wildfire) are not invasive plants. Note that unlike other indicators, we are describing what is NOT expected in the reference state for the ecological site:
Foxtail barley -
Perennial plant reproductive capability:
The only limitations are weather-related, natural disease, and insects that may temporarily reduce reproductive capability.
Print Options
Sections
Font
AAAAOther
PrintThe Ecosystem Dynamics Interpretive Tool is an information system framework developed by the USDA-ARS Jornada Experimental Range, USDA Natural Resources Conservation Service, and New Mexico State University.
Accessibility statement


