
Natural Resources
Conservation Service
-
Search


Major Land Resource Area or ecological site by name and/or ID.
PreviousSectionsNextGeneral information
Provisional. A provisional ecological site description has undergone quality control and quality assurance review. It contains a working state and transition model and enough information to identify the ecological site.
MLRA notes
Major Land Resource Area (MLRA): 051X–High Intermountain Valleys
This MLRA encompasses the San Luis Valley in south central Colorado and the Taos Plateau and Taos alluvial fans of north central New Mexico. As part of the northern portion of the Rio Grande Rift, the MLRA consists of large, alluvium filled basins washed down from adjacent mountain ranges. The Rio Grande River flows through this MLRA, continuing its long function of carrying mountain sediment down to the basin. Cenozoic volcanism is an extensive characteristic of the MLRA where large basalt flows with volcanic hills and domes are abundant. Ancient Lake Alamosa is a large feature within the MLRA.
Classification relationships
NRCS:
Major Land Resource Area 51, High Intermountain Valleys (United States Department of Agriculture, Natural Resources Conservation Service, 2006).
USFS:
331J – Northern Rio Grande Basin M331Ic > 331Ja - San Luis Valley, 331Jb - San Luis Hills and 331C - Mogotes
EPA:
22 - Arizona/New Mexico Plateau > 22a - San Luis Shrublands and Hills ; 22b -San Luis Alluvial Flats and Wetlands ; 22c - Salt Flats; 22e - Sand Dunes and Sand Sheets and 22f -Taos Plateau (Griffith, 2006).
USGS:
Southern Rocky Mountain ProvinceEcological site concept
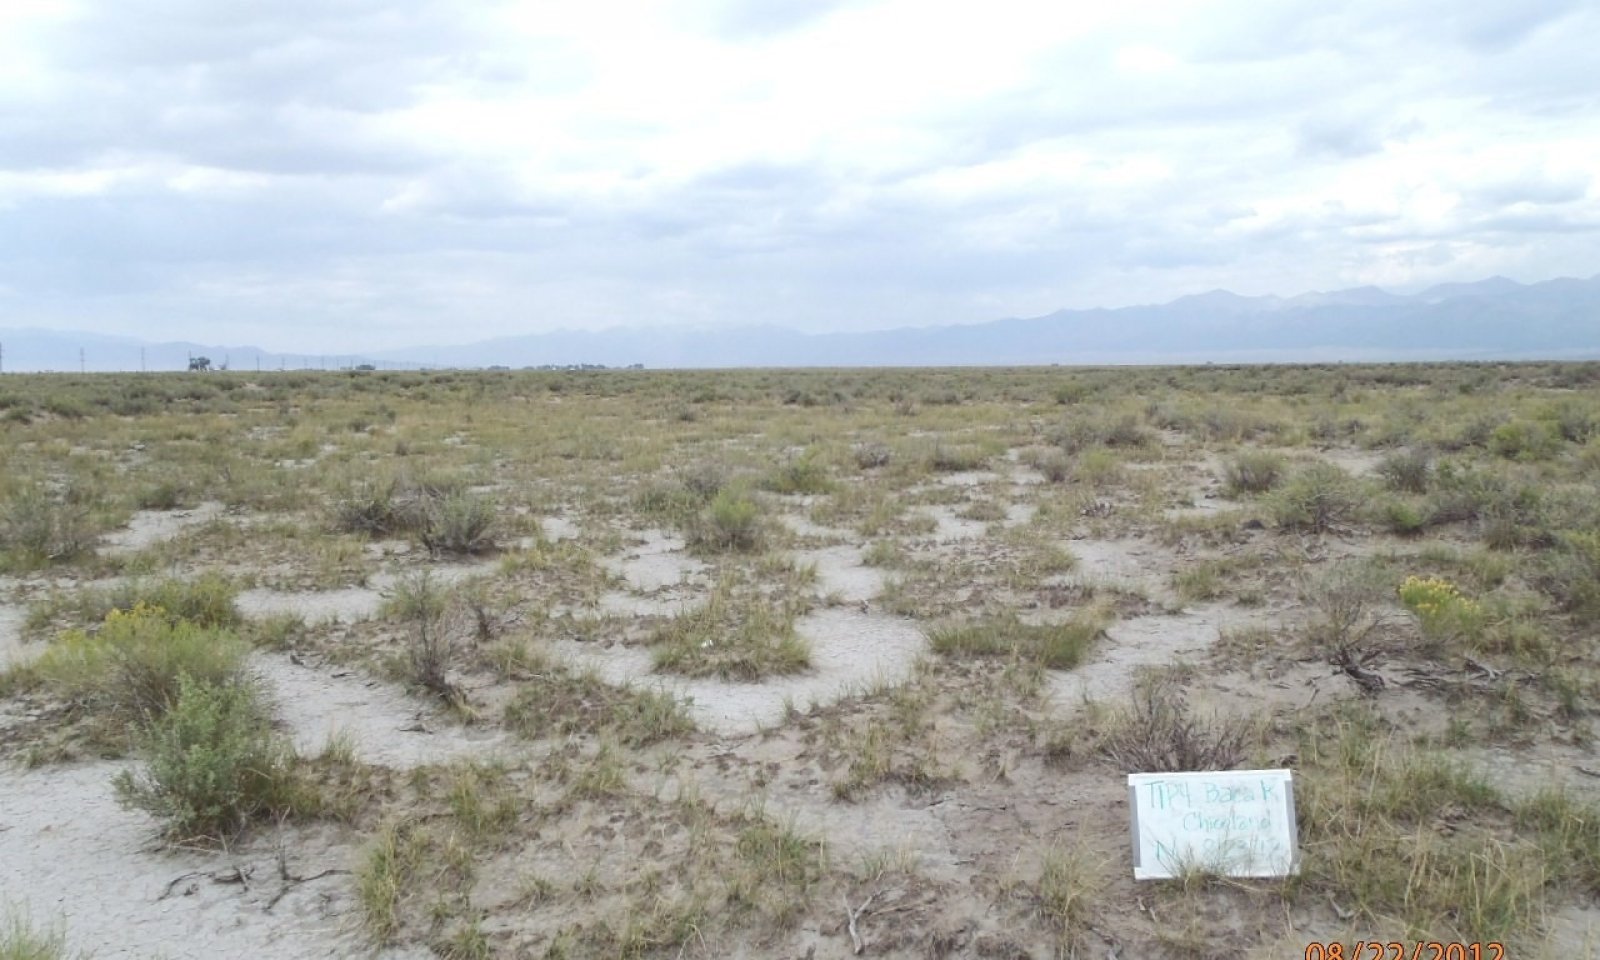
This site occurs on the broad central floor of the San Luis Valley. Elevation ranges from 7500 to 7750 feet. This site occurs in association with Salt Flats and Salt Meadow sites and is very similar to the Salt Flats site. Chico land exhibits extensive areas of "slick spots" and typically supports large stands of greasewood. Alkali sacaton, and inland saltgrass are dominant grasses. Soils are highly alkali with clayey subsoil which inhibits water infiltration and productivity.
Associated sites
R051XY312CO Sand Hummocks
Chico Land sites are found adjacent to and interspersed with Sand Hummocks along the eastern side of the San Luis Valley and throughout Alamosa County. The Chico Land exists on the alluvial flat while sand hummocks is part of the playa complex.
R051XY314CO Alkali Overflow
Chico Land sites are found adjacent to and on slightly higher ground than Alkali Overflow sites in Alamosa and Saguache Counties. In some areas around the Blanca Wetlands Chico Land sites intergrade into Alkali Overflow sites. Chico land resides on the alluvial flat while alkali overflow is associated with the playa complex.
R051XY267CO Salt Meadow
Chico Land sites can be found adjacent to and on slightly higher ground than Salt Meadow sites. Salt Meadows have access to extra water due to higher flooding frequency and higher water table. Salt Meadows are grass dominated while chico land has a strong shrub component.
R051XY263CO Salt Flats
Chico land is higher in clay content with greater slick spots, higher in alkalinity and is less vegetatively productive than salt flats.
R051XY294CO Valley Sand
Valley sand occurs throughout the alluvial flat of the basin floor where soils are course textured.
R051XY264CO Chico Land
Similar sites
R051XY263CO Salt Flats
R051XE260CO Chico Fan 8-12 PZ
R051XY314CO Alkali Overflow

Figure 1.
Table 2. Dominant plant species
Tree Not specified
Shrub (1) Sarcobatus vermiculatus
Herbaceous (1) Sporobolus airoides
(2) Distichlis spicataPhysiographic features
This site occurs within the basin floor of the San Luis Valley. Elevation ranges from 7500 to 7800 feet. Landforms include flood plains on valley floors and alluvial flats.
Table 3. Representative physiographic features
Landforms (1) Flood plain
(2) Valley floor
(3) Alluvial flat
(4) Deflation basin
Runoff class Medium Flooding frequency None Ponding frequency None Elevation 7500 – 7800 ft Slope 0 – 2 % Water table depth 48 – 72 in Aspect Aspect is not a significant factor Climatic features
The climate that typifies the High Intermountain Valley, ranges from arid to semi-arid, and is characterized by cold winters, moderate summers, and much sunshine. Average annual precipitation ranges from 6 to 10 inches along the valley floor and throughout most of the resource area. Approximately 55-60 percent of the annual precipitation falls between May 1 and September 1. May and June are normally dry. Precipitation comes mostly from short duration high intensity thundershowers in July and August. Wide seasonal and yearly variations are common. The San Juan mountain range to the west and the Sangre de Cristo Mountains to the east intercept much of the precipitation causing a two-way rain shadow effect.
Cold air from the encompassing mountain ranges drain into the valley and settle. This phenomena results in long cold winters and moderate summer temperatures. Mean average annual temperature ranges between 42 to 44 degrees F. July is the hottest month and January is the coldest. Summer temperatures range from highs in the upper 70’s and low 80’s and occasionally reach to the mid 90 degrees F. Summer nights are cool. Average frost-free period is 90-115 days, from late May or early June to September. There is a 50% probability that the first frost in the fall will occur near September 16, and the last frost in the spring on about June 9. Most major plant species initiate growth between mid May and late July, but growth may extend into September. Some cool season plants begin growth earlier and complete growth by mid June. There may be late re-growth on some of the plants.
Wind speeds average 7 miles per hour annually. Wind that often reaches high velocities are common, especially in the spring. Relative humidity is usually low. Even so, evaporation rates average lower than those of many dry regions because of the cooler climate. Snow cover is often light and is sometimes lacking through much of the winter. There is usually some snow, though, during the coldest weather.Table 4 Representative climatic features
Frost-free period (characteristic range) 70-80 days Freeze-free period (characteristic range) 100-110 days Precipitation total (characteristic range) 10-10 in Frost-free period (actual range) 70-80 days Freeze-free period (actual range) 90-110 days Precipitation total (actual range) 10-10 in Frost-free period (average) 80 days Freeze-free period (average) 100 days Precipitation total (average) 10 in Characteristic rangeActual rangeBarLineFigure 1. Monthly precipitation range
Characteristic rangeActual rangeBarLineFigure 2. Monthly minimum temperature range
Characteristic rangeActual rangeBarLineFigure 3. Monthly maximum temperature range
BarLineFigure 4. Monthly average minimum and maximum temperature
Figure 5. Annual precipitation pattern
Figure 6 Annual average temperature pattern
Climate stations used
-
(1) MANASSA [USC00055322], La Jara, CO
-
(2) MONTE VISTA 2W [USC00055706], Monte Vista, CO
-
(3) CENTER 4 SSW [USC00051458], Center, CO
-
(4) ALAMOSA SAN LUIS AP [USW00023061], Alamosa, CO
-
(5) WAVERLY 1W [USC00058860], Alamosa, CO
">Influencing water features
Seasonal high water table exists from 4 to 6 feet below the surface. The water table can be found usually June thru September. Lower areas may receive low amounts of run-on from adjacent higher areas.
Soil features
Soil surface textures are fine-loamy. Clay content in the surface ranges from 25 to 35%. They are strongly alkaline. They are usually underlain by sand and gravel and this shows are a restrictive feature in the soil at 20 to 40 inches (50 to 100 cm) . Large areas of "slick spots" are mottled throughout the site where particles are highly dispersed causing impermeable soils with virtually no penetration of water. Runoff from rain or snow melt sit in these lower slick spot areas until evaporation occurs.
Typical soil correlated to this site is Hooper.Table 5. Representative soil features
Parent material (1) Alluvium – igneous and metamorphic rock
(2) Alluvium – volcanic rock
Surface texture (1) Clay loam
Family particle size (1) Fine-loamy over sandy or sandy-skeletal
Drainage class Well drained Permeability class Very slow to slow Depth to restrictive layer 20 – 40 in Soil depth 60 – 120 in Surface fragment cover <=3" Not specified Surface fragment cover >3" Not specified Available water capacity
(Depth not specified)3.8 – 5.2 in Calcium carbonate equivalent
(Depth not specified)0 – 5 % Electrical conductivity
(Depth not specified)4 – 8 mmhos/cm Sodium adsorption ratio
(Depth not specified)0 – 1 Soil reaction (1:1 water)
(Depth not specified)8.5 – 9.6 Subsurface fragment volume <=3"
(Depth not specified)0 – 10 % Subsurface fragment volume >3"
(Depth not specified)0 – 2 % Ecological dynamics
The structural-functional groups are mostly a mix of shrubs and grasses with a few forbs. The plant community in the sodium dispersed clay areas or slick spots is almost exclusively black greasewood with occasional patches of inland saltgrass. Alkali sacaton is the dominant grass with patches of inland saltgrass. Grasses which occur in minor amounts include alkali cordgrass, creeping (alkali) wildrye, mat muhly, and an occasional plant of blue grama. Baltic rush occurs in the wetter areas which receive runoff from rain or snowmelt. Rubber rabbitbrush occurs with black greasewood where the loamy sand surface is deeper. Green rabbitbrush and an occasional prickly pear plant may occur on higher knolls.
State and transition model
More interactive model formats are also available. View Interactive Models
Click on state and transition labels to scroll to the respective textEcosystem states
State 1 submodel, plant communities
State 2 submodel, plant communities
State 3 submodel, plant communities
State 1
Reference
Figure 7. Reference: shrub-grass mix
The reference state provides the greatest amount of ecological resilience. The plant community mix slightly favors shrubs over grasses with air-dry weight. Vegetation is patchy with open slick spot areas present throughout the site. Black greasewood is the dominant shrub while alkali sacaton is the dominant grass.The soil is stable with the A horizon intact.
Dominant plant species
-
greasewood (Sarcobatus vermiculatus), shrub
-
alkali sacaton (Sporobolus airoides), grass
Community 1.1
Black Greasewood and Alkali Sacaton
Figure 8. Reference

Figure 9. Bare ground or slick spots forming continuous patches.
Alkali Sacaton is the dominant grass, with associated inland saltgrass. Grasses which occur in minor amounts include: alkali cordgrass, alkali wildrye, western wheatgrass, mat muhly, and an occasional blue grama plant. Bare ground or slick spots are mottled through the site. Greasewood is the dominant shrub.
Dominant plant species
-
greasewood (Sarcobatus vermiculatus), shrub
-
rubber rabbitbrush (Ericameria nauseosa), shrub
-
alkali wildrye (Leymus simplex), shrub
-
alkali sacaton (Sporobolus airoides), grass
-
saltgrass (Distichlis spicata), grass
Figure 10. Annual production by plant type (representative values) or group (midpoint values)
Table 6. Annual production by plant type
Plant type Low
(lb/acre)Representative value
(lb/acre)High
(lb/acre)Shrub/Vine 140 200 260 Grass/Grasslike 100 150 200 Forb 10 25 40 Total 250 375 500 Figure 11. Plant community growth curve (percent production by month). CO5104 , Warm season dominant, cool season sub-dominant MLRA-51; valley floor- fine textured soils.
Jan Feb Mar Apr May Jun Jul Aug Sep Oct Nov Dec J F M A M J J A S O N D 0 0 0 3 30 35 15 10 5 2 0 0 Community 1.2
Shrub Dominant
Figure 12. Shrub dominant
This community phase is dominated by shrubs, especially greasewood. Rubber rabbitbrush has also increased on the site. Grasses such as alkali sacaton have decreased. Overall annual production is less.
Pathway 1.1A
Community 1.1 to 1.2
Black Greasewood and Alkali Sacaton
Shrub DominantTime and colonization of shrub species plus repetitive, high utilization of palatable species that does not allow for the regrowth and recovery during the growing season. These drivers slowly decrease grass cover and density while shrubs gain a competitive advantage.
Pathway 1.2A
Community 1.2 to 1.1
Shrub Dominant
Black Greasewood and Alkali SacatonAn event to set the shrubs back, such as disease, drought, fire, mechanical, or chemical. This coupled with managed grazing that takes into account critical growth periods for warm and cool season grasses plus the monitoring of intensity and frequency of grazing events will help in the building of soil and colonization of plants.
State 2
Degraded
Figure 13. Degraded Chico Land
Palatable species such as alkali sacaton, western wheatgrass, and alkali cordgrass have become a remnant or are no longer present. The degraded state is sparsely dominated by shrubs such as greasewood and rubber rabbitbrush. There may be a remnant of inland saltgrass, and annuals. The degraded state is greater than 70 percent bare ground. Erosion and deposition have a significant negative impact, creating feedback loops that substantially decreases hydrologic function.
Community 2.1
Eroded
Figure 14. Unstable soil
This community phase has a loss of topsoil due to erosion and absence of plant cover.
Community 2.2
Early Recovery
Figure 15. A wet spring showing shoots of alkali wildrye and alkali chordgrass, along with Russian knapweed.
This community has much bare ground and unstable soil but has started the restoration process with a small percentage of perennial, native plant species.
Resilience management. This is a fragile time where additional disturbance may put an end to restoration efforts.
Pathway 2.1A
Community 2.1 to 2.2
Eroded
Early RecoveryTimely precipitation events in the spring and early summer, coupled with rest from grazing may allow perennial, native species to begin colonization.
Pathway 2.2A
Community 2.2 to 2.1
Early Recovery
ErodedAfter early signs of restoration further disturbance dries up the young shoots and roots of reference species and the site reverts back to the eroded state.
State 3
Irrigation Tail Water InfluencedCommunity 3.1
Irrigation Tail Water InfluencedSometimes this site gets regular saturation from stream overflow or irrigation. If this happens for multiple years both black greasewood and alkali sacaton will decrease and inland saltgrass and baltic rush will increase. Greasewwod does not mind being flooded unless the water sits for over 40 days, then it will begin die-off. Alkali sacaton will die off if water sits for over 3 weeks, continuously. Noxious weeds such as tall whitetop and perennial pepperweed may invade and dominate areas.
Transition T1A
State 1 to 2
Reference
DegradedA major long-term driver is repetitive defoliation at high utilization for plants throughout multiple growing seasons and especially during drought. Plant species such as alkali sacaton, alkali cordgrass, and western wheatgrass are greatly decreased and may be lost. Greasewood also gets grazed and starts to lose vitality over time. This in turn increases both erosion and deposition, causing a decrease in soil stability and hydrologic function. A trigger event, such as drought may snap the site across the degraded threshold by causing excessive mortality to plants with low vigor.
Transition T1B
State 1 to 3A regular accumulation of water over multiple years causes a species shift to more water tolerant plants such as inland saltgrass and baltic rush.
Restoration pathway R2A
State 2 to 1
Degraded
ReferenceRestoration will take a long time as the site itself is harsh on plants and with an decrease in soil stability due to erosion hydrologic function is very low. A slow process of plant and soil building is necessary to restore ecological processes. In theory, renewed grazing management can be part of the restoration process. It would require planning and monitoring to allow for moderate frequency and intensity along with adequate recovery periods during the growing season. An abundance of litter and cover must be left during the dormant season to aid in moisture retention and slow erosion. Monitoring for plant and soil ecological processes is important for restoration success.
Restoration pathway R3A
State 3 to 1An end to water saturation followed by years of grazing management and monitoring that allows for the colonization of reference species. This state may take many years to restore depending on the amount of soil erosion and accumulated salts form years of irrigation.
Additional community tables
Table 7. Community 1.1 plant community composition
Group Common name Symbol Scientific name Annual production () Foliar cover (%) Grass/Grasslike1 125–175 alkali sacaton SPAI Sporobolus airoides 80–120 – saltgrass DISP Distichlis spicata 40–50 – alkali wildrye LESI5 Leymus simplex 5–15 – western wheatgrass PASM Pascopyrum smithii 0–8 – alkali cordgrass SPGR Spartina gracilis 0–8 – mat muhly MURI Muhlenbergia richardsonis 0–8 – mountain rush JUARL Juncus arcticus ssp. littoralis 0–8 – needleleaf sedge CADU6 Carex duriuscula 0–4 – blue grama BOGR2 Bouteloua gracilis 0–4 – wildrye ELYMU Elymus 0–4 – Forb2 10–40 western tansymustard DEPI Descurainia pinnata 0–4 – seepweed SUAED Suaeda 0–2 – tanseyleaf tansyaster MATA2 Machaeranthera tanacetifolia 0–2 – Pursh seepweed SUCA2 Suaeda calceoliformis 0–2 – red swampfire SARU Salicornia rubra 0–2 – Shrub/Vine3 150–250 greasewood SAVE4 Sarcobatus vermiculatus 160–240 – rubber rabbitbrush ERNA10 Ericameria nauseosa 0–20 – Greene's rabbitbrush CHGR6 Chrysothamnus greenei 0–8 – plains pricklypear OPPO Opuntia polyacantha 0–4 – Table 8. Community 1.2 plant community composition
Group Common name Symbol Scientific name Annual production () Foliar cover (%) Table 9. Community 2.1 plant community composition
Group Common name Symbol Scientific name Annual production () Foliar cover (%) Table 10. Community 2.2 plant community composition
Group Common name Symbol Scientific name Annual production () Foliar cover (%) Table 11. Community 3.1 plant community composition
Group Common name Symbol Scientific name Annual production () Foliar cover (%) Interpretations
Animal community
This site offers only limited value for livestock grazing because of the low production, high percentage of unpalatable species, and because of the vast areas of "slick spots" which have little or no vegetation. These grasses and shrubs can provide fair nutrition for grazing animals, however, if properly managed. Care should be exercised when grazing pastures which are dominated by this site, to avoid nutritional stress.
A planned grazing system should be used which benefits both early and later season grasses. Grazing periods should be kept relatively short, and adequate rest provided prior to re-grazing. This type of rotational grazing, if carefully monitored, will provide the highest level of production and nutrition for grazing animals. Spring rest for May 1 to June 20 benefits cool-season plants such as western wheatgrass and creeping wildrye. While rest from June through July would be most beneficial to alkali sacaton and alkali cordgrass. Dormant season grazing greatly favors the plants of this site and allows for recovery during the growing season. Chemical brush control would effectively reduce black greasewood, however, adequate grass cover of alkali sacaton should exist prior to spraying. If rubber rabbitbrush is part of the community, the brush control must be conducted just as the rabbitbrush is beginning to flower, otherwise it will respond to the disturbance with an increase in population. A least greasewood provides good browse. Most of this site, consequently, is not suited for brush management. Any attempts at reseeding would result in total failure.
b. Guide to Initial Stocking Rates:
(1) Stocking rates given below are based on continuous use for the entire growing season, and are intended only as an intitial guide. Forage needs are calculated on the basis of 900 lbs of air-dry forage per animal unit month (AUM). To maintain proper use and allow for forage that disappears through trampling, small herbivore use, weathering, etc., 35% of the palatable forage produced is considered avaialable for grazing by large herbivores.
Condition Class/ % Climax Vegetation/ Ac/AUM 1/ AUM/Ac 1
excellent/ 76-100/ 15/ .07
good/ 51-75/ 25/ .04
fair/ 26-50/ 40/ .03
poor/ 0-25/ 55/ .02
Due to the high amount of bare ground in the mapping units, the stocking rates have been adjusted accordingly.
Adjustments to the initial stocking rates should be made as needed to obtain proper use. With specialized grazing systems, large livestock breeds, uncontrolled big game herbivores, inaccessability, dormant season use, presence of introduced species, etc., stocking rate adjustments will be required.
Major Poisonous Plants to Livestock:
Plant Common Name/ Livestock Affected/ Type of Poisoning/ Season Serious
Black greasewood/ sheep, cattle/ acute/ spring
The relative value of this site for wildlife is low. As ecological degradation occurs, however, food availability for jackrabbits and other small herbivores would decrease. Value for habitat would not be decreased.Hydrological functions
Soils in this site are grouped into "D" hydrologic group, as outlined in the "Soils of Colorado Loss Factors and Erodiblity Hydrologic Groupings" handbook. Field investigations are needed to determine hydrologic cover conditions and hydrologic curve numbers. Refer to "Peak Flows in Colorado" handbook, and SCS "National Engineering Handbook", Section 4, for hydrologic curve numbers and determining runoff quantities.
Recreational uses
Recreation values are limited to hunting of rabbit species and the incidental use of this site in hunting or observing waterfowl near artesian wells, and other wetland areas associated with this site.
Supporting information
Inventory data references
Counties where this ecological site occurs include: Alamosa, Conejos; Costilla. Rio Grande and Saguache Field Offices in Colorado where the site occurs: Alamosa, San Luis, and Center
References
-
. 2021 (Date accessed). USDA PLANTS Database. http://plants.usda.gov.
Other references
Chapman, S.S., G.E. Griffith, J.M. Omernik, A.B. Price, J. Freeouf, and D.L. Schrupp. 2006. Ecoregions of Colorado. (2-sided color posterwith map, descriptive text, summary tables, and photographs). U.S. Geological Survey, Reston, VA. Scale 1:1,200,000.
Cleland, D.T.; Freeouf, J.A.; Keys, J.E.; Nowacki, G.J.; Carpenter, C.A.; and McNab, W.H. 2007. Ecological Subregions: Sections andSubsections for the conterminous United States. Gen. Tech. Report WO-76D [Map on CD-ROM] (A.M. Sloan, cartographer). Washington,DC: U.S. Department of Agriculture, Forest Service, presentation scale 1:3,500,000; colored.
Natural Resources Conservation Service (NRCS). 2017. Ecological Site Description for Chico Land #264(ESIS) : USDA, Denver Colorado.
United States Department of Agriculture, Natural Resources Conservation Service. 2006. Land Resource Regions and Major Land Resource Areas of the United States, the Caribbean, and the Pacific Basin. U.S. Department of Agriculture Handbook 296.Contributors
C. Villa, H. Garcia, S. Woodall
Suzanne Mayne-KinneyApproval
Kirt Walstad, 12/11/2024
Acknowledgments
Project Staff: Suzanne Mayne-Kinney, Ecological Site Specialist, NRCS MLRA, Grand Junction SSO Alan Stuebe, MLRA Soil Survey Leader, NRCS MLRA Alamosa SSO Program Support: Rachel Murph, NRCS CO State Rangeland Management Specialist, Denver Eva Muller, Regional Director, Rocky Mountain Regional Soil Survey Office, Bozeman, MT B.J. Shoup, CO State Soil Scientist, Denver Eugene Backhaus, CO State Resource Conservationist, Denver --Site Development and Testing Plan--: Future work to validate and further refine the information in this Provisional Ecological Site Description is necessary. This will include field activities to collect low-, medium-, and high-intensity sampling, soil correlations, and analysis of that data. Additional information and data are required to refine the Plant Production and Annual Production tables for this ecological site. The extent of MLRA 51 must be further investigated. Field testing of the information contained in this Provisional ESD is required. As this ESD is moved to the Approved ESD level, reviews from the technical team, quality control, quality assurance, and peers will be conducted.
Rangeland health reference sheet
Interpreting Indicators of Rangeland Health is a qualitative assessment protocol used to determine ecosystem condition based on benchmark characteristics described in the Reference Sheet. A suite of 17 (or more) indicators are typically considered in an assessment. The ecological site(s) representative of an assessment location must be known prior to applying the protocol and must be verified based on soils and climate. Current plant community cannot be used to identify the ecological site.
Author(s)/participant(s) Contact for lead author Date 12/10/2024 Approved by Approval date Composition (Indicators 10 and 12) based on Annual Production Indicators
-
Number and extent of rills:
-
Presence of water flow patterns:
-
Number and height of erosional pedestals or terracettes:
-
Bare ground from Ecological Site Description or other studies (rock, litter, lichen, moss, plant canopy are not bare ground):
-
Number of gullies and erosion associated with gullies:
-
Extent of wind scoured, blowouts and/or depositional areas:
-
Amount of litter movement (describe size and distance expected to travel):
-
Soil surface (top few mm) resistance to erosion (stability values are averages - most sites will show a range of values):
-
Soil surface structure and SOM content (include type of structure and A-horizon color and thickness):
-
Effect of community phase composition (relative proportion of different functional groups) and spatial distribution on infiltration and runoff:
-
Presence and thickness of compaction layer (usually none; describe soil profile features which may be mistaken for compaction on this site):
-
Functional/Structural Groups (list in order of descending dominance by above-ground annual-production or live foliar cover using symbols: >>, >, = to indicate much greater than, greater than, and equal to):
Dominant:
Sub-dominant:
Other:
Additional:
-
Amount of plant mortality and decadence (include which functional groups are expected to show mortality or decadence):
-
Average percent litter cover (%) and depth ( in):
-
Expected annual annual-production (this is TOTAL above-ground annual-production, not just forage annual-production):
-
Potential invasive (including noxious) species (native and non-native). List species which BOTH characterize degraded states and have the potential to become a dominant or co-dominant species on the ecological site if their future establishment and growth is not actively controlled by management interventions. Species that become dominant for only one to several years (e.g., short-term response to drought or wildfire) are not invasive plants. Note that unlike other indicators, we are describing what is NOT expected in the reference state for the ecological site:
-
Perennial plant reproductive capability:
Print Options
Sections
Font
AAAAOther
PrintThe Ecosystem Dynamics Interpretive Tool is an information system framework developed by the USDA-ARS Jornada Experimental Range, USDA Natural Resources Conservation Service, and New Mexico State University.
Accessibility statement


