
Natural Resources
Conservation Service
-
Search


Major Land Resource Area or ecological site by name and/or ID.
PreviousSectionsNextGeneral information
Provisional. A provisional ecological site description has undergone quality control and quality assurance review. It contains a working state and transition model and enough information to identify the ecological site.
Click to explore map
Figure 1. Mapped extent
Areas shown in blue indicate the maximum mapped extent of this ecological site. Other ecological sites likely occur within the highlighted areas. It is also possible for this ecological site to occur outside of highlighted areas if detailed soil survey has not been completed or recently updated.
Associated sites
R042AE272TX Clay Flat, Mixed Prairie
R042AE273TX Draw, Mixed Prairie
R042AE694TX Loamy Slope, Mixed Prairie
Table 1. Dominant plant species
Tree Not specified
Shrub Not specified
Herbaceous Not specified
Physiographic features
This site occurs as nearly level to gently sloping intermountain concave swales on valley floors and stream terraces. Slopes range from 0 to 2 percent.
Table 2. Representative physiographic features
Landforms (1) Swale
Flooding frequency None Ponding frequency None Elevation 4500 – 5600 ft Slope 0 – 2 % Aspect Aspect is not a significant factor Climatic features
The average annual precipitation ranges from 15 to 17 inches and the annual total is highly variable from 8 to 30 inches. Most of the precipitation occurs as widely scattered thunderstorms of high intensity and short duration during the summer. Occasional precipitation occurs as light rainfall during the cool season. Annual snowfall ranges from 1-3 inches.
Mean annual air temperature is 61° F. Frost-free period ranges from 199 to 215 days (April-October). However, the optimal growing season occurs July through September as this period coincides with greater rainfall.
The average relative humidity in mid-afternoon is about 25 percent. Relative humidity is higher at night, and the average at dawn is about 57 percent. The sun shines 81 percent of the time in summer and 75 percent in winter. The prevailing wind is from the southwest. Average wind speed is highest, around 11 miles per hour, in March and April. The annual Class-A pan evaporation is approximately 82 inches.
Table 3 Representative climatic features
Frost-free period (average) 220 days Freeze-free period (average) 230 days Precipitation total (average) 20 in BarLineFigure 2. Monthly precipitation range
BarLineFigure 3. Monthly average minimum and maximum temperature
">Influencing water features
There are no wetlands or streams influencing this site.
Soil features
Soil series of the Marfa and Musquiz soils are assigned to in this ecological site. These soils developed from loamy and clayey alluvium derived from igneous and sedimentary rocks, Perdiz igneous conglomerate rocks as well as eolian material. These soils receive large amounts of run-in water.
Representative Soil map units:
Marfa clay loam, 0 to 2 percent slopes
Marfa-Berrendo complex, 1 to 5 percent slopes (Marfa component)
Musquiz clay loam, 0 to 3 percent slopes
Musquiz association, nearly level
Table 4. Representative soil features
Surface texture (1) Silt loam
(2) Clay loam
Family particle size (1) Loamy
Drainage class Well drained Permeability class Slow to moderately slow Soil depth 72 in Surface fragment cover <=3" 18 % Surface fragment cover >3" Not specified Available water capacity
(0-40in)5 – 6 in Electrical conductivity
(0-40in)Not specified Sodium adsorption ratio
(0-40in)0 – 2 Subsurface fragment volume <=3"
(Depth not specified)30 % Subsurface fragment volume >3"
(Depth not specified)4 % Ecological dynamics
This site receives moisture from surrounding areas higher in the watershed. The vegetation dynamics of the site reflect this. Because of the increased water entering the site, the site has remained somewhat resistant to degradation. Historically, it is believed the site supported a variety of herbaceous species, primarily grasses with some forbs. Determination of the Historical Climax Plant Community is based upon informed conjecture, as no relict sites have been located. Annual forbs were common on years with spring rains. Most common grass was blue grama (Bouteloua gracilis), which comprised 35 percent of the community by weight. A mixture of mixed midgrasses: vine-mesquite (Panicum obtusum), cane bluestem (Bothriochloa barbinodis), sideoats grama (Bouteloua curtipendula), bristlegrass (Setaria leucopila) comprised 42 percent of the community by weight. Other species present in smaller amounts were tobosa (Pleuraphis mutica) comprising 5 percent of the community by weight, buffalograss (Bouteloua dactyloides), curly-mesquite (Hilaria belangeri), and burro grass (Scleropogon brevifolius) comprised 5 percent of the community by weight. Sand muhly (Muhlenbergia arenicola), three-awns (Aristida species), and ear muhly Muhlenbergia arenacea) comprised 5 percent of the community by weight. Forbs would have comprised approximately five percent of the community by weight. Butterflybush (Buddleja murrubiifolia) comprised 2 percent of the community by weight. Lotebush (Ziziphus obtusifolia), wolf berry (Lycium berlandieri), western honey mesquite (Prosopis glandulosa var. torreyana), yucca (Yucca species) and cactus (mostly Opuntia species) were probably present, but in small amounts comprising 1 percent or less of the community by weight). Most growth occurs June through October. 20 percent or less of bare ground would be observed.
Grazing would have played a role in the alterations within this site. Although production on the site could remain fairly high, species composition is altered. Heavy grazing, combined with drought, results in the loss of sideoats grama, bristlegrass, cane bluestem, and vine-mesquite. The site would degrade to one dominated by blue grama. Grasses such as sand muhly, three-awns, and ear muhly would increase. Shrub vegetation would increase as well. Fire may have also played a role in the retaining of species composition as most grasses respond favorably to fire, provided soil moisture is good when burning takes place and providing ample precipitation follows burning.
As retrogression occurs, vegetative cover would decrease leaving more bare ground and providing for a patchy prairie. Species diversity is still apparent, but composition has been altered. Less than 20 percent of the community, by weight is represented by mixed grasses. 50 Percent of the community, by weight, is blue grama. The patchy aspect of this community is due to the increase bare ground, up to 40 percent exposed. Annuals, which would have opportunity for germination with precipitation, would increase, occupying the bare areas left by the removal of the bunchgrasses.
As retrogression continues, it appears one of two transformations are possible. If mixed grasses are heavily impacted, a Shortgrass Prairie is determined. This state is dominated by blue grama with low amounts of mixed grasses. Shrub percentage by weight may still be small. 20 to 60 percent bare ground may be observed. From this state, should further degradation occur, a Shortgrass Shrub Savannah is determined. The primary change in this state is the increase of shrubs, by weight, in the community to over 20 percent. In this state, several ecological processes may have been altered. Nutrient cycling has been altered due to the removal of the preferred grazing species.
From the HCPC, if mixed grasses remain a fairly large component of the community within the Patchy Prairie, shrubs may increase, filling in the bare ground areas. This leads to a Mixed-Grass Shrub Savannah. More than 20 percent of the community by weight is composed of shrubs. 20 to 60 percent of bare ground is exposed. In this state, as well, several ecological processes may have been altered. Nutrient cycling has been altered due to the reduction of the preferred grazing species. Fire behavior has been altered due to the increased bare ground. Hydrologic patterns have been altered as bare ground patches have been enlarged. Even with the resilience of the site, a reversal of these effects is difficult without accelerating practices.
State and Transition Diagram:
The following diagram suggests some pathways that the vegetation on this site might take. There may be other states not shown in the diagram. This information is intended to illustrate what might happen in a given set of circumstances. This does not mean that this process would happen the same way in every instance. Local professional guidance should be sought before pursuing any treatment scenario.
State and transition model
Custom diagramStandard diagram
Figure 4. MLRA 42 - Loamy Swale (MP) - State & Transition
More interactive model formats are also available. View Interactive Models
More interactive model formats are also available. View Interactive Models
Click on state and transition labels to scroll to the respective textEcosystem states
State 1 submodel, plant communities
State 2 submodel, plant communities
State 3 submodel, plant communities
State 4 submodel, plant communities
State 1
Mixed-grass Prairie StateCommunity 1.1
Mixed-grass Prairie Community (Intact)
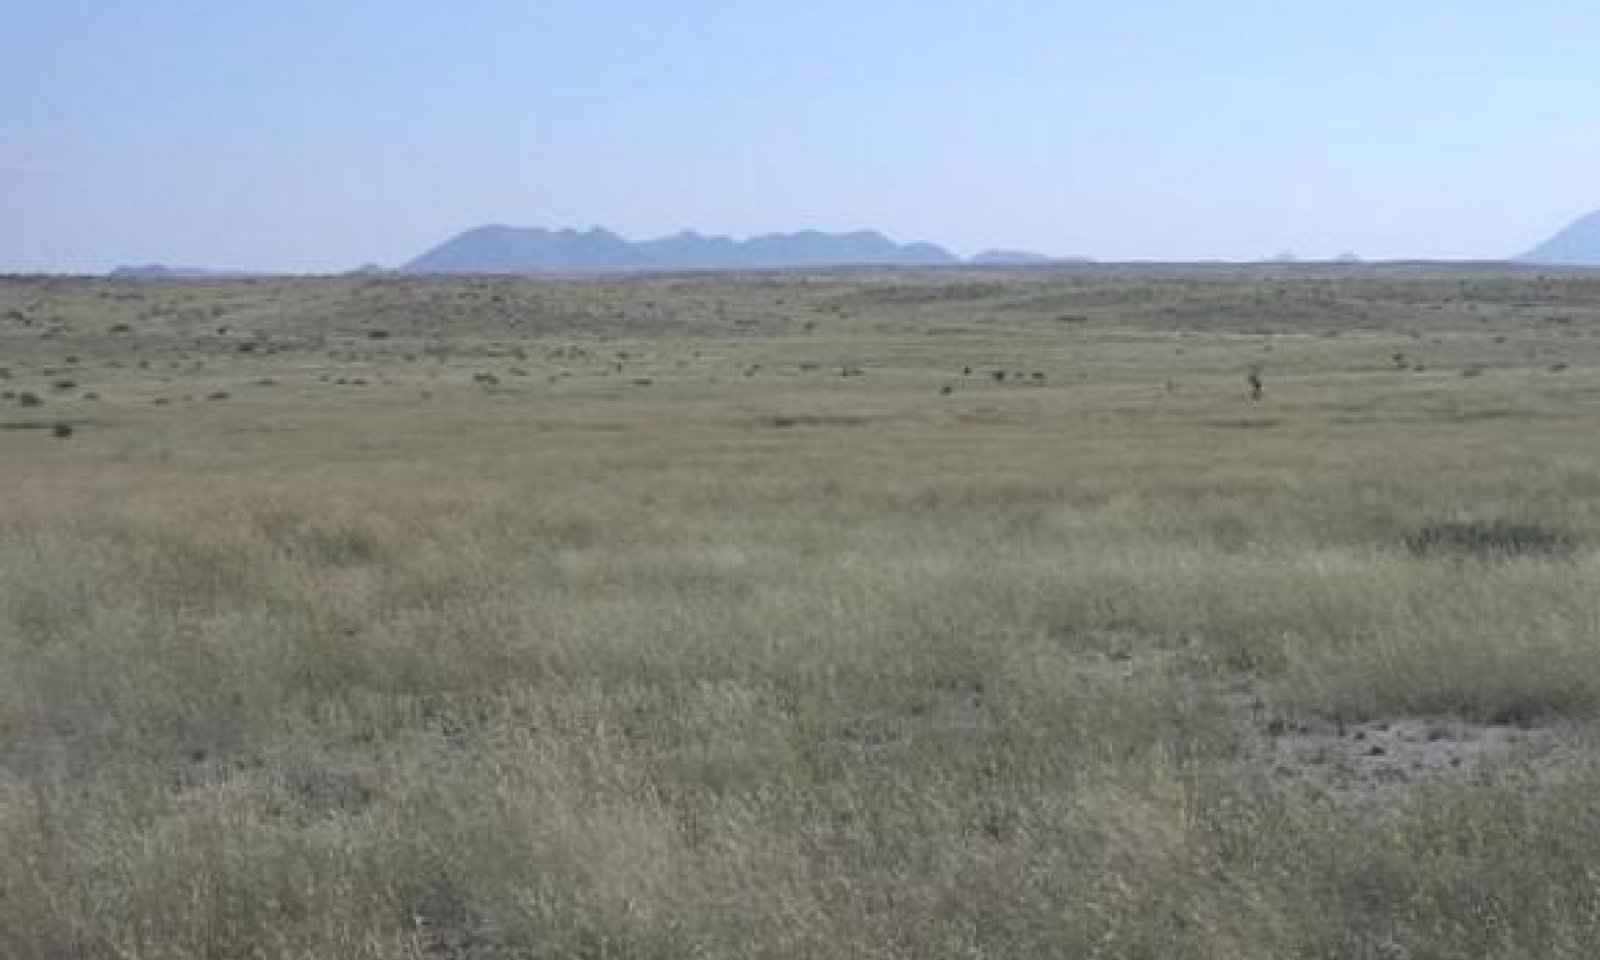
Figure 5. 1.1 Mixed-grass Prairie Community (Intact)
Undisturbed landscapes that retain vegetation patterns, pre-European settlement, have not yet been found to sample. Therefore, statements regarding the Historic Climax Plant Community (HCPC) are based on tacit knowledge, current observations, and informed conjecture, not sampled vegetation. The HCPC is dominated by mixed grasses including: blue grama, vine–mesquite, sideoats grama, cane bluestem, and bristlegrass. Other grasses are present, buffalograss, curly mesquite, and burrograss, tobosa, sand muhly, three-awns, and ear muhly. Annuals are present especially in years with early spring rains. By weight, approximately ninety-two percent of the community is comprised of grasses, approximately five percent is comprised of forbs and approximately three percent is comprised of shrub species. The occasional shrubs include butterfly bush, lotebush, yucca and cactus. Up to twenty percent of bare ground may be exposed.
Diversity is maintained by prescribed grazing, preferably with deferment and the continuation of additional water supplied by run-off onto the site because of the landscape position. The diversity of the preferred grasses such as sideoats grama, cane bluestem, and bristlegrass, as well as others, decrease with continuous heavy grazing.
Heavy grazing and/or drought can alter this from the HCPC Mixed-Grass Prairie to a Patchy Prairie.
Figure 6. Annual production by plant type (representative values) or group (midpoint values)
Table 5. Annual production by plant type
Plant type Low
(lb/acre)Representative value
(lb/acre)High
(lb/acre)Grass/Grasslike 1380 1840 2300 Forb 75 100 125 Shrub/Vine 45 60 75 Tree 0 0 0 Microbiotic Crusts 0 0 0 Total 1500 2000 2500 Figure 7. Plant community growth curve (percent production by month). TX0028 , Mixed-grass Prairie - Intact Prairie (MP). Mixed prairie rangeland of warm-season mid and shortgrasses and forbs..
Jan Feb Mar Apr May Jun Jul Aug Sep Oct Nov Dec J F M A M J J A S O N D 0 0 0 5 5 15 20 25 20 10 0 0 Community 1.2
Mixed-grass Prairie - Patchy Community
Figure 8. 1.2 Mixed-grass Prairie - Patchy Community
This plant community maintains, by weight, approximately twenty percent mixed grasses and fifty percent blue grama. Other grasses, buffalograss, curly mesquite, and burrograss, tobosa, sand muhly, three-awns, and ear muhly round out the remaining twenty-two percent by weight of grasses in the community. Forbs comprise five percent of the community, while shrubs provide approximately three percent of the biomass yet. Bare ground has increased however to twenty to forty percent. The increase in bare ground is largely the reason for determining this community. Modifying grazing practices at this point in succession to prescribed grazing, however allows this community to return to intact prairie conditions. In this plant community, there is usually a sufficient seed source and old rootstocks of the mixed grasses remaining to allow for this return.
Figure 9. Annual production by plant type (representative values) or group (midpoint values)
Table 6. Annual production by plant type
Plant type Low
(lb/acre)Representative value
(lb/acre)High
(lb/acre)Grass/Grasslike 1104 1299 1495 Forb 60 71 81 Shrub/Vine 36 42 49 Tree 0 0 0 Microbiotic Crusts 0 0 0 Total 1200 1412 1625 Table 7. Ground cover
Tree foliar cover 0% Shrub/vine/liana foliar cover 0-0% Grass/grasslike foliar cover 60-80% Forb foliar cover 10-10% Non-vascular plants 0% Biological crusts 0% Litter 50-60% Surface fragments >0.25" and <=3" 0% Surface fragments >3" 0% Bedrock 0% Water 0% Bare ground 20-40% Table 8. Canopy structure (% cover)
Height Above Ground (ft) Tree Shrub/Vine Grass/
GrasslikeForb <0.5 – – – 0-5% >0.5 <= 1 – – 25-50% – >1 <= 2 – 0-2% – – >2 <= 4.5 – 0-1% – – >4.5 <= 13 – – – – >13 <= 40 – – – – >40 <= 80 – – – – >80 <= 120 – – – – >120 – – – – Figure 10. Plant community growth curve (percent production by month). TX0029 , Mixed-grass Prairie - Patchy Prairie (MP). Mixed prairie rangeland consisting of mid and shortgrasses and forbs..
Jan Feb Mar Apr May Jun Jul Aug Sep Oct Nov Dec J F M A M J J A S O N D 0 0 0 5 5 15 20 25 20 10 0 0 Pathway 1.1A
Community 1.1 to 1.2
Mixed-grass Prairie Community (Intact)
Mixed-grass Prairie - Patchy CommunityHeavy Continuous Grazing and Droughts shift the Intact Mixed-grass Prairie Community to the Patchy Mixed-grass Prairie Community.
Pathway 1.2A
Community 1.2 to 1.1
Mixed-grass Prairie - Patchy Community
Mixed-grass Prairie Community (Intact)Prescribed Grazing and timely rainfall events can restore the patchy prairie community to the intact prairie community.
Conservation practices
Prescribed Grazing State 2
Shortgrass Prairie StateCommunity 2.1
Shortgrass Prairie Community
Figure 11. 2.1 Shortgrass Prairie Community
This plant community is largely the result of heavy continuous grazing combined with drought. Grass diversity has been reduced. This plant community maintains, by weight, approximately ten percent mixed grasses and sixty-five percent blue grama. Other grasses, buffalograss, curly-mesquite, burrograss, tobosa, sand muhly, three-awns, and ear muhly and annual grasses round out the remaining seventeen percent, by weight, of grasses in the community. Forbs comprise five percent of the community, while shrubs still provide approximately three percent of the biomass. Bare ground has increased however to twenty to sixty percent. Forage quality has been reduced, as well as forage quantity. Wildlife habitat values have been lessened. Due to the dominance of shorter grass species such blue grama, cover for various wildlife species such as birds and mammals is decreased.
Due to diversity loss and bare ground increase, accelerating practices will need to be employed to return this state to the HCPC. Grazing Land Mechanical Treatment may be necessary in bare areas, combined with seeding. Rest from grazing, followed by prescribed grazing would also be necessary to assure restoration is successful.
Continuous heavy grazing, if continued, combined with drought, will lead to further loss of grass dominance. If a seed source is present for invasive shrub species, this state will deteriorate further to a Shortgrass Shrub Savannah.
Figure 12. Annual production by plant type (representative values) or group (midpoint values)
Table 9. Annual production by plant type
Plant type Low
(lb/acre)Representative value
(lb/acre)High
(lb/acre)Grass/Grasslike 828 1219 1610 Forb 45 66 88 Shrub/Vine 27 40 52 Tree 0 0 0 Microbiotic Crusts 0 0 0 Total 900 1325 1750 Table 10. Ground cover
Tree foliar cover 0% Shrub/vine/liana foliar cover 0-0% Grass/grasslike foliar cover 10-80% Forb foliar cover 10-10% Non-vascular plants 0% Biological crusts 0% Litter 20-70% Surface fragments >0.25" and <=3" 0% Surface fragments >3" 0% Bedrock 0% Water 0% Bare ground 20-60% Table 11. Canopy structure (% cover)
Height Above Ground (ft) Tree Shrub/Vine Grass/
GrasslikeForb <0.5 – – – 5-10% >0.5 <= 1 – – 10-65% – >1 <= 2 – 0-2% 0-10% – >2 <= 4.5 – 0-1% – – >4.5 <= 13 – – – – >13 <= 40 – – – – >40 <= 80 – – – – >80 <= 120 – – – – >120 – – – – Figure 13. Plant community growth curve (percent production by month). TX0023 , Mid/Shortgrass/Shrubs Community - Mixed Prairie. Prairie with cool and warm-season mid and shortgrasses with scattered shrubs and trees..
Jan Feb Mar Apr May Jun Jul Aug Sep Oct Nov Dec J F M A M J J A S O N D 2 2 2 2 3 8 8 18 23 15 15 2 State 3
Shortgrass Shrub Savannah StateCommunity 3.1
Shortgrass-Shrub Savannah Community
Figure 14. 3.1 Shortgrass-Shrub Savannah Community
This plant community is largely the result of heavy continuous grazing combined with drought and the introduction of shrub seed to the community. Grass dominance has been reduced. This plant community is comprised of, by weight, less than 10 percent mixed grasses and less than 55 percent blue grama. Other grasses, such as burrograss, curly-mesquite, buffalograss, tobosa, sand muhly, three-awns, ear muhly and annual grasses complete the remaining 19 percent, by weight, of the grass community. Forbs comprise 5 percent of the community, while shrubs now comprise greater than twenty percent of the biomass. Bare ground is now present at ten to sixty percent cover levels.
Accelerating practices will need to be employed to return this state to the HCPC. Grazing Land Mechanical Treatment as well as brush management may be necessary, combined with seeding. Brush management could be in the form of mechanical treatment, chemical treatment, or prescribed burning. Rest from grazing, followed by prescribed grazing would also be necessary to assure restoration is successful.
Figure 15. Annual production by plant type (representative values) or group (midpoint values)
Table 12. Annual production by plant type
Plant type Low
(lb/acre)Representative value
(lb/acre)High
(lb/acre)Grass/Grasslike 666 980 1294 Shrub/Vine 189 279 368 Forb 45 66 88 Tree 0 0 0 Microbiotic Crusts 0 0 0 Total 900 1325 1750 Table 13. Ground cover
Tree foliar cover 0% Shrub/vine/liana foliar cover 0-20% Grass/grasslike foliar cover 10-60% Forb foliar cover 10-10% Non-vascular plants 0% Biological crusts 0% Litter 0% Surface fragments >0.25" and <=3" 0% Surface fragments >3" 0% Bedrock 0% Water 0% Bare ground 10-60% Table 14. Canopy structure (% cover)
Height Above Ground (ft) Tree Shrub/Vine Grass/
GrasslikeForb <0.5 – – – 5-10% >0.5 <= 1 – – 10-60% – >1 <= 2 – 0-5% 0-10% – >2 <= 4.5 – 0-10% – – >4.5 <= 13 – 0-5% – – >13 <= 40 – – – – >40 <= 80 – – – – >80 <= 120 – – – – >120 – – – – Figure 16. Plant community growth curve (percent production by month). TX0023 , Mid/Shortgrass/Shrubs Community - Mixed Prairie. Prairie with cool and warm-season mid and shortgrasses with scattered shrubs and trees..
Jan Feb Mar Apr May Jun Jul Aug Sep Oct Nov Dec J F M A M J J A S O N D 2 2 2 2 3 8 8 18 23 15 15 2 State 4
Mixed-grass Shrub Savannah StateCommunity 4.1
Mixed-Grass Shrub Savannah Community
Figure 17. 4.1 Mixed-Grass Shrub Savannah Community
This community has maintained diversity of mid-grasses, but shrub encroachment is apparent. Blue grama has decreased. This plant community is largely the result of heavy continuous grazing combined with drought, a reduction in fire frequency and the introduction of shrub seed to the community. Grass dominance has been reduced. This plant community is comprised of, by weight, less than thirty-five percent mixed grasses and less than twenty percent blue grama. Other grasses, such as burrograss, curly mesquite, buffalograss, tobosa, sand muhly, three-awns, ear muhly annual grasses complete the remaining 19 percent, by weight, of the grass community. Forbs comprise five percent of the community, while shrubs now comprise greater than twenty percent of the biomass. Bare ground is now present at twenty to sixty percent cover levels.
Accelerating practices will need to be employed to return this state to the HCPC. Grazing Land Mechanical Treatment as well as brush management may be necessary, combined with seeding. Brush management could be in the form of mechanical treatment, chemical treatment, or prescribed burning. Rest from grazing, followed by prescribed grazing would also be necessary to assure restoration is successful.
Figure 18. Annual production by plant type (representative values) or group (midpoint values)
Table 15. Annual production by plant type
Plant type Low
(lb/acre)Representative value
(lb/acre)High
(lb/acre)Grass/Grasslike 864 1152 1440 Shrub/Vine 276 368 460 Forb 60 80 100 Tree 0 0 0 Microbiotic Crusts 0 0 0 Total 1200 1600 2000 Table 16. Ground cover
Tree foliar cover 0% Shrub/vine/liana foliar cover 0-20% Grass/grasslike foliar cover 20-30% Forb foliar cover 10-10% Non-vascular plants 0% Biological crusts 0% Litter 0% Surface fragments >0.25" and <=3" 0% Surface fragments >3" 0% Bedrock 0% Water 0% Bare ground 20-60% Table 17. Canopy structure (% cover)
Height Above Ground (ft) Tree Shrub/Vine Grass/
GrasslikeForb <0.5 – – – 5-10% >0.5 <= 1 – – 10-65% – >1 <= 2 – 0-5% 0-10% – >2 <= 4.5 – 0-10% – – >4.5 <= 13 – 0-5% – – >13 <= 40 – – – – >40 <= 80 – – – – >80 <= 120 – – – – >120 – – – – Figure 19. Plant community growth curve (percent production by month). TX0023 , Mid/Shortgrass/Shrubs Community - Mixed Prairie. Prairie with cool and warm-season mid and shortgrasses with scattered shrubs and trees..
Jan Feb Mar Apr May Jun Jul Aug Sep Oct Nov Dec J F M A M J J A S O N D 2 2 2 2 3 8 8 18 23 15 15 2 Transition T1A
State 1 to 2Heavy Continuous Grazing and Drought transitions to Shortgrass Prairie State.
Transition T1B
State 1 to 4With heavy continuous grazing, droughts, no fire, and invader species, the Mixed-grass Prairie State converts to Mixed-grass-Shrub Savannah State.
Restoration pathway R2A
State 2 to 1Grazing Lands Mechanical Treatment, Range Planting, and Prescribed Grazing can assist in the restoration of the Mixed-grass Prairie State.
Conservation practices
Prescribed Grazing Grazing Land Mechanical Treatment Range Planting Transition T2A
State 2 to 3Heavy Continuous Grazing and Droughts would convert the Shortgrass Prairie State to the Shortgrass Shrub Savannah State.
Restoration pathway R3B
State 3 to 1Brush Management, Grazing Lands Mechanical Treatment, Range Planting and Prescribed Grazing can restore the Shortgrass Shrub Savannah State to the Mixed-grass Prairie State.
Conservation practices
Brush Management Prescribed Grazing Grazing Land Mechanical Treatment Range Planting Restoration pathway R3A
State 3 to 2Brush Management, Grazing Lands Mechanical Treatment, Range Planting, and Prescribed Grazing can shift the Shortgrass/Shrub Savannah State to the Shortgrass Prairie State.
Conservation practices
Brush Management Prescribed Grazing Grazing Land Mechanical Treatment Range Planting Restoration pathway R4A
State 4 to 1Brush Management, Grazing Lands Mechanical Treatment, Range Planting, and Prescribed Grazing can shift the Mixed-grass Shrub Savannah State to the Mixed-grass Prairie State.
Conservation practices
Brush Management Prescribed Grazing Grazing Land Mechanical Treatment Range Planting Additional community tables
Table 18. Community 1.1 plant community composition
Group Common name Symbol Scientific name Annual production () Foliar cover (%) Grass/Grasslike1 Shortgrass 525–875 blue grama BOGR2 Bouteloua gracilis 525–875 – 2 Midgrasses 630–1050 cane bluestem BOBA3 Bothriochloa barbinodis 100–500 – sideoats grama BOCU Bouteloua curtipendula 100–500 – vine mesquite PAOB Panicum obtusum 100–500 – streambed bristlegrass SELE6 Setaria leucopila 100–500 – 3 Shortgrass 75–125 tobosagrass PLMU3 Pleuraphis mutica 75–125 – 4 Shortgrasses 75–125 buffalograss BODA2 Bouteloua dactyloides 25–75 – curly-mesquite HIBE Hilaria belangeri 25–75 – burrograss SCBR2 Scleropogon brevifolius 25–50 – 5 Shortgrasses 75–125 threeawn ARIST Aristida 25–50 – ear muhly MUAR Muhlenbergia arenacea 25–50 – sand muhly MUAR2 Muhlenbergia arenicola 25–50 – Forb6 Forb 15–25 croton CROTO Croton 15–25 – 7 Forbs 60–100 pigweed AMARA Amaranthus 20–40 – prairie broomweed AMDR Amphiachyris dracunculoides 20–40 – white sagebrush ARLUM2 Artemisia ludoviciana ssp. mexicana 20–40 – woolly locoweed ASMOM5 Astragalus mollissimus var. mollissimus 20–40 – thistle CIRSI Cirsium 20–40 – Cooley's bundleflower DECO2 Desmanthus cooleyi 20–40 – polkadots DYLI Dyschoriste linearis 20–40 – Wright's eryngo ERHE3 Eryngium heterophyllum 20–40 – buckwheat ERIOG Eriogonum 20–40 – spurge EUPHO Euphorbia 20–40 – dwarf morning-glory EVOLV Evolvulus 20–40 – beeblossom GAURA Gaura 20–40 – Davis Mountain mock vervain GLBIC Glandularia bipinnatifida var. ciliata 20–40 – rushpea HOFFM Hoffmannseggia 20–40 – bitter rubberweed HYOD Hymenoxys odorata 20–40 – hairy caltrop KAHI Kallstroemia hirsutissima 20–40 – bladderpod LESQU Lesquerella 20–40 – lacy tansyaster MAPI Machaeranthera pinnatifida 20–40 – purslane PORTU Portulaca 20–40 – silverleaf nightshade SOEL Solanum elaeagnifolium 20–40 – globemallow SPHAE Sphaeralcea 20–40 – fameflower TALIN2 Talinum 20–40 – fiveneedle pricklyleaf THPEP Thymophylla pentachaeta var. pentachaeta 20–40 – desert zinnia ZIAC Zinnia acerosa 20–40 – Shrub/Vine8 Shrub 30–50 woolly butterflybush BUMA Buddleja marrubiifolia 30–50 – 9 Shrubs 0–5 Berlandier's wolfberry LYBE Lycium berlandieri 0–5 – western honey mesquite PRGLT Prosopis glandulosa var. torreyana 0–5 – lotebush ZIOB Ziziphus obtusifolia 0–5 – 10 Shrub 15–25 pricklypear OPUNT Opuntia 15–25 – Table 19. Community 1.2 plant community composition
Group Common name Symbol Scientific name Annual production () Foliar cover (%) Table 20. Community 2.1 plant community composition
Group Common name Symbol Scientific name Annual production () Foliar cover (%) Table 21. Community 3.1 plant community composition
Group Common name Symbol Scientific name Annual production () Foliar cover (%) Table 22. Community 4.1 plant community composition
Group Common name Symbol Scientific name Annual production () Foliar cover (%) Interpretations
Animal community
This site was historically used in the production of domestic livestock and to provide habitat for native wildlife. Small mammals, such as rodents and rabbits utilize the area. Some deer and ground squirrels utilize this site. Larger mammals such as coyotes and fox can frequent the area, as they are dependent upon these rodents. Pronghorn antelope utilize the area heavily for both a food source and hiding cover for fawns.
Reptiles may frequent the area. The edge effect of grasslands provides good hunting areas for insects. The Trans-Pecos region is important to many migratory bird species. The seeds of some grasses and forbs are an important component to the diets of some birds. Grasses and shrubs also provide protective cover for nesting and young birds.
Plant Preferences by Animal Kind:
This rating system provides general guidance as to animal preferences for plant species. It also reveals possible competition between kinds of herbivores for various plants. Grazing preference changes from time to time, especially between seasons, and between animal kinds and classes. Grazing preference does not reflect the ecological status of the plant within the plant community. In order to discuss the value of plant species to particular animals, five plant preference classifications have been determined. Additionally, various parts of plants are discussed.
Preferred Plant - P - Composition of a plant species is greater in the diet of the target animal than found in the area being grazed by this animal.
Desirable Plant - D - Composition of plant species is approximately the same in the diet of the target animal as that found in the area being grazed by this animal.
Undesirable Plant - U - Composition of plant species is lower in the diet of the target animal than is found in the area being grazed by this animal.
Toxic Plant - T - Rare occurrence in the diet of the target animal and, if consumed in any tangible amounts, will result in death or severe illness in the animal.
Non-consumed Plant - N - Plant species that would not be eaten under normal extremes in forage conditions, but if no other forage is available, the target animal will attempt consumption although at greatly reduced rates.
Not documented – X – Plant species utilized, but the degree of utilization unknown.
Hydrological functions
This site lies in a water receiving position. When properly managed it captures and safely retains water. The soils, which comprise this site are well drained with slow to moderately slow permeability. Runoff is negligible on slopes less than one percent, and very low on slopes one to three percent. Providing the vegetation resource is managed properly, water and wind erosion potential is low. When vegetation is removed, these soils can also become crusted, thereby reducing the infiltration. Rill and gully erosion can occur, especially due to the extra water the site receives. Once started this type of erosion is difficult to treat and return to a productive stable environment
These soils are high in organic matter and therefore have the potential to be very productive. These sites can benefit from water spreading for increased native grass range management or pasture and hay production.
Recreational uses
Hunting, hiking, horseback riding and bird watching are the most feasible recreation uses. In some instances, off-road vehicle users like to use the site for trails and courses, but this use can destroy vegetation cover leading to increased bare ground and increased erosion. This site when managed well is aesthetically pleasing to those enjoy who enjoy wide open places and traditional western prairie views.
Wood products
No merchantable wood products are available.
Other products
When managed properly this site provides forage for livestock and wildlife. The site can also provide cover for wildlife. Rangelands are an important ecosystem in the global carbon cycle. Well managed rangelands sequester more carbon than those that have deteriorated.
Other information
None.
Supporting information
Inventory data references
Two annual production transect was established within the Marfa and Musquiz Soil series, in Presidio County, in September and December 2002. The transects represent a Shortgrass Prairie community. A transect reflecting historical, pre-European settlement conditions has not yet been established. Transect location was recorded using the GPS. Transect includes the collection of various types of vegetation information: Herbaceous production from ten 1.92 or ten 9.6 square foot plots Shrub production from three 0.01 acre plots Line point intercept cover data Canopy and basal gap data Transect data and canopy cover class data is stored in the rangeland management files at the Presidio County Soil Survey office in Marfa, Texas. Additionally some historical references were also reviewed. This site has been correlated between sites in Brewster, Jeff Davis, and Presidio Counties.
Other references
Reviewers and Contributors:
NRCS: George Peacock, Homer Sanchez, Charles Anderson, Lynn Loomis, Wayne Seipp, Arlene Tugel, Steve Nelle, Sonny Vela, Jerry Rives, Dave Trujillo, Justin Clary, Clay Lindley, Rusty Dowell, and Steve Zuberbuler
ARS: Brandon Bestlemeyer
Texas GLO: Paul Loeffler
Texas Parks and Wildlife: John Holland and Mike Sullins
Sul Ross State University: Rob Kinucan and Bonnie Warnock
The Nature Conservancy: John Karges
Chihuahuan Desert Research Institute: Cathy Hoyt
Producer: Albert Miller
Technical Editors:
Homer Sanchez, State Range Conservationist, NRCS, Temple, Texas
Charles Anderson, Range Conservationist, NRCS, San Angelo, Texas
George Peacock, Rangeland Management Specialist, NRCS, Pecos, Texas
Mark Moseley, RMS, NRCS, Boerne, Texas
Michael Margo, RMS, NRCS, Marfa, Texas
Other References:
Griffith, Randy Scott. 1991. Panicum obtusum. In: U.S. Department of Agriculture, Forest Service, Rocky Mountain Research Station, Fire Sciences Laboratory (2003, June). Fire Effects Information System, [Online]. Available: http://www.fs.fed.us/database/feis/ [6/17/03].
National Water and Climate Center, and Natural Resources Conservation Service, United States Department of Agriculture. TAPS Climate Data, Available URL: http://www.wcc.nrcs.usda.gov [Accessed June 20, 2003]
Powell, A.M. 1998. Trees and Shrubs of the Trans-Pecos and Adjacent Areas. University of Texas Press. Austin, TX.
Powell, A.M. 2000. Grasses of the Trans-Pecos and Adjacent Areas. Iron Mountain Press. Marathon, TX
Soil Survey Division, Natural Resources Conservation Service, United States Department of Agriculture. Official Soil Series Descriptions [Online WWW]. Available URL: " http://ortho.ftw.nrcs.usda.gov/osd/" [Accessed June 20, 2003]
U.S. Department of Agriculture. Natural Resources Conservation Service. National Soil Information System (NASIS) Release 5.1 [DATABASE]. Fort Collins, Colorado, June 2003
Uchytil, Ronald. 1988. Pleuraphis mutica. In: U.S. Department of Agriculture, Forest Service, Rocky Mountain Research Station, Fire Sciences Laboratory (2003, June). Fire Effects Information System, [Online]. Available: http://www.fs.fed.us/database/feis/ [6/17/03].
USDA, NRCS. 2002. The PLANTS Database, Version 3.5 (http://plants.usda.gov). National Plant Data Center, Baton Rouge, LA 70874-4490 USA.
Warnock, B.H. 1977. Wildflowers of the Davis Mountains and the Marathon Basin, Texas. Sul Ross State University. Alpine, TX
NRCS 417 Clipping Data
Soil Survey Reports of Counties in the MLRA 42, NRCS Field Office Technical Guide, Section II E Range Sites
Contributors
Judith Dyess, RMS, NRCS, Marfa, Texas
Michael Margo, RMS, NRCS, Marfa, TexasRangeland health reference sheet
Interpreting Indicators of Rangeland Health is a qualitative assessment protocol used to determine ecosystem condition based on benchmark characteristics described in the Reference Sheet. A suite of 17 (or more) indicators are typically considered in an assessment. The ecological site(s) representative of an assessment location must be known prior to applying the protocol and must be verified based on soils and climate. Current plant community cannot be used to identify the ecological site.
Author(s)/participant(s) Contact for lead author Date Approved by Approval date Composition (Indicators 10 and 12) based on Annual Production Indicators
-
Number and extent of rills:
-
Presence of water flow patterns:
-
Number and height of erosional pedestals or terracettes:
-
Bare ground from Ecological Site Description or other studies (rock, litter, lichen, moss, plant canopy are not bare ground):
-
Number of gullies and erosion associated with gullies:
-
Extent of wind scoured, blowouts and/or depositional areas:
-
Amount of litter movement (describe size and distance expected to travel):
-
Soil surface (top few mm) resistance to erosion (stability values are averages - most sites will show a range of values):
-
Soil surface structure and SOM content (include type of structure and A-horizon color and thickness):
-
Effect of community phase composition (relative proportion of different functional groups) and spatial distribution on infiltration and runoff:
-
Presence and thickness of compaction layer (usually none; describe soil profile features which may be mistaken for compaction on this site):
-
Functional/Structural Groups (list in order of descending dominance by above-ground annual-production or live foliar cover using symbols: >>, >, = to indicate much greater than, greater than, and equal to):
Dominant:
Sub-dominant:
Other:
Additional:
-
Amount of plant mortality and decadence (include which functional groups are expected to show mortality or decadence):
-
Average percent litter cover (%) and depth ( in):
-
Expected annual annual-production (this is TOTAL above-ground annual-production, not just forage annual-production):
-
Potential invasive (including noxious) species (native and non-native). List species which BOTH characterize degraded states and have the potential to become a dominant or co-dominant species on the ecological site if their future establishment and growth is not actively controlled by management interventions. Species that become dominant for only one to several years (e.g., short-term response to drought or wildfire) are not invasive plants. Note that unlike other indicators, we are describing what is NOT expected in the reference state for the ecological site:
-
Perennial plant reproductive capability:
Print Options
Sections
Font
AAAAOther
PrintThe Ecosystem Dynamics Interpretive Tool is an information system framework developed by the USDA-ARS Jornada Experimental Range, USDA Natural Resources Conservation Service, and New Mexico State University.
Accessibility statement


