
Natural Resources
Conservation Service
Ecological site R042AE277TX
Igneous Hill and Mountain,
Mixed Prairie
Accessed: 08/30/2026
-
Search


Major Land Resource Area or ecological site by name and/or ID.
PreviousSectionsNextGeneral information
Provisional. A provisional ecological site description has undergone quality control and quality assurance review. It contains a working state and transition model and enough information to identify the ecological site.
Click to explore map
Figure 1. Mapped extent
Areas shown in blue indicate the maximum mapped extent of this ecological site. Other ecological sites likely occur within the highlighted areas. It is also possible for this ecological site to occur outside of highlighted areas if detailed soil survey has not been completed or recently updated.
Associated sites
R042AE275TX Gravelly, Mixed Prairie
This site is occurs downslope on lower piedmont slopes.
Similar sites
R042AF286TX Igneous Hill and Mountain, Mountain Savannah
This site occurs in higher elevations on igneous soils but differs in dominant species composition and production.
R042AE695TX Basalt Hill, Mixed Prairie
The site occurs on basalt rather than rhyolite/trachyte. This site is less productive.
Table 1. Dominant plant species
Tree Not specified
Shrub Not specified
Herbaceous Not specified
Physiographic features
The site occurs on mostly steep igneous hills and mountains. Slopes range from 5 to 45 percent, but are mostly 20-40 percent. Rock outcrops are common. Aspect influences vegetation composition and production. Runoff is medium on 5 to 20 percent slopes, and high on slopes greater than 20 percent.
Table 2. Representative physiographic features
Landforms (1) Mountain
(2) Hill
Flooding frequency None Ponding frequency None Elevation 4500 – 6500 ft Slope 5 – 45 % Aspect N, S Climatic features
The average annual precipitation ranges from 15 to 17 inches and the annual total is highly variable from 8 to 30 inches. Most of the precipitation occurs as widely scattered thunderstorms of high intensity and short duration during the summer. Occasional precipitation occurs as light rainfall during the cool season. Annual snowfall ranges from 1-3 inches.
Mean annual air temperature is 61° F. Frost-free period ranges from 199 to 215 days (April-October). However, the optimal growing season occurs July through September as this period coincides with greater rainfall.
The average relative humidity in mid-afternoon is about 25 percent. Relative humidity is higher at night, and the average at dawn is about 57 percent. The sun shines 81 percent of the time in summer and 75 percent in winter. The prevailing wind is from the southwest. Average wind speed is highest, around 11 miles per hour, in March and April. The annual Class-A pan evaporation is approximately 82 inches.
Table 3 Representative climatic features
Frost-free period (average) 220 days Freeze-free period (average) 230 days Precipitation total (average) 20 in BarLineFigure 2. Monthly precipitation range
BarLineFigure 3. Monthly average minimum and maximum temperature
">Influencing water features
Soil features
The site consists of very shallow to shallow, well drained, noncalcareous, gravelly to cobbly soils with a loamy surface texture. The soils formed in residuum weathered from igneous bedrock. Depth to bedrock ranges from 4-20 inches. Available water holding capacity is low. The representative soils and their associated map units are:
Big Bend National Park Soil Survey:
Rock outcrop-Brewster complex, 20 to 60 percent slopes. (Brewster component only)
Brewster County Main Part Soil Survey:
Brewster very gravelly loam, 5 to 10 percent slopes.
Brewster-Rock outcrop complex, 20 to 45 percent slopes. (Brewster component only)
Brewster-Rock outcrop complex, 20 to 70 percent slopes. (Brewster component only)
Mainstay-Brewster complex, 10 to 30 percent slopes. (Brewster component only)
Jeff Davis County Soil Survey:
Brewster-Rock outcrop association, steep. (Brewster component only)
Mainstay-Brewster association, hilly. (Brewster component only)
Rock outcrop-Brewster association, steep. (Brewster component only)
Presidio County Soil Survey:
Brewster very gravelly loam, 5 to 10 percent slopes.
Brewster-Rock outcrop complex, 10 to 30 percent slopes. (Brewster component only)
Brewster-Rock outcrop complex, 20 to 45 percent slopes. (Brewster component only)
Brewster-Rock outcrop complex, 20 to 70 percent slopes. (Brewster component only)
Table 4. Representative soil features
Parent material (1) Residuum – trachyte
Surface texture (1) Gravelly loam
(2) Very cobbly loam
(3) Stony loam
Drainage class Well drained Permeability class Very slow Soil depth 4 – 20 in Surface fragment cover <=3" 20 – 50 % Surface fragment cover >3" 20 – 45 % Available water capacity
(0-40in)1 in Calcium carbonate equivalent
(0-40in)0 – 5 % Electrical conductivity
(0-40in)Not specified Sodium adsorption ratio
(0-40in)Not specified Soil reaction (1:1 water)
(0-40in)6.1 – 7.8 Subsurface fragment volume <=3"
(Depth not specified)25 – 40 % Subsurface fragment volume >3"
(Depth not specified)8 – 30 % Ecological dynamics
The distribution of vegetation within the site is highly dependent on local environment. Elevation, soil moisture, aspect, slope, latitude, variability of the soils, and amount of rock outcrop are the major factors driving species composition and distribution. The Historic Climax Plant Community (HCPC) for the site is composed primarily of a diversity of short and midgrasses, numerous perennial forbs, and a few trees and shrubs.
Historically, the site has evolved with native herbivores such as mule deer, desert bighorn sheep, and pronghorn antelope (on low relief areas). Bison were not documented in the historical record as being present in any significant amount. A lack of water and steep topography was probably a contributing factor. Small lightning induced fires were mostly likely common mainly because of the adequate amount of fine fuels present.
Early records suggest cattle, sheep, and horses were introduced into the southwest from Mexico in the mid-1500's. However, extensive ranching began in the Trans-Pecos region in the 1880s. Direct fire suppression and overgrazing in some areas most likely began during this time.
The impact of improper grazing within this site specifically will lead to a reduction of palatable grasses and forbs and an increase of woody plants such as juniper and catclaw mimosa. In addition, direct fire suppression will also allow for woody plants to increase.
The following diagram suggests general pathways that the vegetation on this site might follow. There are other plant communities and states not shown on the diagram. This information is intended to show what might happen in a given set of circumstances; it does not mean that this would happen the same way in every instance. Local professional guidance should always be sought before pursuing a treatment scenario.
State and transition model
Custom diagramStandard diagram
Figure 4. MLRA 42 - Mixed Prairie - Igneous Hill & Mtn - STM
More interactive model formats are also available. View Interactive Models
More interactive model formats are also available. View Interactive Models
Click on state and transition labels to scroll to the respective textEcosystem states
State 1 submodel, plant communities
State 2 submodel, plant communities
State 1
Prairie StateCommunity 1.1
Short/Midgrasses/Shrubs Community
Figure 5. 1.1 Short/Midgrasses/Shrubs Community
The distribution of vegetation within the site is highly dependent on local environment. Elevation, soil moisture, aspect, slope, latitude, variability of the soils, and amount of rock outcrop are the major factors driving species composition and distribution. The Historic Climax Plant Community (HCPC) for the site is composed primarily of a diversity of short and midgrasses, numerous perennial forbs, and a few trees and shrubs and is the reference plant community.
Areas lacking significant rock outcrops are predominately a grassland plant community with very few woody plants (mostly isolated shrubs). Areas with significant rock outcrops generally support more woody plants such as oaks, junipers, and a higher diversity of shrubs and forbs. Cooler, north facing slopes will generally support more oaks and junipers than south facing slopes.
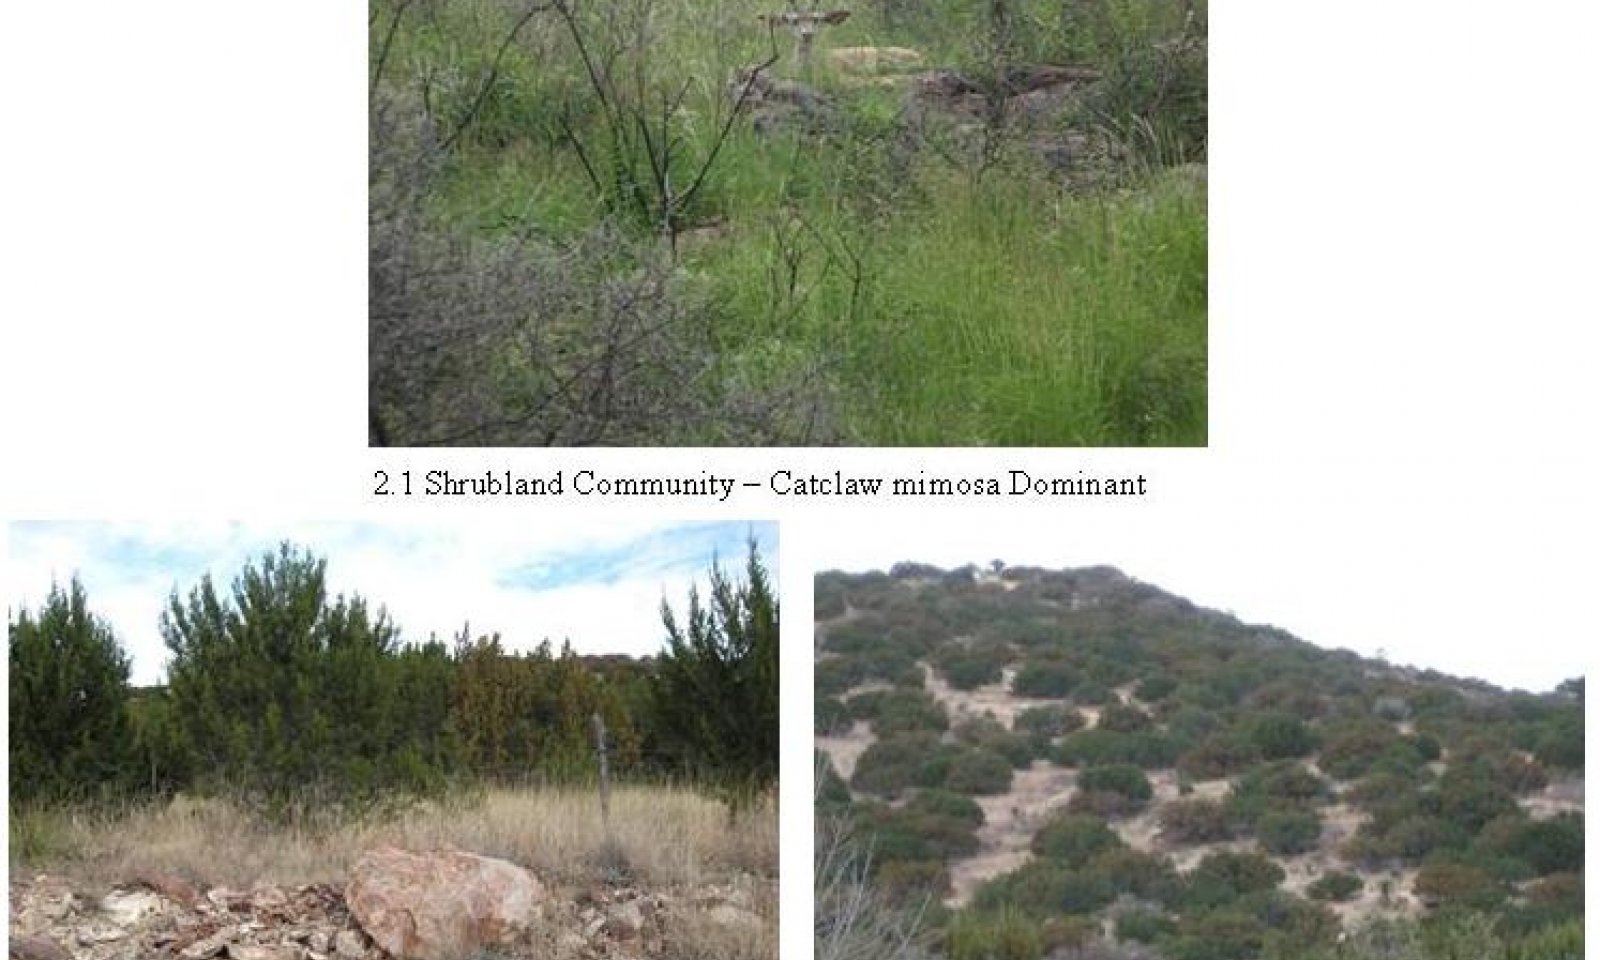
Retrogression resulting from livestock overgrazing will result in a reduction of palatable grasses and ultimately litter accumulation. This will reduce the likelihood of natural fires because of the reduction of fine fuels. Direct fire suppression will also continue to allow woody plants such as catclaw mimosa and juniper to increase. The plant communities will eventually transition to a juniper woodland or a catclaw shrubland.
Figure 6. Annual production by plant type (representative values) or group (midpoint values)
Table 5. Annual production by plant type
Plant type Low
(lb/acre)Representative value
(lb/acre)High
(lb/acre)Grass/Grasslike 560 880 1120 Shrub/Vine 56 88 112 Tree 49 77 98 Forb 35 55 70 Total 700 1100 1400 Figure 7. Plant community growth curve (percent production by month). TX0023 , Mid/Shortgrass/Shrubs Community - Mixed Prairie. Prairie with cool and warm-season mid and shortgrasses with scattered shrubs and trees..
Jan Feb Mar Apr May Jun Jul Aug Sep Oct Nov Dec J F M A M J J A S O N D 2 2 2 2 3 8 8 18 23 15 15 2 State 2
Shrubland StateCommunity 2.1
Shrubland Community
Figure 8. 2.1 Shrubland Community
These plant communities are the result of livestock overgrazing and direct fire suppression. Overgrazing reduces the amount of palatable midgrasses and fine fuels needed for natural fires to occur. This provides a competitive advantage to woody plants. The most prevalent woody plant to increase is redberry and/or rosefruited juniper. Increases in shrubs and forbs such as catclaw mimosa, cutleaf goldenweed and broomweed are also observed.
Proper grazing management (adequate rest to allow recovery of some grasses) followed by prescribed fire and/or brush management will help transition the community back to composition similar to the reference. Brush management strategies may include grubbing and/or chemical herbicide application. Poor accessibility may limit management methods on steep slopes.
Figure 9. Annual production by plant type (representative values) or group (midpoint values)
Table 6. Annual production by plant type
Plant type Low
(lb/acre)Representative value
(lb/acre)High
(lb/acre)Grass/Grasslike 280 440 680 Shrub/Vine 208 327 504 Tree 177 278 430 Forb 35 55 85 Total 700 1100 1699 Figure 10. Plant community growth curve (percent production by month). TX0015 , Shrub/Shortgrass Community. Shrubs dominant with few shortgrasses present..
Jan Feb Mar Apr May Jun Jul Aug Sep Oct Nov Dec J F M A M J J A S O N D 1 1 2 2 2 8 8 20 25 15 15 1 Transition T1A
State 1 to 2With fire suppression and improper grazing management, the Grassland State will shift to the Shrubland State.
Restoration pathway R2A
State 2 to 1Prescribed Burning, Brush Management, and Prescribed Grazing should lead back to Grassland State.
Conservation practices
Brush Management Prescribed Burning Prescribed Grazing Additional community tables
Table 7. Community 1.1 plant community composition
Group Common name Symbol Scientific name Annual production () Foliar cover (%) Grass/Grasslike1 Warm-season mid/tallgrasses 140–280 sideoats grama BOCU Bouteloua curtipendula 75–200 – cane bluestem BOBA3 Bothriochloa barbinodis 65–150 – 2 Warm-season mid/tallgrasses 140–280 tanglehead HECO10 Heteropogon contortus 50–125 – Texas bluestem SCCI2 Schizachyrium cirratum 50–125 – little bluestem SCSCS Schizachyrium scoparium var. scoparium 40–100 – 3 Warm-season midgrasses 105–210 black grama BOER4 Bouteloua eriopoda 50–125 – blue grama BOGR2 Bouteloua gracilis 50–125 – 4 Warm-season midgrasses 105–210 Arizona cottontop DICA8 Digitaria californica 30–75 – green sprangletop LEDU Leptochloa dubia 30–75 – streambed bristlegrass SELE6 Setaria leucopila 15–30 – plains lovegrass ERIN Eragrostis intermedia 15–30 – spidergrass ARTE3 Aristida ternipes 15–30 – 5 Warm-season mid/shortgrasses 35–70 hairy grama BOHI2 Bouteloua hirsuta 15–40 – woolyspike balsamscale ELBA Elionurus barbiculmis 15–40 – sprucetop grama BOCH Bouteloua chondrosioides 10–25 – 6 Warm-season midgrasses 28–56 common wolfstail LYPH Lycurus phleoides 12–25 – fall witchgrass DICO6 Digitaria cognata 10–20 – slim tridens TRMU Tridens muticus 5–15 – 7 Cool-season grasses 7–14 southwestern needlegrass ACEM4 Achnatherum eminens 3–6 – New Mexico feathergrass HENE5 Hesperostipa neomexicana 2–5 – squirreltail ELEL5 Elymus elymoides 1–2 – Forb8 Forbs 35–70 Forb, annual 2FA Forb, annual 3–7 – Forb, dicot, perennial 2FDP Forb, dicot, perennial 3–7 – white sagebrush ARLUM2 Artemisia ludoviciana ssp. mexicana 3–7 – croton CROTO Croton 3–7 – golden prairie clover DAAU Dalea aurea 3–7 – buckwheat ERIOG Eriogonum 3–7 – curlycup gumweed GRSQ Grindelia squarrosa 3–7 – lacy tansyaster MAPI Machaeranthera pinnatifida 3–7 – small Indian breadroot PEPE27 Pediomelum pentaphyllum 3–7 – polygala POLYG Polygala 3–7 – awnless bushsunflower SICA7 Simsia calva 3–7 – branched noseburn TRRA5 Tragia ramosa 3–7 – Shrub/Vine9 Shrubs 56–112 resinbush VIST Viguiera stenoloba 10–25 – featherplume DAFO Dalea formosa 10–20 – black prairie clover DAFR2 Dalea frutescens 10–20 – littleleaf ratany KRER Krameria erecta 8–15 – rough menodora MESC Menodora scabra 5–10 – brickellbush BRICK Brickellia 5–10 – fragrant sumac RHAR4 Rhus aromatica 5–10 – sage SALVI Salvia 5–10 – tree cholla CYIMI Cylindropuntia imbricata var. imbricata 4–8 – Texas sacahuista NOTE Nolina texana 4–8 – catclaw mimosa MIACB Mimosa aculeaticarpa var. biuncifera 2–6 – catclaw acacia ACGR Acacia greggii 2–6 – yucca YUCCA Yucca 2–6 – Tree10 Trees 49–98 Emory oak QUEM Quercus emoryi 15–35 – Chisos red oak QUGR2 Quercus gravesii 15–35 – gray oak QUGR3 Quercus grisea 15–35 – redberry juniper JUCO11 Juniperus coahuilensis 10–20 – Pinchot's juniper JUPI Juniperus pinchotii 10–20 – Mexican pinyon PICE Pinus cembroides 0–15 – Table 8. Community 2.1 plant community composition
Group Common name Symbol Scientific name Annual production () Foliar cover (%) Interpretations
Animal community
The site is suitable for properly managed (appropriate stocking rates) livestock grazing. Cattle are generally limited to slopes gradients less than 15 percent, while sheep and goats can utilize steeper, rockier slopes. Improper grazing management causes a gradual decline in range health reducing livestock nutrition and habitat quality for wildlife. Livestock should be stocked at or below carrying capacity in proportion to the grazeable grass, forbs, and browse. Cattle, sheep, goats, and horses are susceptible to oak poisoning which can result from consuming large amounts, or at least 6 percent of an animal’s body weight of dry plant matter (acorns, young leaves, buds, stems, and/or flowers).
Many types of wildlife use the HCPC of this site. Invertebrates, reptiles, birds, and mammals either use the site as their primary habitat or visit from adjacent sites. Common mammals include mule deer, mountain lions, black-tailed jackrabbit, cottontail rabbit, javelina, coyote, skunk, woodrats, and many nocturnal mice. Historically, desert bighorn sheep most likely grazed this site. Game birds include scaled quail and dove. Numerous songbirds and raptors also occur in the area. Diversity in both plant species and plant communities over short distances is important for healthy wildlife populations.
Plant Preference by Animal Kind:
These preferences are somewhat general in nature as the preferences for plants is dependent upon grazing experience, time of year, availability of choices, and total forage supply.
Legend: P=Preferred D=Desirable U=Undesirable N=Not Consumed T=Toxic X=Used, but not degree of utilization unknown
Preferred – Percentage of plant in animal diet is greater than it occurs on the land
Desirable – Percentage of plant in animal diet is similar to the percentage composition on the land
Undesirable – Percentage of plant in animal diet is less than it occurs on the land
Not Consumed – Plant would not be eaten under normal conditions. Only consumed when other forages not available.
Toxic – Rare occurrence in diet and, if consumed in any tangible amounts results in death or severe illness in animal
Hydrological functions
The existing plant community with representative plant species, current soil conditions (soil health), land management, and climate affect the dynamics of the water cycle. Plant and litter cover are important factors, which protect the site from erosion. However, total production and the types of plant species present have greater impact on hydrologic dynamics (infiltration capacity, runoff, and soil losses).
Water runoff potential is inherently high because of steep slopes. A high perennial grass cover is important for decreasing runoff and increasing water infiltration. The reference plant communities are associated with optimum hydrologic function within this site. The high degree of hydrologic function in state 1 is due to the adequate vegetative cover and dominance of deep-rooted midgrasses compared to more shallow rooted shortgrasses. When properly managed, these species provide adequate cover that will minimize runoff. One of the key concepts to high hydrologic function is the structure and morphology of the root system and other biotic and abiotic factors. During high rainfall periods, water may percolate beyond the immediate surface root zone via fractures in the bedrock. As this water moves downward, it contributes to the recharge of springs or groundwater even though precise amounts have not been measured. The amount of rock cover also helps reduce runoff and protect the soil from erosion. In addition, surface fragments shed water received from precipitation to the fine earth between fragments. Fragments in the soil do not absorb or release water therefore concentrates precipitation into a smaller soil volume. The soil water content on these soils is higher than soils without rock fragments, especially after small rain events. Within this site, woody plants and a high diversity of forbs are often correlated with rock outcrops.
Livestock overgrazing, can potentially influence infiltration rates and overland flow by reducing the amount of perennial, deep rooted mid and tall grasses. Increases in overland flow can lead to soil erosion and decreased infiltration. In the Woody Plant Encroached State (2), increases in junipers and potentially other trees can decrease the amount of water available to other plants by rainfall interception and evapotranspiration and stemflow to the base of the tree.
Recreational uses
The site is suitable for hiking in areas of low relief and hunting.
Wood products
Trees can be used for firewood, posts, and some lumber.
Other products
None.
Other information
None.
Supporting information
Inventory data references
Information presented here has been developed from NRCS clipping, composition, plant cover, and soils data. Where empirical data is limiting, technical interpretations were made based of field experience.
Other references
Blackburn, W.H., R.W. Knight, and M.K. Wood. 1981. Impacts of grazing on watersheds: A state of knowledge. Paper presented at the National Academy of Sciences/National Research Council, Committee on Developing Strategies for Rangeland Management, Workshop on: Impacts of Grazing Intensity and Specialized Grazing systems on Use and Value of Rangelands. El Paso, TX, March 16-17, 1981.
Briske, D.D., J.D. Derner, J.R. Brown, S.D. Fuhlendorf, W.R. Teague, K.M. Havstad, R.L. Gillen, A.J. Ash, and W.D. Williams. 2008. Rotational grazing on rangelands: Reconciliation of perception and experimental evidence. Rangeland Ecology and Management 61: 3-17.
Hart, C.R., T. Garland, A.C. Barr, B.B. Carpenter, and J.C. Reagor. 2003. Toxic plants of Texas. Texas Cooperative Extension publication, Texas A&M Press, College Station.
Owens, M.K., R. Lyons, and C. Kneuper. 2001. Evaporation and interception water loss from juniper communities on the Edwards Aquifer Recharge Area. Final Report, Texas Agricultural Experiment Station and Texas Agricultural Extension Service, Uvalde Research and Extension Center, Uvalde, TX.
Powell, M.A. 2000. Grasses of the Trans-Pecos and Adjacent Areas. Iron Mountain Press, Marathon, TX.
Powell, M.A. 1998. Trees and shrubs of the Trans-Pecos and adjacent areas. University of Texas Press, Austin.
Ramirez, L.M. 2003. Classification of the plant communities of Davis Mountains State Park, Jeff Davis County, Texas. Thesis, Sul Ross State University, Alpine, TX.
USDA, National Water and Climate Center, “Climate Reports,” http://www.wcc.nrcs.usda.gov/climate/ (accessed January 2007).
USDA, Natural Resources Conservation Service, “Plants Database,” http://plants.usda.gov/ (accessed October 2008).
Warnock, B.H. 1977. Wildflowers of the Davis Mountains and Marathon Basin Texas. Sul Ross State University, Alpine, TX.
Reviewers
Jim Clausen, Soil Scientist, NRCS, Marfa, TX
Lynn Loomis, Soil Scientist, NRCS, Marfa, TX
Laurie Meadows, Soil Conservation Technician, NRCS, Marfa, TX
Mark Moseley, Rangeland Management Specialist, NRCS, San Antonio, TX
David Trujillo, Rangeland Management Specialist, NRCS, Las Cruces, NM
Contributors
Michael Margo, RMS, NRCS, Marfa, Texas
UnknownRangeland health reference sheet
Interpreting Indicators of Rangeland Health is a qualitative assessment protocol used to determine ecosystem condition based on benchmark characteristics described in the Reference Sheet. A suite of 17 (or more) indicators are typically considered in an assessment. The ecological site(s) representative of an assessment location must be known prior to applying the protocol and must be verified based on soils and climate. Current plant community cannot be used to identify the ecological site.
Author(s)/participant(s) Contact for lead author Date Approved by Approval date Composition (Indicators 10 and 12) based on Annual Production Indicators
-
Number and extent of rills:
-
Presence of water flow patterns:
-
Number and height of erosional pedestals or terracettes:
-
Bare ground from Ecological Site Description or other studies (rock, litter, lichen, moss, plant canopy are not bare ground):
-
Number of gullies and erosion associated with gullies:
-
Extent of wind scoured, blowouts and/or depositional areas:
-
Amount of litter movement (describe size and distance expected to travel):
-
Soil surface (top few mm) resistance to erosion (stability values are averages - most sites will show a range of values):
-
Soil surface structure and SOM content (include type of structure and A-horizon color and thickness):
-
Effect of community phase composition (relative proportion of different functional groups) and spatial distribution on infiltration and runoff:
-
Presence and thickness of compaction layer (usually none; describe soil profile features which may be mistaken for compaction on this site):
-
Functional/Structural Groups (list in order of descending dominance by above-ground annual-production or live foliar cover using symbols: >>, >, = to indicate much greater than, greater than, and equal to):
Dominant:
Sub-dominant:
Other:
Additional:
-
Amount of plant mortality and decadence (include which functional groups are expected to show mortality or decadence):
-
Average percent litter cover (%) and depth ( in):
-
Expected annual annual-production (this is TOTAL above-ground annual-production, not just forage annual-production):
-
Potential invasive (including noxious) species (native and non-native). List species which BOTH characterize degraded states and have the potential to become a dominant or co-dominant species on the ecological site if their future establishment and growth is not actively controlled by management interventions. Species that become dominant for only one to several years (e.g., short-term response to drought or wildfire) are not invasive plants. Note that unlike other indicators, we are describing what is NOT expected in the reference state for the ecological site:
-
Perennial plant reproductive capability:
Print Options
Sections
Font
AAAAOther
PrintThe Ecosystem Dynamics Interpretive Tool is an information system framework developed by the USDA-ARS Jornada Experimental Range, USDA Natural Resources Conservation Service, and New Mexico State University.
Accessibility statement


