Natural Resources
Conservation Service
Ecological site R042AC249TX
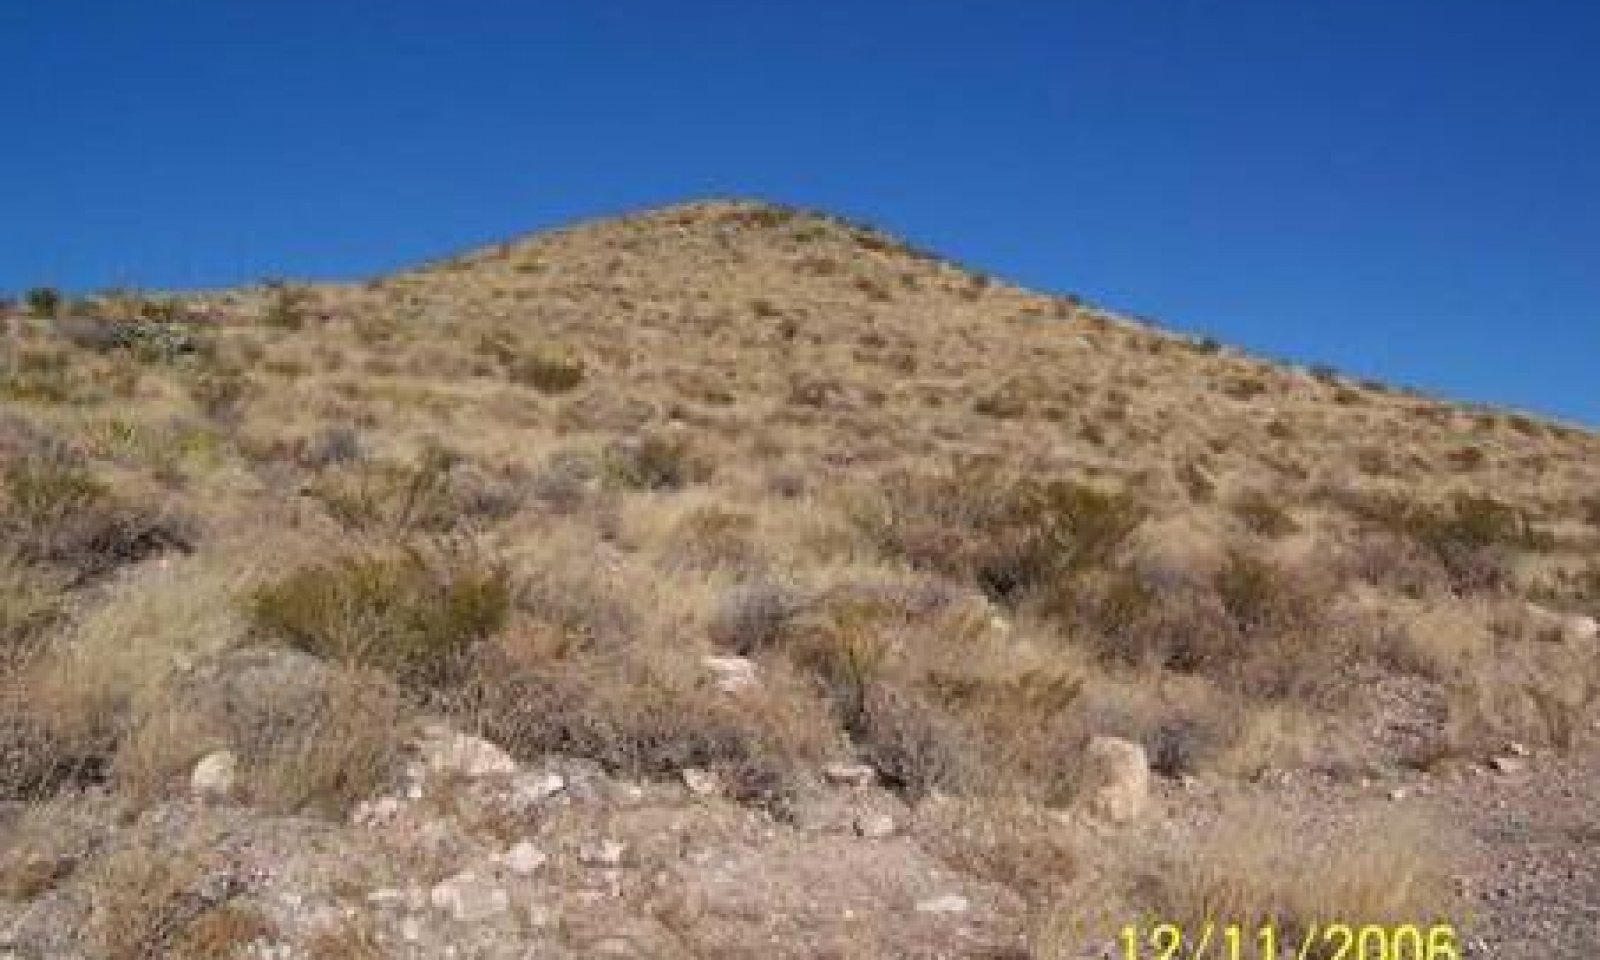
Limestone Hill and Mountain,
Desert Grassland
Last updated: 8/10/2020
Accessed: 06/22/2026
-
Search


Major Land Resource Area or ecological site by name and/or ID.
PreviousSectionsNextGeneral information
Provisional. A provisional ecological site description has undergone quality control and quality assurance review. It contains a working state and transition model and enough information to identify the ecological site.
Click to explore map
Figure 1. Mapped extent
Areas shown in blue indicate the maximum mapped extent of this ecological site. Other ecological sites likely occur within the highlighted areas. It is also possible for this ecological site to occur outside of highlighted areas if detailed soil survey has not been completed or recently updated.
Associated sites
R042AB737TX Limestone Hill and Mountain, Hot Desert Shrub
Limestone Hill & Mtn – Hot Desert Shrub will be encountered at lower elevations than Desert Grassland site.
Similar sites
R042AC247TX Igneous Hill and Mountain, Desert Grassland
Igneous Hill & Mountain Desert Grassland site is similar to the Limestone Hill and Mountain Desert Grassland, but is formed from igneous (volcanic) parent materials instead of limestone parent material.
Table 1. Dominant plant species
Tree Not specified
Shrub Not specified
Herbaceous Not specified
Physiographic features
The Limestone Hill & Mountain (Desert Grassland) was formed in colluvium and residuum weathered from limestone. These soils are on undulating to very steep hills. Slopes range from 3 to 60 percent, mainly 5 to 60 percent slopes. The elevation ranges from 3,600 to 4600 feet.
Table 2. Representative physiographic features
Landforms (1) Escarpment
(2) Hill
(3) Ridge
Flooding frequency None Ponding frequency None Elevation 3600 – 4600 ft Slope 3 – 60 % Aspect Aspect is not a significant factor Climatic features
The average annual precipitation ranges from 12 to 14 inches and highly variable from 3 to 32 inches. Approximately 75 percent of the precipitation occurs as widely scattered thunderstorms of high intensity and short duration during the summer. Occasional precipitation occurs as light rainfall during the cool season. Negligible amounts of precipitation falls in the form of sleet or snow.
The optimum growing season ranges from July 1 through September, but is governed by time and amount of rainfall. Although frost-free days begin in April, sufficient moisture for growing plants to reach maturity is usually not available until late summer or early fall. Mean annual air temperature is 64° F. Daytime temperatures near 100º F are common from May through August. The prevailing wind is from the southwest. Average wind speed is highest, around 11 miles per hour, in March and April.
The combination of low rainfall and relative humidity, warm temperatures, and high solar radiation creates a significant moisture deficit. The annual Class-A pan evaporation is approximately 85 inches.
Table 3 Representative climatic features
Frost-free period (average) 230 days Freeze-free period (average) 260 days Precipitation total (average) 10 in BarLineFigure 2. Monthly precipitation range
BarLineFigure 3. Monthly average minimum and maximum temperature
">Influencing water features
None.
Soil features
The Bissett series consists of very shallow and shallow, well drained soils with moderately slow permeability. They formed in colluvium and residuum weathered from limestone Runoff is high on 3 to 5 percent slopes, and very high on slopes greater than 5 percent. The associated soil series is Bissett.
Table 4. Representative soil features
Parent material (1) Residuum – limestone
Surface texture (1) Very gravelly loam
Family particle size (1) Loamy
Drainage class Well drained Permeability class Very slow Soil depth 4 – 20 in Surface fragment cover <=3" 10 – 35 % Surface fragment cover >3" 10 – 25 % Available water capacity
(0-40in)0 – 2 in Calcium carbonate equivalent
(0-40in)40 – 80 % Electrical conductivity
(0-40in)0 – 2 mmhos/cm Sodium adsorption ratio
(0-40in)Not specified Soil reaction (1:1 water)
(0-40in)7.9 – 8.4 Subsurface fragment volume <=3"
(Depth not specified)30 – 40 % Subsurface fragment volume >3"
(Depth not specified)4 – 15 % Ecological dynamics
The historic climax plant community (HCPC) on the Limestone Hill & Mountain (Desert Grassland) site consists of bunch and stoloniferous grasses along with a variety of perennial forbs and woody shrubs.
Probably the factor that most influenced the historic vegetative composition of the site was extended dry weather. High rainfall events did occur but were episodic. However, insects and grazers such as rodents, deer, and infrequent fire certainly played a part. Bison were not documented in the historical record as being present in any significant amount. A lack of water was probably a contributing factor. The perennial grasses dominating the site could survive the periodic droughts as long as the density of woody plants did not become excessive, and top-removal of the grass plants did not occur too frequently. Overgrazing amplifies the effects of drought.
Early historical records do not always provide information specific to a site but can provide insight as to conditions existing in a general vicinity. Accounts suggest cattle, sheep, and horses were introduced into the southwest from Mexico in the mid-1500's. However, extensive ranching did not begin in the Trans-Pecos region until the 1880s. Early explorers described the vegetation as they traveled over parts of the Trans-Pecos. For instance, Captain John Pope in 1854 described a portion of the Trans-Pecos area as “…destitute of wood and water, except at particular points, but covered with a luxuriant growth of the richest and most nutritious grasses known to this continent…”. Other early travelers describe the scattered springs and water sources that were found in the region. Wagon travel could only be accomplished, along trails that had both water and forage sufficient for overnight stops. Livestock numbers peaked in the late 1880’s following the arrival of railroads. Some historical accounts document ranches with stocking rates as high as one animal unit per four acres; however, this was far from sustainable in this environment.
Decades of overgrazing with loss of vegetation and erosion make it a slow process to return to the HCPC community. For example, in 1944 the southernmost portion of the Trans-Pecos area was set aside as Big Bend National Park. Grazing activities with livestock ceased. For example, in 1944, most of the Igneous Hill and Mountain Desert Grassland sites accessible to livestock were probably degraded and dominated by woody shrubs. After 60 years of no grazing, the majority of sites have not recovered to the historic plant community which provides insight into the length of time it takes for recovery in this environment.
The large livestock herds brought in during the favorable years, mainly sheep, could not be sustained during the drought. Overgrazing became a major issue as the extended dry weather was a harsh taskmaster to the early stock growers.
Cattle use on rangeland declines significantly on slopes steeper than 15 percent, however cattle numbers were never very large. Sheep and goats are however able to utilize slopes up to about 45 percent and can negotiate the surface rock cover better than cattle. It should be noted that abusive grazing by different kinds and classes of livestock will result in different impacts on the site. One effect of the removal of vegetated cover was to expose bare ground to erosion. Another effect was the deterioration of perennial grasses which removed the source of fine fuel to sustain periodic fires. More than likely, fires were not very frequent and when they did occur, the burn pattern was a mosaic governed by terrain and vegetative features.
Continued drought and overgrazing bring an increase in lechuguilla (Agave lechuguilla), ocotillo (Fouquieria splendens), and other woody and weedy species that initially occupied the site in small amounts. More than likely, fires were infrequent and when they did occur, the burn pattern was a mosaic governed by terrain and vegetative features. This site would have had higher anticipated fire frequency than the Limestone Hill & Mountain (Desert Shrub) due to the greater amount of grass for fine fuel. But, fires were still infrequent. The woody increasers begin to compete with the mid and short grasses for sunlight, nutrients, water, and space. In this stage, herbaceous production begins to give way to shade tolerant species and shrubby vegetation. Bare ground and soil erosion continue to increase as the site transitions into a shrub dominated community with over 40% woody vegetation.State and transition model
Custom diagramStandard diagram
Figure 4. State & Transition Model - Limestone Hill & Mtn (D
More interactive model formats are also available. View Interactive Models
More interactive model formats are also available. View Interactive Models
Click on state and transition labels to scroll to the respective textEcosystem states
State 1 submodel, plant communities
State 2 submodel, plant communities
State 3 submodel, plant communities
State 1
Midgrass Grassland with Shrubs StateCommunity 1.1
Midgrass Grassland with Shrubs Community
Figure 5. 1.1 Midgrass Grassland with Shrubs Community
The HCPC reference community for this site is dominated by midgrasses such as black grama (Bouteloua eriopoda), sideoats grama (Bouteloua curtipendula), cane bluestem (Bothriochloa barbinodis), and tanglehead (Heteropogon contortus). Chino grama (Bouteloua ramosa) may occur on south-facing slopes. Sideoats grama, green sprangletop (Leptochloa dubia), cane bluestem, and black grama are more likely to dominate north-facing slopes. Woody species make up less than 15% of the total area. Woody vegetation usually consists of shrubs such as kidneywood (Eysenhardtia spp.), skeletonleaf goldeneye (Viguiera stenoloba), feather dalea (Dalea formosa), and pricklypear (Opuntia spp.). Skeletonleaf goldeneye and kidneywood are more common on rough broken slopes.
Bare ground is less than 5%. Interspaces between plants are lightly covered with litter. The small amount of erosion is significant due to the shallow nature of the soil. Erosion is kept to a minimum due to the high amount of plant and rock cover. Infiltration is slow to moderate. Runoff occurs during heavier rainfall, but is slowed by rocks covering the soil and vegetative ground cover. Concentrated water flow patterns are very rare. Rare periodic fire, climatic patterns, and grazing by deer and other herbivores were natural processes that maintained this historic plant community.
This plant community is useful for grazing livestock, but stocking rates must remain very conservative to maintain the HCPC. During drought years, livestock should be carefully managed on the site to avoid overgrazing. Wildlife continues to utilize the site under drought conditions. If livestock are not carefully managed, the grazing impact is likely to cause permanent changes from the Midgrass Grassland with Shrubs Community (1.1) to the Shortgrass Dominant Community (2.1). The site also contains food and cover for mule deer, dove, quail, and other types of wildlife.
The retrogression to the shortgrass community can be controlled with relatively small labor and cost input if measures are taken very early. Once the threshold (T1A) has been crossed, it is much more difficult and costly to restore the HCPC.
Figure 6. Annual production by plant type (representative values) or group (midpoint values)
Table 5. Annual production by plant type
Plant type Low
(lb/acre)Representative value
(lb/acre)High
(lb/acre)Grass/Grasslike 435 490 570 Shrub/Vine 60 75 90 Forb 60 70 80 Tree 0 0 0 Total 555 635 740 Figure 7. Plant community growth curve (percent production by month). TX0006 , Midgrass Grassland with Shrubs Community. Midgrasses with Shrubs – Growth is predominately midgrasses and shrubs from June through November with peak growth from August to November..
Jan Feb Mar Apr May Jun Jul Aug Sep Oct Nov Dec J F M A M J J A S O N D 1 1 2 2 2 8 8 20 25 15 15 1 State 2
Shortgrass Dominant StateCommunity 2.1
Shortgrass Dominant Community
Figure 8. 2.1 Shortgrass Dominant Community
The historically dominant grass species decline and are replaced by perennial threeawns (Aristida spp.), slim tridens (Tridens muticus), hairy tridens (Erioneuron pilosum), and other short grasses. Weather variability, especially low precipitation, overgrazing, lack of brush management, and elimination of fire accelerate the change. Lehmann’s lovegrass (Eragrostis lehmanniana) can occur throughout the Hot Desert Shrub, Desert Grassland and Lower Mixed Prairie Land Resource Units. This non-native species has the potential to displace native species.
The amount of bare ground increases up to 15%. (Bare ground does not include rock cover). This has several impacts. Ground cover by litter and soil organic matter decreases. Loss of vegetation exposes the soil surface. Bare ground causes increases in soil temperature, soil crusting, the potential for erosion; and a decrease in water infiltration. As rainfall runs off signs of erosion become more apparent. The steep slopes of this site increase the likelihood of erosion.
This plant community is still useful for grazing livestock, but stocking rates must be kept lower than under the HCPC or midgrass decline will continue. Brush management and prescribed grazing will be necessary to slow woody encroachment. Grazing management alone may not arrest the brush encroachment at this point. Due to the historic erosion, soil crusting, loss of topsoil and soil organic matter, this site is difficult to return to economically return to the HCPC.
The site still contains food and cover for mule deer, dove, quail, and other types of wildlife.
Figure 9. Annual production by plant type (representative values) or group (midpoint values)
Table 6. Annual production by plant type
Plant type Low
(lb/acre)Representative value
(lb/acre)High
(lb/acre)Grass/Grasslike 200 350 430 Shrub/Vine 100 150 170 Forb 50 65 80 Tree 0 0 0 Total 350 565 680 Figure 10. Plant community growth curve (percent production by month). TX0007 , Shortgrass Dominant Community. Shortgrasses Dominant with Shrubs – Growth is predominately shortgrasses and shrubs from June through November with peak growth from Aug. to Nov..
Jan Feb Mar Apr May Jun Jul Aug Sep Oct Nov Dec J F M A M J J A S O N D 1 1 2 2 2 8 8 20 25 15 15 1 State 3
Shrub Dominant StateCommunity 3.1
Shrub Dominant Community
Figure 11. 3.1 Shrub Dominant Community
This community represents a significant vegetation shift, crossing the threshold (T2A) from the Shortgrass Dominant Community (2.1) to the Shrub Dominant Community (3.1). The major woody increaser species, primarily lechuguilla, ocotillo, sotol (Dasylirion wheeleri), and acacia (Acacia spp.), have multiplied until they comprise over 40% of the total production and exert strong influence on the site. Total grass and grasslike production is severely restricted. The shortgrasses compose about 25-30% of the production, and include species such as threeawns, slim tridens, and hairy tridens.
Ground cover has decreased. Over 20% of the ground is bare. Water runoff increases and signs of erosion are more common. Soil stability is generally low and rills and small pedestals may be seen in some areas. At this point, rocks and woody plant roots may be major components in holding some soil on the site.
This site provides some cover and food for, deer, and other wildlife, including songbirds. At this stage, there is generally limited forage for domestic livestock.
It is possible to return to the Shortgrass Dominant Community (2.1) with higher than normal precipitation, careful prescribed grazing and brush management, which may include individual plant treatment, if it determined to be economically feasible. There are not always viable IPT choices for all brush species nor does terrain facilitate treatments. All of these management practices must be integrated and this process is still likely to take many years. Due to the historic erosion and loss of topsoil and soil organic matter on these sites, they are probably unable to return to the HCPC.
Figure 12. Annual production by plant type (representative values) or group (midpoint values)
Table 7. Annual production by plant type
Plant type Low
(lb/acre)Representative value
(lb/acre)High
(lb/acre)Shrub/Vine 100 150 200 Grass/Grasslike 60 100 120 Forb 40 50 80 Tree 0 0 0 Total 200 300 400 Figure 13. Plant community growth curve (percent production by month). TX0008 , Shrub Dominant Community. Shrub Dominant – Growth is predominately shrubs with some grasses from June through November with peak growth from August to November..
Jan Feb Mar Apr May Jun Jul Aug Sep Oct Nov Dec J F M A M J J A S O N D 1 1 1 2 2 12 12 18 20 15 15 1 Transition T1A
State 1 to 2Heavy Continuous Grazing, Drought, Lack of Occasional Fires transitions to Shortgrass Dominant State.
Transition T2A
State 2 to 3Heavy Continuous Grazing, Amplified by Drought Conditions, Invasives/Invaders increasing, Lack of grass cover.
Restoration pathway R3A
State 3 to 2Brush Management, IPT, Prescribed Grazing.
Conservation practices
Brush Management Prescribed Grazing Additional community tables
Table 8. Community 1.1 plant community composition
Group Common name Symbol Scientific name Annual production () Foliar cover (%) Grass/Grasslike1 Midgrasses 170–220 cane bluestem BOBA3 Bothriochloa barbinodis 50–160 – sideoats grama BOCU Bouteloua curtipendula 50–160 – tanglehead HECO10 Heteropogon contortus 50–160 – 2 Midgrasses 85–110 Arizona cottontop DICA8 Digitaria californica 30–100 – plains lovegrass ERIN Eragrostis intermedia 30–100 – green sprangletop LEDU Leptochloa dubia 30–100 – streambed bristlegrass SELE6 Setaria leucopila 30–100 – 3 Shortgrasses 70–90 black grama BOER4 Bouteloua eriopoda 40–90 – blue grama BOGR2 Bouteloua gracilis 30–60 – hairy grama BOHI2 Bouteloua hirsuta 30–60 – Chino grama BORA4 Bouteloua ramosa 30–60 – 4 Shortgrasses 70–90 threeawn ARIST Aristida 30–60 – fall witchgrass DICO6 Digitaria cognata 20–50 – bush muhly MUPO2 Muhlenbergia porteri 20–50 – 5 Shortgrasses 30–40 hairy woollygrass ERPI5 Erioneuron pilosum 10–20 – slim tridens TRMU Tridens muticus 10–20 – 6 Tallgrass 5–10 little bluestem SCSCS Schizachyrium scoparium var. scoparium 5–10 – 7 Shortgrasses 5–10 red grama BOTR2 Bouteloua trifida 5–10 – low woollygrass DAPU7 Dasyochloa pulchella 5–10 – Forb8 Forbs 30–40 sundrops CALYL Calylophus 10–20 – purple dalea DALA4 Dalea lasiathera 10–20 – blackfoot MELAM Melampodium 10–20 – menodora MENOD Menodora 10–20 – awnless bushsunflower SICA7 Simsia calva 10–20 – 9 Forbs 30–40 croton CROTO Croton 10–20 – buckwheat ERIOG Eriogonum 10–20 – Gregg's tube tongue JUPI5 Justicia pilosella 10–20 – bladderpod LESQU Lesquerella 10–20 – polygala POLYG Polygala 10–20 – greenthread THELE Thelesperma 10–20 – Shrub/Vine10 Shrubs/Vines 20–30 desert myrtlecroton BEOB Bernardia obovata 10–20 – alderleaf mountain mahogany CEMO2 Cercocarpus montanus 10–20 – featherplume DAFO Dalea formosa 10–20 – black prairie clover DAFR2 Dalea frutescens 10–20 – Texas kidneywood EYTE Eysenhardtia texana 10–20 – littleleaf ratany KRER Krameria erecta 10–20 – resinbush VIST Viguiera stenoloba 10–20 – 11 Shrubs/Vines 20–30 whitethorn acacia ACCO2 Acacia constricta 10–20 – catclaw acacia ACGR Acacia greggii 10–20 – lechuguilla AGLE Agave lechuguilla 10–20 – javelina bush COER5 Condalia ericoides 10–20 – Christmas cactus CYLE8 Cylindropuntia leptocaulis 10–20 – jointfir EPHED Ephedra 10–20 – ocotillo FOSP2 Fouquieria splendens 10–20 – pricklypear OPUNT Opuntia 10–20 – mariola PAIN2 Parthenium incanum 10–20 – Table 9. Community 2.1 plant community composition
Group Common name Symbol Scientific name Annual production () Foliar cover (%) Table 10. Community 3.1 plant community composition
Group Common name Symbol Scientific name Annual production () Foliar cover (%) Interpretations
Animal community
The historic Midgrass Grassland with Shrubs Community (1.1) was habitat for mule deer, songbirds, birds of prey, small mammals, and predators such as coyote, bobcat, and mountain lion. As the site changes through the Shortgrass Dominant Community (2.1) toward the Shrub Dominant Community (3.1), it becomes less suitable to some species due to the loss of habitat components and changes in structure.
Cattle, sheep, and goats can use this site, but the rocky ground and slopes make it difficult for livestock, especially cattle, to reach some forage areas. Cattle find the best forage in the Midgrass Community (1.1). Once this site reaches the Shrub Dominant Community (3.1), grazing opportunities for cattle are limited. An assessment of vegetation is needed to determine the site’s current carrying capacity in order to avoid overgrazing. Carrying capacity in the Trans-Pecos will vary greatly from year to year depending on the episodic precipitation.
Many species of wildlife utilize this site for at least a portion of their habitat needs. It is also important to balance wildlife populations with carrying capacity. Mule deer find good overall habitat on the Limestone Hill and Mountain Desert Grassland ecological site. They need high protein forbs and browse. They cannot utilize the lower protein grasses. Bighorn sheep are present on Limestone Hill and Mountain Desert Grassland site, at least for a portion of their habitat. They generally eat a wide variety of browse and forbs and small amounts of grass. Quail and dove prefer a combination of low shrubs, bunch grass, bare ground, and forbs. Game bird species such as mourning and white dove and scaled and bobwhite quail are usually present on the site. Smaller mammals present include rodents, jackrabbit, cottontail rabbit, raccoon, skunk, possum, and armadillo. Mammalian predators like coyote, bobcat, and mountain lion are likely to be found at the site. Wolves were common in earlier times and an occasional jaguar was encountered. Numerous species of snakes and lizards are native to the site.
Non-game species of birds found on this site include songbirds and birds of prey. Habitat on this site that provides a large diversity of grasses, forbs, and shrubs will support a variety and abundance of songbirds. Birds of prey are important to keep the numbers of rodents, rabbits, and snakes in balance.
Plant Preference by Animal:
These preferences are somewhat general in nature as the preference for a plant is dependent upon animals grazing experience, time of year, availability of choices, and total forage supply.
Preferred – Percentage of plant in animal diet is greater than it occurs on the land
Desirable – Percentage of plant in animal diet is similar to the percentage composition on the land
Undesirable – Percentage of plant in animal diet is less than it occurs on the land
Not Consumed – Plant would not be eaten under normal conditions. Plants are only consumed when other forages are not available.
Toxic – Rare occurrence in diet and, if consumed in any tangible amounts results in death or severe illness in animalHydrological functions
The Limestone Hill and Mountain Desert Grassland site is a well-drained, shallow, stony upland. Its soils are moderately to very slowly permeable. Because of the permeability and the surface rock, significant amounts of rainfall run off the site to sites located down slope. Rock outcrops in the limestone allowed limited deep percolation to ground water. The presence of stones and rock outcrops enhance the effectiveness of rainfall, especially small rainfall events, by concentrating it on a smaller surface area and reducing evaporation. When the site changes from Grasses to Shrub community, there is a vegetative structural group change resulting in increased runoff.
Recreational uses
The Limestone Hill and Mountain Desert Grassland site is well suited for many outdoor recreational uses including hunting, hiking, and bird watching. Its scenic beauty and topography make it a unique site, and colorful forbs can be found on or near the site throughout the spring and summer. Big Bend National Park is found in the southern portion of MLRA 42. It is well known for its scenic mountain desert grass and shrub lands, including the Limestone Hill and Mountain Desert Grassland.
Wood products
None.
Other products
None.
Other information
None.
Supporting information
Type locality
Location 1: Presidio County, TX UTM zone N UTM northing 3263948.28 UTM easting 615135.874 General legal description Along a dirt road within the Solitario Rim at Big Bend Ranch State Park. Other references
1. Archer S. 1994. Woody plant encroachment into southwestern grasslands and savannas: rates, patterns and proximate causes. In Ecological implications of livestock herbivory in the West, Ed M Vavra, W Laycock, R Pieper, pp13-68, Denver, CO: society for Range Management
2. Brewer, Clay E., Harveson, Louis A. 2005. Diets of Bighorn Sheep in the Chihuahuan Desert, Texas.
3. Gould F. 1978. Common Texas Grasses: an illustrated guide. College Station, TX: Texas A & M Press.
4. Hardy, Jean Evans. 1997. Flora and Vegetation of the Solitario Dome, Brewster and Presidio Counties, Texas. A Thesis Presented to the Graduate Council Sul Ross State University.
5. Hart, Charles R. et al. 2003. Toxic Plants of Texas. Texas Cooperative Extension. Texas A&M University System.
6. Heischmidt RK, Stuth, Eds. 1991 Grazing Management: an ecological perspective. Portland OR: Timberline Press
7. Powell, A. Michael. 1998. Trees and Shrubs of the Trans-Pecos and Adjacent Areas. Austin, Texas: University of Texas Press.
8. USDA/NRCS Soil Survey Manuals for Jeff Davis, Pecos, and Reeves Counties
9. Wauer, Roland H. 1973. Naturalist’s Big Bend. Santa Fe, New Mexico: Peregrine Productions.
10. http://www.tpwd.state.tx.us/landwater/land/habitats/trans_pecos/
The following individuals assisted with the development of this site description:
Charles Anderson, RMS, NRCS; San Angelo, Texas
Dr. Louis Harveson – Department Chair Department of Natural Resource Management, Sul Ross State University, Alpine, Texas
Dr. A.M. Powell, Professor Emeritus, Sul Ross State University, Alpine, Texas
Preston Irwin, RMS, NRCS; Fort Stockton, Texas
Dr. Lynn Loomis - Soil Scientist, NRCS; Marfa, Texas
Wayne Seipp, RMS, NRCS, Marfa, Texas
Justin Clary, RMS, NRCS; Temple, Texas
Contributors
Duckworth-Cole, Bryan, TX, Michael Margo, RMS, NRCS, Marfa, Texas
UnknownApproval
Scott Woodall, 8/10/2020
Rangeland health reference sheet
Interpreting Indicators of Rangeland Health is a qualitative assessment protocol used to determine ecosystem condition based on benchmark characteristics described in the Reference Sheet. A suite of 17 (or more) indicators are typically considered in an assessment. The ecological site(s) representative of an assessment location must be known prior to applying the protocol and must be verified based on soils and climate. Current plant community cannot be used to identify the ecological site.
Author(s)/participant(s) Contact for lead author Date 06/22/2026 Approved by Approval date Composition (Indicators 10 and 12) based on Annual Production Indicators
-
Number and extent of rills:
-
Presence of water flow patterns:
-
Number and height of erosional pedestals or terracettes:
-
Bare ground from Ecological Site Description or other studies (rock, litter, lichen, moss, plant canopy are not bare ground):
-
Number of gullies and erosion associated with gullies:
-
Extent of wind scoured, blowouts and/or depositional areas:
-
Amount of litter movement (describe size and distance expected to travel):
-
Soil surface (top few mm) resistance to erosion (stability values are averages - most sites will show a range of values):
-
Soil surface structure and SOM content (include type of structure and A-horizon color and thickness):
-
Effect of community phase composition (relative proportion of different functional groups) and spatial distribution on infiltration and runoff:
-
Presence and thickness of compaction layer (usually none; describe soil profile features which may be mistaken for compaction on this site):
-
Functional/Structural Groups (list in order of descending dominance by above-ground annual-production or live foliar cover using symbols: >>, >, = to indicate much greater than, greater than, and equal to):
Dominant:
Sub-dominant:
Other:
Additional:
-
Amount of plant mortality and decadence (include which functional groups are expected to show mortality or decadence):
-
Average percent litter cover (%) and depth ( in):
-
Expected annual annual-production (this is TOTAL above-ground annual-production, not just forage annual-production):
-
Potential invasive (including noxious) species (native and non-native). List species which BOTH characterize degraded states and have the potential to become a dominant or co-dominant species on the ecological site if their future establishment and growth is not actively controlled by management interventions. Species that become dominant for only one to several years (e.g., short-term response to drought or wildfire) are not invasive plants. Note that unlike other indicators, we are describing what is NOT expected in the reference state for the ecological site:
-
Perennial plant reproductive capability:
Print Options
Sections
Font
AAAAOther
PrintThe Ecosystem Dynamics Interpretive Tool is an information system framework developed by the USDA-ARS Jornada Experimental Range, USDA Natural Resources Conservation Service, and New Mexico State University.
Accessibility statement