Natural Resources
Conservation Service
Ecological site F041XA112AZ
Sandy Wash
16-20" p.z.
woodland
Last updated: 4/09/2021
Accessed: 06/30/2026
-
Search


Major Land Resource Area or ecological site by name and/or ID.
PreviousSectionsNextGeneral information
Provisional. A provisional ecological site description has undergone quality control and quality assurance review. It contains a working state and transition model and enough information to identify the ecological site.
Click to explore map
Figure 1. Mapped extent
Areas shown in blue indicate the maximum mapped extent of this ecological site. Other ecological sites likely occur within the highlighted areas. It is also possible for this ecological site to occur outside of highlighted areas if detailed soil survey has not been completed or recently updated.
MLRA notes
Major Land Resource Area (MLRA): 041X–Madrean Archipelago
AZ 41.1 – Mexican Oak-Pine Forest and Oak Savannah
Elevations range from 4500 to 10,700 feet and precipitation ranges from 16 to 30 inches. Vegetation includes Emory oak, Mexican blue oak, Arizona white oak, one-seed juniper, alligator juniper, sacahuista, California bricklebush, skunkbush sumac, Arizona rosewood, wait-a-bit mimosa, sideoats grama, blue grama, purple grama, wooly bunchgrass, plains lovegrass, squirreltail, and pinyon ricegrass. The soil temperature regime ranges from thermic to mesic and the soil moisture regime ranges from aridic ustic to typic ustic. This unit occurs within the Basin and Range Physiographic Province and is characterized by numerous mountain ranges that rise abruptly from broad, plain-like valleys and basins. Igneous and metamorphic rock classes dominate the mountain ranges and sediments filling the basins represent combinations of fluvial, lacustrine, colluvial and alluvial deposits.Ecological site concept
Sandy Wash, woodland, 16-20" p.z., is a gallery woodland dominated by oak trees (Emory and Arizona white oak). The sub-surface water table is seasonal; however, plants benefit from additional moisture received as rainfall run-off. Soils are sandy.
Associated sites
F041XA113AZ Sandy Bottom 16-20" p.z. woodland
R041XA102AZ Shallow Hills 16-20" p.z.
R041XA107AZ Loamy Slopes 16-20" p.z.
R041XA108AZ Loamy Upland 16-20" p.z.
R041XA110AZ Sandy Loam Upland 16-20" p.z.
R041XA111AZ Volcanic Hills 16-20" p.z.
Similar sites
R041XC316AZ Sandy Wash 12-16" p.z.
Table 1. Dominant plant species
Tree (1) Quercus emoryi
(2) Quercus arizonicaShrub Not specified
Herbaceous (1) Bouteloua curtipendula
(2) Leptochloa dubiaPhysiographic features
This site occurs in the middle elevations of the Madrean Basin and Range province in southeastern Arizona. It occurs on floodplains, low stream terraces and alluvial fans. It benefits on a regular basis from extra moisture received as over-bank flooding of stream channels and as runoff from adjacent uplands. It does not benefit from shallow water tables.
Table 2. Representative physiographic features
Landforms (1) Flood plain
(2) Stream terrace
(3) Alluvial fan
Flooding duration Very brief (4 to 48 hours) to brief (2 to 7 days) Flooding frequency Occasional to frequent Ponding duration Very brief (4 to 48 hours) to brief (2 to 7 days) Ponding frequency None to rare Elevation 4700 – 5300 ft Slope 0 – 3 % Aspect Aspect is not a significant factor Climatic features
Precipitation in this zone of the common resource area ranges from 16-20 inches per year with elevations from 4700-5500 feet. Approximately 40% of this moisture comes as gentle rain or snow during the winter-spring (Oct-Apr) season; originates in the north Pacific and Gulf of California and comes as frontal storms with long duration and low intensity. The remaining 60% falls in the summer season (May-Sep); originates in the Gulf of Mexico and are convective, usually brief, intense thunderstorms. Snow is common Dec-Mar, averaging 5-15 inches per year, but rarely lasts more than a week. May and June are the driest months. Humidity is low.
Temperatures are mild. Freezing temperatures are common at night from Oct-May, but daytime temperatures are almost always over 40 F. Below 0 F temperatures can occur Dec-Feb. Daytime summer highs rarely exceed 95 F.
Species like plains lovegrass, bottlebrush squirreltail, Arizona white oak and Emory oak begin growth in late March to April. Warm season grasses begin growth in July or August with receipt of the first summer rains.Table 3 Representative climatic features
Frost-free period (average) 180 days Freeze-free period (average) Precipitation total (average) 20 in BarLineFigure 2. Monthly precipitation range
BarLineFigure 3. Monthly average minimum and maximum temperature
Figure 4. Annual precipitation pattern
Figure 5 Annual average temperature pattern
">Influencing water features
There are no water features associated with this site.
Soil features
These are deep, young soils on gravelly and sandy alluvium of mixed origins. They are well drained and dark colored throughout. Soil surface textures range from very cobbly sandy loam to cobbly sand. Soils are sandy to coarse loamy. Plant-soil moisture relationships are very good due to the extra water received by the site.
This site is NOT CURRENTLY CORRELATED TO A SOIL SERIES IN ANY ARIZONA SOIL SURVEY AREA.Table 4. Representative soil features
Surface texture (1) Cobbly sand
(2) Very gravelly sandy loam
(3) Cobbly loamy sand
Family particle size (1) Sandy
Drainage class Somewhat excessively drained to well drained Permeability class Moderately rapid to rapid Soil depth 60 in Surface fragment cover <=3" 10 – 60 % Surface fragment cover >3" 1 – 15 % Available water capacity
(0-40in)1.8 – 6 in Calcium carbonate equivalent
(0-40in)0 – 5 % Electrical conductivity
(0-40in)0 – 2 mmhos/cm Sodium adsorption ratio
(0-40in)0 – 2 Soil reaction (1:1 water)
(0-40in)6.1 – 7.8 Subsurface fragment volume <=3"
(Depth not specified)10 – 65 % Subsurface fragment volume >3"
(Depth not specified)1 – 15 % Ecological dynamics
The plant communities found on an ecological site are naturally variable. Composition and production will vary with yearly conditions, location, aspect, and the natural variability of the soils. The Historical Climax Plant Community represents the natural potential plant communities found on relict or relatively undisturbed sites. Other plant communities described here represent plant communities that are known to occur when the site is disturbed by factors such as fire, grazing, or drought.
Production data provided in this site description is standardized to air dry weight at the end of the summer growing season. The plant communities described in this site description are based on near normal rainfall years.
NRCS uses a Similarity Index to compare existing plant communities to the plant communities described here. Similarity index is determined by comparing the production and composition of a plant community to the production and composition of a plant community described in this site description. To determine Similarity index, compare the production (air dry weight) of each species to that shown in the plant community description. For each species, count no more than the maximum amount shown for the species, and for each group, count no more than the maximum amount shown for each group. Divide the resulting total by the total normal year production shown in the plant community description. If the rainfall has been significantly above or below normal, use the total production shown for above or below normal years. If field data is not collected at the end of the summer growing season, then the field data must be corrected to the end of the year production before comparing it to the site description. The growth curve can be used as a guide for estimating production at the end of the summer growing season.
State and transition model
Custom diagramStandard diagram
Figure 6. State and Transition, Sandy Wash ,QUAR,QUEM 16-20"
More interactive model formats are also available. View Interactive Models
More interactive model formats are also available. View Interactive Models
Click on state and transition labels to scroll to the respective textEcosystem states
State 1 submodel, plant communities
State 2 submodel, plant communities
State 3 submodel, plant communities
State 4 submodel, plant communities
State 1
Historic Climax Plant CommunityCommunity 1.1
Historic Climax Plant Community
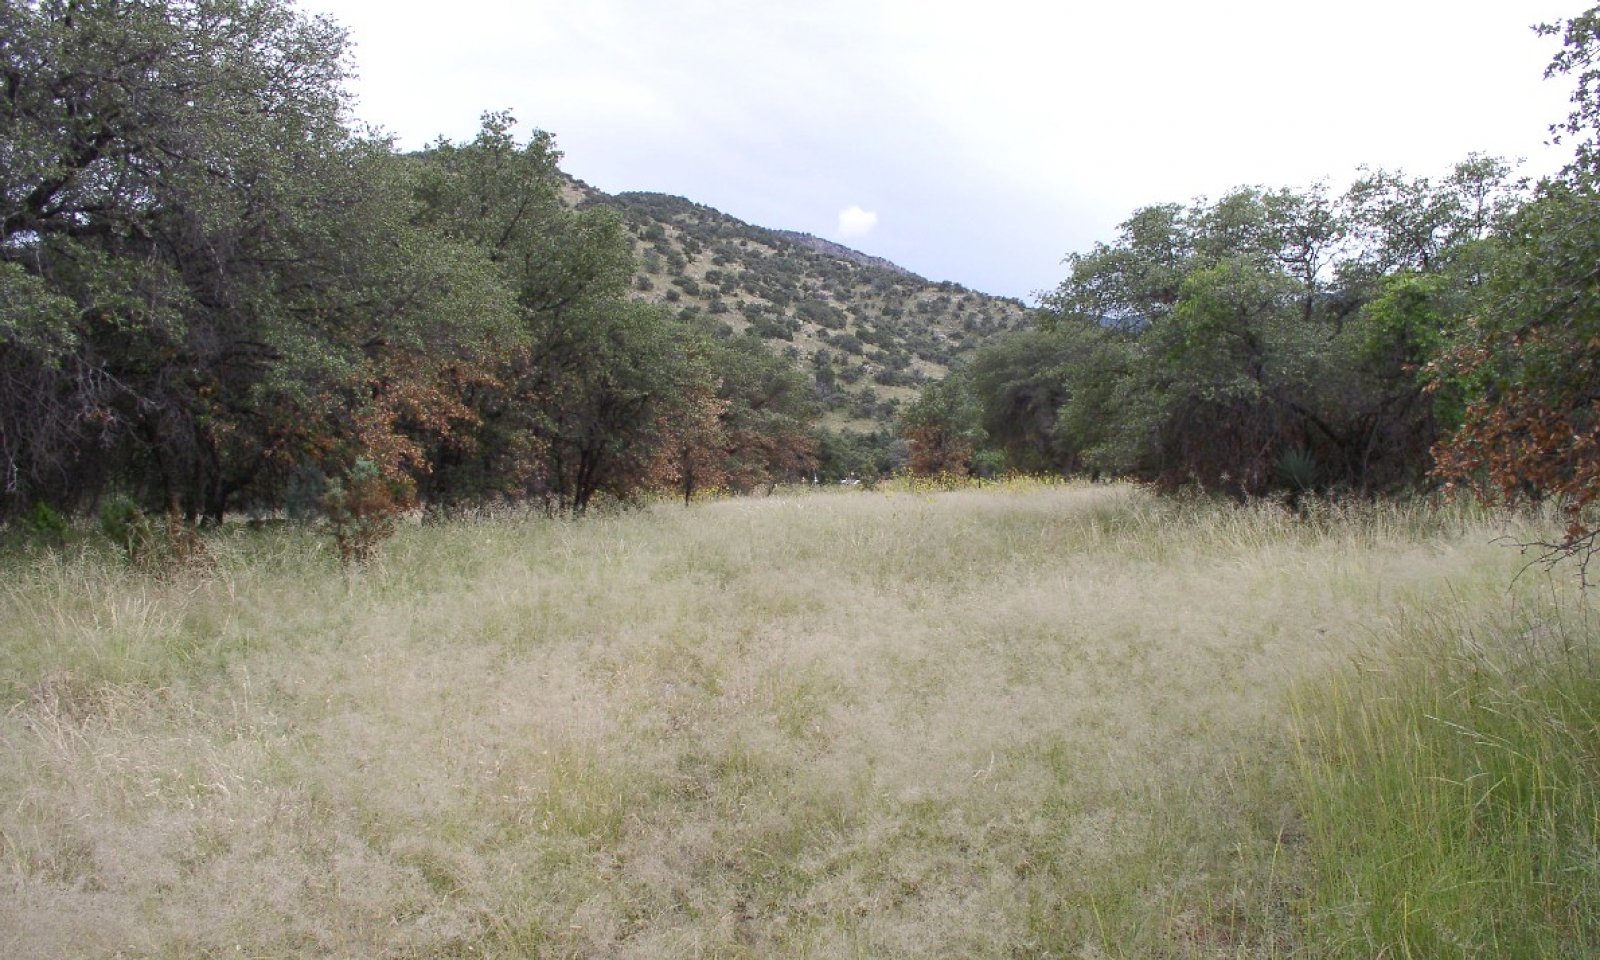
Figure 7. Sandy Wash QUAR, QUEM 16-20" pz. HCPC
This site has a mixed plant community with an over-story canopy of Arizona white oak and Emory oak, and lesser amounts of walnut, ash, desert willow and other trees. The under-story is dominated by perennial grasses and forbs. Evergreen live-oaks change their leaves in April and May. The aspect is evergreen woodland.
Channel and stream bank erosion and sedimentation are natural features of this site. Stream flow is intermittent and surface flow occurs sporadically during the winter months only. Springtime stream flow is not sufficient enough for the broadleaf deciduous riparian species. Oak species present on the site reproduce from acorns which germinate in the summer immediately after being produced. These species also sprout after cutting, flood injury, or fire. Tree canopy ranges from 20 -50%. Number of stems ranges from 200-400 per acre. Under-story composition and production varies with percent canopy cover. Trees reach maximum size on this site. Disturbance of the dominant native tree cover on the site can lead to increases of species such as mesquite and juniper. Disturbance of the under-story can lead to increases in species like southwestern rabbitbrush and wait-a-bit mimosa. Management of the under-story should be aimed at leaving enough cover to protect the soils from erosion and to trap sediment in the summer flooding season.
Forest overstory.The overstory part of the plant community is dominated by Arizona white oak and Emory oak. There may be lesser amounts of grey oak and alligator juniper. Deciduous tree species are present in minor amounts. They include netleaf hackberry, Arizona black walnut, Arizona ash, desert willow and an occasional Arizona sycamore. <br /> Tree canopy ranges from 20 to 50 percent. Trees reach maximum size (40 feet) on the site.<br /> "Forest Overstory Composition" as shown in the following tables is in percent canopy cover and not percent frequency.<br /> The "Plant Community Annual Production" table shows production for 50% canopy as low, 35% canopy as the representative value and 20% canopy as the high value.
Figure 8. Annual production by plant type (representative values) or group (midpoint values)
Table 5. Annual production by plant type
Plant type Low
(lb/acre)Representative value
(lb/acre)High
(lb/acre)Tree 1500 2500 4000 Grass/Grasslike 450 1200 2100 Forb 35 100 200 Shrub/Vine 20 100 150 Total 2005 3900 6450 Table 6. Soil surface cover
Tree basal cover 0% Shrub/vine/liana basal cover 0% Grass/grasslike basal cover 0-10% Forb basal cover 0-10% Non-vascular plants 0% Biological crusts 0% Litter 50-80% Surface fragments >0.25" and <=3" 10-60% Surface fragments >3" 0-20% Bedrock 0% Water 0% Bare ground 0-50% Table 7. Canopy structure (% cover)
Height Above Ground (ft) Tree Shrub/Vine Grass/
GrasslikeForb <0.5 – – 0-1% 0-2% >0.5 <= 1 – 0-1% 1-5% 1-5% >1 <= 2 – 0-2% 5-20% 1-10% >2 <= 4.5 – 0-5% 15-30% 0-10% >4.5 <= 13 0-2% 0-5% 0-5% 0-5% >13 <= 40 19-45% – – – >40 <= 80 1-10% – – – >80 <= 120 – – – – >120 – – – – Figure 9. Plant community growth curve (percent production by month). AZ4111 , 41.1 16-30. Growth begins in the spring, semi-dormancy occurs during the June drought, most growth occurs during the summer rainy season..
Jan Feb Mar Apr May Jun Jul Aug Sep Oct Nov Dec J F M A M J J A S O N D 0 0 0 5 10 0 15 45 20 5 0 0 State 2
Exotic grasses in under-storyCommunity 2.1
Exotic grasses in under-story
Figure 10. Sandy Wash, QUAR, QUEM 16-20" pz. Lehmann
This state occurs where exotic grasses like Lehmann, Boer, weeping lovegrass, bermuda, Johnson grass, and / or yellow bluestem has invaded from adjacent or up-stream areas with a seed source. As the non-native grasses increase to dominate the under-story, native perennial grasses and forbs are reduced to minor amounts. Fires will act to increase the dominance of Lehmann lovegrass in the under-story.
State 3
Shrub invadedCommunity 3.1
Shrub invaded
Figure 11. Sandy Wash, QUAR, QUEM 16-20" pz. juniper
This state occurs where mesquite and / or juniper species invade and increase in the absence of fire for long periods of time. These species can dominate the openings in the tree canopy with cover ranging from 5 to 30%. Fires can still burn after wet summers but these shrubs are well established and will sprout and quickly dominate the openings again.
State 4
Eroded channelCommunity 4.1
Eroded channelThis state occurs where watersheds are destabilized buy continuous grazing and / or the interaction of climate and severe fire. Large amounts of runoff and sediment are delivered to this site and cause gully and stream bank erosion. Channel erosion can deepen floodways and reduce flooding of the stream terraces. Sediment can clog channels causing new channels to cut through terraces; up-rooting trees and removing cover and woody debris.
Additional community tables
Table 8. Community 1.1 plant community composition
Group Common name Symbol Scientific name Annual production () Foliar cover (%) Table 9. Community 2.1 plant community composition
Group Common name Symbol Scientific name Annual production () Foliar cover (%) Table 10. Community 3.1 plant community composition
Group Common name Symbol Scientific name Annual production () Foliar cover (%) Table 11. Community 4.1 plant community composition
Group Common name Symbol Scientific name Annual production () Foliar cover (%) Interpretations
Animal community
The under-story plant community is suitable for grazing by all classes of livestock at any season. Use should be limited to 50% or less to leave enough under-story material to protect soils from erosion and to trap sediment during the spring and summer flooding seasons. Oak seedlings establish in late summer and fall from the preceding acorn crop. In years with high germination, deferment from grazing for the following winter and spring, followed by grazing in the summer will help establishment by selective grazing of grass to reduce competition with oak seedlings. Seasonal carrying capacities should be evaluated based upon on-site investigations as under-story varies greatly with percent of canopy cover and production can vary greatly from year to year depending on seasonality and frequency of flooding.
This is a very productive and widely used wildlife habitat. Excellent diversity and food, cover, edge with adjacent grasslands and seasonally available water make this site home to a great variety of wildlife species. Acorn production can be very high. Mature Emory oaks can produce up to 15,000 acorns per tree in a season and mature Arizona white oaks can produce double that amount.Hydrological functions
These sandy wash bottoms are extremely important for ground water recharge in upper basins along the mountain front. Deep, very coarse textured soils allow flood water and winter stream-flow to percolate to great depths.
Recreational uses
Camping, hunting, picnicking, bird watching, horseback riding, hiking, photography
Wood products
Net annual growth of oaks on this site averages about 1% of total volume. Heart-rot sets in on stems at 20+ years of age. If harvested on a 25-30 year rotation, production of coppice volume will be much higher (3% total volume) than yearly production of old age stands (due to lack of heart-rot). CMAI for coppice rotation on this site ranges from 5-15 ft3/ac/yr. These species take a long time to reach sexual maturity. Emory oak does not bear acorns until 40 yrs old. Arizona white oak does not bear acorns until 80 years old. Productivity declines rapidly after 160 years of age. The lifespan of these species are from 200-300 years. Dead limbs in mature stands range from 10-15% of total volume. Trees with 12-inch diameter stems are probably between 60-80 years old. Emory oak grows rapidly from 0-10 years, moderately 10-20 years and slowly 20 years on.
Equipment is limited by stony, cobbly soils, flooding that is common, and a high water table in winter.
Erosion potential is severe for water erosion during flooding.
Compaction potential and workability for roads is poor due to coarse textured, cobbly, stony soils. Rutting potential is low. Revegetation potential is good due to excellent climate.
Prescriptions for harvest cutting should be designed to allow for harvest of wood products and to preserve other values like wildlife, scenic, forage, and hydrologic. A 25-30 year rotation on coppice sprouts will maximize wood harvest. Initial volume reduction can be from 30-50% with a second harvest of 30-50% at 10-15 years and a third harvest on the older coppice sprouts which will average 20 ft with 8-10 inch diameters.
Thinning areas to 20% canopy will maximize forage production for livestock. Thinning to leave 10 feet between tree canopies will maximize wood production.
Prescribed burning in the cool season can reduce ladder fuels and freshen coarse forage species like sacaton and deergrass. Mechanical tree removal is severely limited due to wet soils caused by winter flooding. Control mistletoe to limit tree damage and loss. Coppice treatment at appropriate intervals to avoid loss of production to heart-rot fungus. Replanting is suitable for oak (summer and fall) and walnut (spring). Seed mortality has slight limitations due to coarse textured soils. Natural regeneration is good as long as natural flood regime is unaltered. Oak and walnut seedlings need protection from fire for 2-3 years to establish. Plant competition for tree seedlings is severe from grass and other herbaceous species. Prescribed grazing can reduce competition. Wind-throw hazard is slight.Other products
Acorns (bellotas) and walnuts for food. Medicinal herbs like yerba de pasmo, herbaceous sage and Hopi tea. Herbs for seasoning like wild oregano and terragon.
Supporting information
Inventory data references
Range 417s include 1 in good condition. Wood 5s include 1 at 35% canopy cover.
Type locality
Location 1: Cochise County, AZ Township/Range/Section T21s R19e S33 General legal description SW 1/4 of section - Ft. Huachuca at the mouth of Blacktail Canyon Location 2: Cochise County, AZ Township/Range/Section TT17S R28E S15 General legal description Willcox - Oak Ranch - Fivemile Creek Location 3: Pinal County, AZ Township/Range/Section T21S R18E S30 General legal description NE 1/4 of section - Tucson - Jelks Triangle M. Ranch - Post Canyon Contributors
Dan Robinett
Larry D. EllicottApproval
Curtis Talbot, 4/09/2021
Rangeland health reference sheet
Interpreting Indicators of Rangeland Health is a qualitative assessment protocol used to determine ecosystem condition based on benchmark characteristics described in the Reference Sheet. A suite of 17 (or more) indicators are typically considered in an assessment. The ecological site(s) representative of an assessment location must be known prior to applying the protocol and must be verified based on soils and climate. Current plant community cannot be used to identify the ecological site.
Author(s)/participant(s) Contact for lead author Date 06/30/2026 Approved by Approval date Composition (Indicators 10 and 12) based on Annual Production Indicators
-
Number and extent of rills:
-
Presence of water flow patterns:
-
Number and height of erosional pedestals or terracettes:
-
Bare ground from Ecological Site Description or other studies (rock, litter, lichen, moss, plant canopy are not bare ground):
-
Number of gullies and erosion associated with gullies:
-
Extent of wind scoured, blowouts and/or depositional areas:
-
Amount of litter movement (describe size and distance expected to travel):
-
Soil surface (top few mm) resistance to erosion (stability values are averages - most sites will show a range of values):
-
Soil surface structure and SOM content (include type of structure and A-horizon color and thickness):
-
Effect of community phase composition (relative proportion of different functional groups) and spatial distribution on infiltration and runoff:
-
Presence and thickness of compaction layer (usually none; describe soil profile features which may be mistaken for compaction on this site):
-
Functional/Structural Groups (list in order of descending dominance by above-ground annual-production or live foliar cover using symbols: >>, >, = to indicate much greater than, greater than, and equal to):
Dominant:
Sub-dominant:
Other:
Additional:
-
Amount of plant mortality and decadence (include which functional groups are expected to show mortality or decadence):
-
Average percent litter cover (%) and depth ( in):
-
Expected annual annual-production (this is TOTAL above-ground annual-production, not just forage annual-production):
-
Potential invasive (including noxious) species (native and non-native). List species which BOTH characterize degraded states and have the potential to become a dominant or co-dominant species on the ecological site if their future establishment and growth is not actively controlled by management interventions. Species that become dominant for only one to several years (e.g., short-term response to drought or wildfire) are not invasive plants. Note that unlike other indicators, we are describing what is NOT expected in the reference state for the ecological site:
-
Perennial plant reproductive capability:
Print Options
Sections
Font
AAAAOther
PrintThe Ecosystem Dynamics Interpretive Tool is an information system framework developed by the USDA-ARS Jornada Experimental Range, USDA Natural Resources Conservation Service, and New Mexico State University.
Accessibility statement