
Natural Resources
Conservation Service
Ecological site F039XA139AZ
Limestone/Sandstone Upland
17-22"
Last updated: 4/03/2020
Accessed: 10/02/2026
-
Search


Major Land Resource Area or ecological site by name and/or ID.
PreviousSectionsNextGeneral information
Provisional. A provisional ecological site description has undergone quality control and quality assurance review. It contains a working state and transition model and enough information to identify the ecological site.
MLRA notes
Major Land Resource Area (MLRA): 039X–Mogollon Transition North
MLRA CHARACTERISTICS-THESE ARE GENERAL STATEMENTS
AZ 39.1 Mogollon Plateau Coniferous Forests
Elevations range from 7000 to 12,500 feet and precipitation averages 20 to 35 inches per year. Vegetation includes ponderosa pine, Gambel oak, Arizona walnut, sycamore, Douglas fir, blue spruce, Arizona fescue, sheep fescue, mountain muhly, muttongrass, junegrass, pine dropseed, and dryland sedges. The soil temperature regime ranges from mesic to frigid and the soil moisture regime ranges from typic ustic to udic ustic. This unit occurs within the Colorado Plateau Physiographic Province and is characterized by a sequence of flat to gently dipping sedimentary rocks eroded into plateaus, valleys and deep canyons. Sedimentary rock classes dominate the plateau with volcanic fields occurring for the most part near its margin.
SITE FEATURES
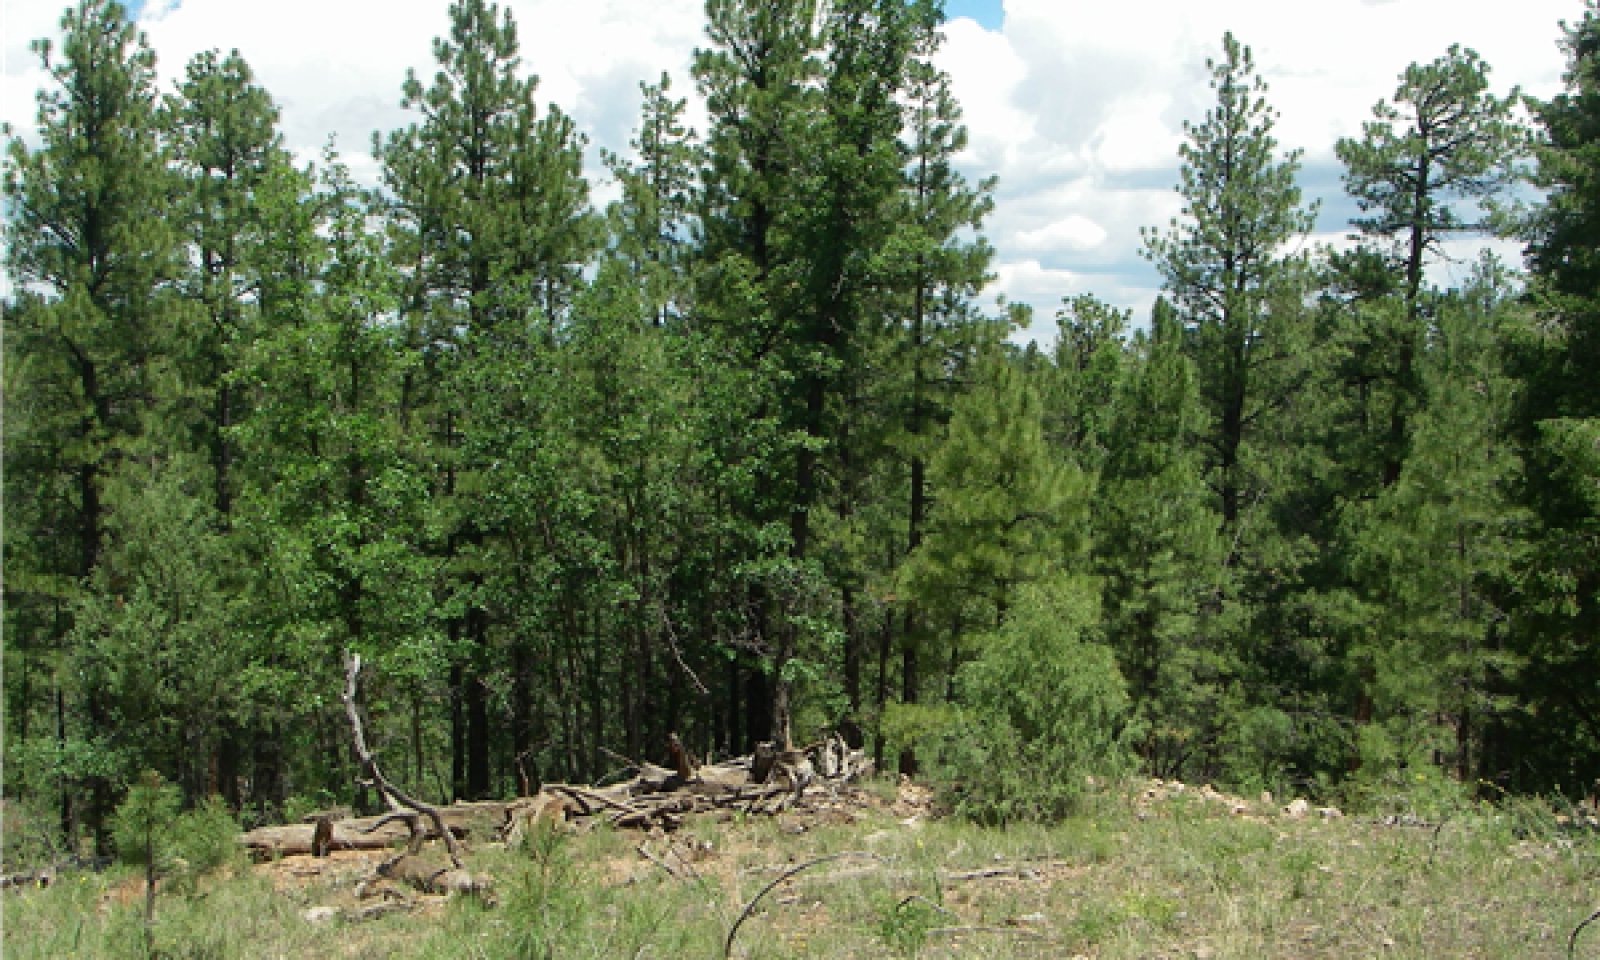
This site occurs in MLRA 39.1. The type location is near Flagstaff, Arizona on the Walnut Canyon National Monument. This site is dominated by Ponderosa Pine and Gambel Oak. The geology of this site is dominated by limestone with pockets of sandstone.
Associated sites
R035XG723AZ Limestone/Sandstone Upland (Pinyon-Juniper) 14-18" p.z.
R035XG724AZ Semi-Riparian Canyon Bottom 14-18" p.z.
R039XA140AZ Canyon Bottom (Riparian) 18-22" p.z.
Table 1. Dominant plant species
Tree (1) Pinus ponderosa
Shrub (1) Quercus gambelii
Herbaceous Not specified
Physiographic features
This area is dominated by heavily treed limestone benches. There are lesser areas of north-facing limestone escarpments on this site and small areas of sandstone intermixed on the limestone structural benches. The areas of sandstone are dominated by junipers whereas the surrounding limestone areas are dominated by Ponderosa pines.
Table 2. Representative physiographic features
Landforms (1) Structural bench
(2) Escarpment
Flooding frequency None Elevation 6000 – 7500 ft Slope 2 – 8 % Aspect Aspect is not a significant factor Climatic features
About 40% of the moisture in this Common Resource Area (CRA), or Land Resource Unit (LRU) comes as rain from June to September. The remainder comes from October to May as snow or light rain. Extreme temperatures of 97 and -37 degrees Fahrenheit have been recorded. Some moisture is usually received every month.
Table 3 Representative climatic features
Frost-free period (average) 120 days Freeze-free period (average) Precipitation total (average) 20 in BarLineFigure 1. Monthly precipitation range
BarLineFigure 2. Monthly average minimum and maximum temperature
">Influencing water features
No water features on this site
Soil features
Soil map units correlated for this site are on Walnut Canyon National Monument.
Map Units:
31 Chilson-Wilcoxin complex, 2 to 8 percent slopes, very rocky
32 Cosnino-Rock outcrop complex, 5 to 25 percent slopes
33 Cosnino-Rock outcrop complex, 25 to 70 percent slopesTable 4. Representative soil features
Parent material (1) Residuum – limestone and sandstone
Surface texture (1) Loam
Drainage class Well drained Permeability class Very slow to moderate Soil depth 15 in Surface fragment cover <=3" Not specified Surface fragment cover >3" Not specified Available water capacity
(0-40in)1.9 in Subsurface fragment volume <=3"
(Depth not specified)Not specified Subsurface fragment volume >3"
(Depth not specified)Not specified Ecological dynamics
This site is dominated by Ponderosa Pine with a Gambel Oak understory. Most of the site is greater than 25% tree canopy cover, with a mix of both cool and warm season grasses. Within the site, there are pockets of reddish sandstone, in which the vegetation changes to pinyon-juniper dominated with warm season grasses as understory. These are minor inclusions, and as mapping continues at a finer (larger) scale, this site may be able to be separated out on its own. At the scale of mapping, north-facing limestone escarpments have also been included in this site description. These escarpments may differ slightly in vegetation and have douglas-fir as a major tree component, with ponderosa pine and gambel oak as lesser (but still sub-dominant) components. These sites are dominantly north-facing and tend to be cooler with mixed cool and warm season grasses.
Model 1, State 1 is the dominant State in the ecological site, and any Reference Plant Production and Cover data is in reference to this State and Model. As more acreage of the lesser sites are documented, models 2 and 3 will be separated out into separate Ecological sites. At the scale mapped in the Walnut Canyon National Monument Survey, these areas are too intermingled with the dominant state to be separated.State and transition model
Custom diagramStandard diagram
Figure 3. Model
More interactive model formats are also available. View Interactive Models
More interactive model formats are also available. View Interactive Models
Click on state and transition labels to scroll to the respective textEcosystem states
State 1 submodel, plant communities
State 2 submodel, plant communities
State 1
Reference StateThis state is dominated by ponderosa pine, gambel oak and a mixture of both warm and cool season grasses
Community 1.1
Ponderosa Pine-Gambel Oak
Figure 4. Annual production by plant type (representative values) or group (midpoint values)
Table 5. Annual production by plant type
Plant type Low
(lb/acre)Representative value
(lb/acre)High
(lb/acre)Tree 0 223 443 Grass/Grasslike 19 100 260 Forb 0 58 115 Shrub/Vine 1 6 11 Total 20 387 829 Table 6. Soil surface cover
Tree basal cover 0-30% Shrub/vine/liana basal cover 30-60% Grass/grasslike basal cover 30-60% Forb basal cover 30-60% Non-vascular plants 0% Biological crusts 0% Litter 80-90% Surface fragments >0.25" and <=3" 0-10% Surface fragments >3" 0-10% Bedrock 0% Water 0% Bare ground 80-90% Community 1.2
Ponderosa Pine-Rocky mountain Juniper
State 2
Alternative StateThis site is dominated by ponderosa pine and gambel oak. This state has a decrease in native grasses due to disturbance and invasives may be here, such as Dalmation toadflax and locoweeds.
Community 2.1
Ponderosa Pine-Gambel Oak-Invasives
Additional community tables
Table 7. Community 1.1 plant community composition
Group Common name Symbol Scientific name Annual production () Foliar cover (%) Tree1 Trees 0–443 ponderosa pine PIPO Pinus ponderosa 4–443 – Gambel oak QUGA Quercus gambelii 64–175 – Rocky Mountain juniper JUSC2 Juniperus scopulorum 0–95 – Douglas-fir PSME Pseudotsuga menziesii 0–6 – Shrub/Vine2 Shrubs 0–15 Woods' rose ROWOU Rosa woodsii var. ultramontana 0–11 – broom snakeweed GUSA2 Gutierrezia sarothrae 0–2 – buckwheat ERIOG Eriogonum 0–1 – Forb3 0–500 Forb (herbaceous, not grass nor grass-like) 2FORB Forb (herbaceous, not grass nor grass-like) 0–115 – Grass/Grasslike4 Grass 19–139 mountain muhly MUMO Muhlenbergia montana 0–139 – muttongrass POFE Poa fendleriana 19–71 – blue grama BOGR2 Bouteloua gracilis 5–20 – Indian ricegrass ACHY Achnatherum hymenoides 0–10 – Canada wildrye ELCA4 Elymus canadensis 0–6 – squirreltail ELELB2 Elymus elymoides ssp. brevifolius 0–5 – prairie Junegrass KOMA Koeleria macrantha 0–3 – Table 8. Community 1.2 plant community composition
Group Common name Symbol Scientific name Annual production () Foliar cover (%) Table 9. Community 2.1 plant community composition
Group Common name Symbol Scientific name Annual production () Foliar cover (%) Interpretations
Supporting information
Type locality
Location 1: Coconino County, AZ UTM zone N UTM northing 3890539 UTM easting 451162 General legal description This Type Location is located on Walnut Canyon National Monument with restricted public access Contributors
Jennifer Puttere
Approval
Scott Woodall, 4/03/2020
Rangeland health reference sheet
Interpreting Indicators of Rangeland Health is a qualitative assessment protocol used to determine ecosystem condition based on benchmark characteristics described in the Reference Sheet. A suite of 17 (or more) indicators are typically considered in an assessment. The ecological site(s) representative of an assessment location must be known prior to applying the protocol and must be verified based on soils and climate. Current plant community cannot be used to identify the ecological site.
Author(s)/participant(s) Contact for lead author Date 10/02/2026 Approved by Approval date Composition (Indicators 10 and 12) based on Annual Production Indicators
-
Number and extent of rills:
-
Presence of water flow patterns:
-
Number and height of erosional pedestals or terracettes:
-
Bare ground from Ecological Site Description or other studies (rock, litter, lichen, moss, plant canopy are not bare ground):
-
Number of gullies and erosion associated with gullies:
-
Extent of wind scoured, blowouts and/or depositional areas:
-
Amount of litter movement (describe size and distance expected to travel):
-
Soil surface (top few mm) resistance to erosion (stability values are averages - most sites will show a range of values):
-
Soil surface structure and SOM content (include type of structure and A-horizon color and thickness):
-
Effect of community phase composition (relative proportion of different functional groups) and spatial distribution on infiltration and runoff:
-
Presence and thickness of compaction layer (usually none; describe soil profile features which may be mistaken for compaction on this site):
-
Functional/Structural Groups (list in order of descending dominance by above-ground annual-production or live foliar cover using symbols: >>, >, = to indicate much greater than, greater than, and equal to):
Dominant:
Sub-dominant:
Other:
Additional:
-
Amount of plant mortality and decadence (include which functional groups are expected to show mortality or decadence):
-
Average percent litter cover (%) and depth ( in):
-
Expected annual annual-production (this is TOTAL above-ground annual-production, not just forage annual-production):
-
Potential invasive (including noxious) species (native and non-native). List species which BOTH characterize degraded states and have the potential to become a dominant or co-dominant species on the ecological site if their future establishment and growth is not actively controlled by management interventions. Species that become dominant for only one to several years (e.g., short-term response to drought or wildfire) are not invasive plants. Note that unlike other indicators, we are describing what is NOT expected in the reference state for the ecological site:
-
Perennial plant reproductive capability:
Print Options
Sections
Font
AAAAOther
PrintThe Ecosystem Dynamics Interpretive Tool is an information system framework developed by the USDA-ARS Jornada Experimental Range, USDA Natural Resources Conservation Service, and New Mexico State University.
Accessibility statement


