
Natural Resources
Conservation Service
Ecological site R038XB213AZ
Volcanic Upland
16-20" p.z.
Last updated: 5/07/2020
Accessed: 10/03/2026
-
Search


Major Land Resource Area or ecological site by name and/or ID.
PreviousSectionsNextGeneral information
Provisional. A provisional ecological site description has undergone quality control and quality assurance review. It contains a working state and transition model and enough information to identify the ecological site.
MLRA notes
Major Land Resource Area (MLRA): 038X–Mogollon Transition South
AZ 38.2 - Middle Mogollon Transition
Elevations range from 4000 to 5500 feet and precipitation averages 16 to 20 inches per year. Vegetation includes turbinella oak, Wright silktassel, hollyleaf buckthorn, desert buckbrush, one-seed juniper, alligator juniper, pinyon, algerita, sugar sumac, prairie junegrass, blue grama, curly mesquite, bottlebrush squirreltail, muttongrass, cane beardgrass, plains lovegrass and bullgrass. The soil temperature regime ranges from thermic to mesic and the soil moisture regime is aridic ustic. This unit occurs within the Transition Zone Physiographic Province and is characterized by canyons and structural troughs or valleys. Igneous, metamorphic and sedimentary rock classes occur on rough mountainous terrain in association with less extensive sediment filled valleys exhibiting little integrated drainage.Associated sites
R038XB209AZ Loamy Upland 16-20" p.z.
R038XB215AZ Clayey Hills 16-20" p.z.
R038XB202AZ Clayey Upland 16-20" p.z.
R038XB203AZ Clay Loam Upland 16-20" p.z.
Similar sites
R038XB215AZ Clayey Hills 16-20" p.z.
Table 1. Dominant plant species
Tree Not specified
Shrub (1) Eriogonum wrightii
Herbaceous (1) Bouteloua curtipendula
(2) Bouteloua gracilisPhysiographic features
Table 2. Representative physiographic features
Landforms (1) Pediment
(2) Hill
Flooding frequency None Ponding frequency None Elevation 4200 – 6000 ft Slope 1 – 25 % Aspect N, E, S Climatic features
Precipitation in this common resource area averages 16 to 20 inches annually. The winter-summer rainfall ratio ranges from about 60/40% in the western part of the area to 45/55% in the eastern part. Summer rains fall July through September; and are from high-intensity, convective, thunderstorms. This moisture originates primarily from the Gulf of Mexico, but can come from the remnants of Pacific hurricanes in September. Winter moisture is frontal, originates in the north Pacific, and falls as rain or snow in widespread storms of low intensity and long duration. Snowfall ranges from 5 to 35 inches per year and can occur from November through April. Snow seldom persists for more than a week. May and June are the driest months of the year. Humidity is moderate to low all year. Average annual air temperatures range from 51 to 60 degrees F. The soil temperature regime is thermic. Daytime temperatures in the summer are commonly in the low 90’s. Freezing temperatures are common from October through April. The actual precipitation, available moisture and temperature vary, depending on, region, elevation, rain shadow effect and aspect.
Table 3 Representative climatic features
Frost-free period (average) 180 days Freeze-free period (average) 240 days Precipitation total (average) 20 in BarLineFigure 1. Monthly precipitation range
BarLineFigure 2. Monthly average minimum and maximum temperature
">Influencing water features
There are no water features associated with this site.
Soil features
The soil temperature regime is thermic. These soils are shallow (10 to 20 inches) and dark colored. They are clayey throughout (smectitic) and well drained. They have formed in residuum and slope alluvium from basalt, andesite, related volcanic tuffs and ash. The surface textures are clayloam to silty clay. Surfaces are well covered by dark colored; gravels, cobbles and stones. The effective rooting depth is limited by hard bedrock at 10 to 20 inches. Runoff is very high on moist soils. The erosion hazard is slight due to gravel, cobble and rock covers. Soils mapped under this site include: SSA675 San Carlos IR area MU's 23, 25, 45 Kuykendall.
Table 4. Representative soil features
Parent material (1) Residuum – andesite
(2) Alluvium – basalt
Surface texture (1) Gravelly clay loam
(2) Gravelly sandy loam
(3) Silty clay
Family particle size (1) Clayey
Drainage class Well drained Permeability class Slow to very slow Soil depth 4 – 20 in Surface fragment cover <=3" 10 – 20 % Surface fragment cover >3" 10 – 15 % Available water capacity
(0-40in)1.1 – 2.2 in Calcium carbonate equivalent
(0-40in)Not specified Electrical conductivity
(0-40in)0 – 2 mmhos/cm Sodium adsorption ratio
(0-40in)0 – 2 Soil reaction (1:1 water)
(0-40in)7.2 – 7.6 Subsurface fragment volume <=3"
(Depth not specified)0 – 35 % Subsurface fragment volume >3"
(Depth not specified)0 – 35 % Ecological dynamics
The plant communities found on an ecological site are naturally variable. Composition and production will vary with yearly conditions, location, aspect, and the natural variability of the soils. The historical climax plant community represents the natural potential plant communities found on relict or relatively undisturbed sites. Other plant communities described here represent plant communities that are known to occur when the site is disturbed by factors such as grazing, fire, or drought.
Production data provided in this site description is standardized to air-dry weight at the end of the summer growing season. The plant communities described in this site description are based on near normal rainfall years.
NRCS uses a Similarity Index to compare existing plant communities to the plant communities described here. Similarity Index is determined by comparing the production and composition of a plant community to the production and composition of a plant community described in this site description. To determine Similarity Index, compare the production (air-dry weight) of each species to that shown in the plant community description. For each species, count no more than the maximum amount shown for the species, and for each group, count no more than the maximum shown for the group. Divide the resulting total by the total normal year production shown in the plant community description. If rainfall has been significantly above or below normal, use the total production shown for above or below normal years. If field data is not collected at the end of the summer growing season, then the field data must be corrected to the end of the year production before comparing it to the site description. The growth curve can be used as a guide for estimating production at the end of the summer growing season.State and transition model
Custom diagramStandard diagram
Figure 3. STM
More interactive model formats are also available. View Interactive Models
More interactive model formats are also available. View Interactive Models
Click on state and transition labels to scroll to the respective textState 1 submodel, plant communities
State 2 submodel, plant communities
State 3 submodel, plant communities
State 4 submodel, plant communities
State 1
Mid grass StateThe historic climax plant community (HCPC) description was derived from a literature review and assessment of historic photos by The Nature Conservancy (Historical Range of Variation for Potential Natural Vegetation Types of the Southwest,June 2007,TNC). The best potential natural vegetation for this ecological site was sampled for point data to describe the reference community. This reference plant community can be described as belonging to the vegetation grouping by TNC as the mixed native grass type of the semi-desert grassland grouping. Within this type, the species composition varies greatly with soil type and topography. Historically, this vegetation type was found to be an open grassland with low shrub canopy cover (
Community 1.1
Reference Plant Community
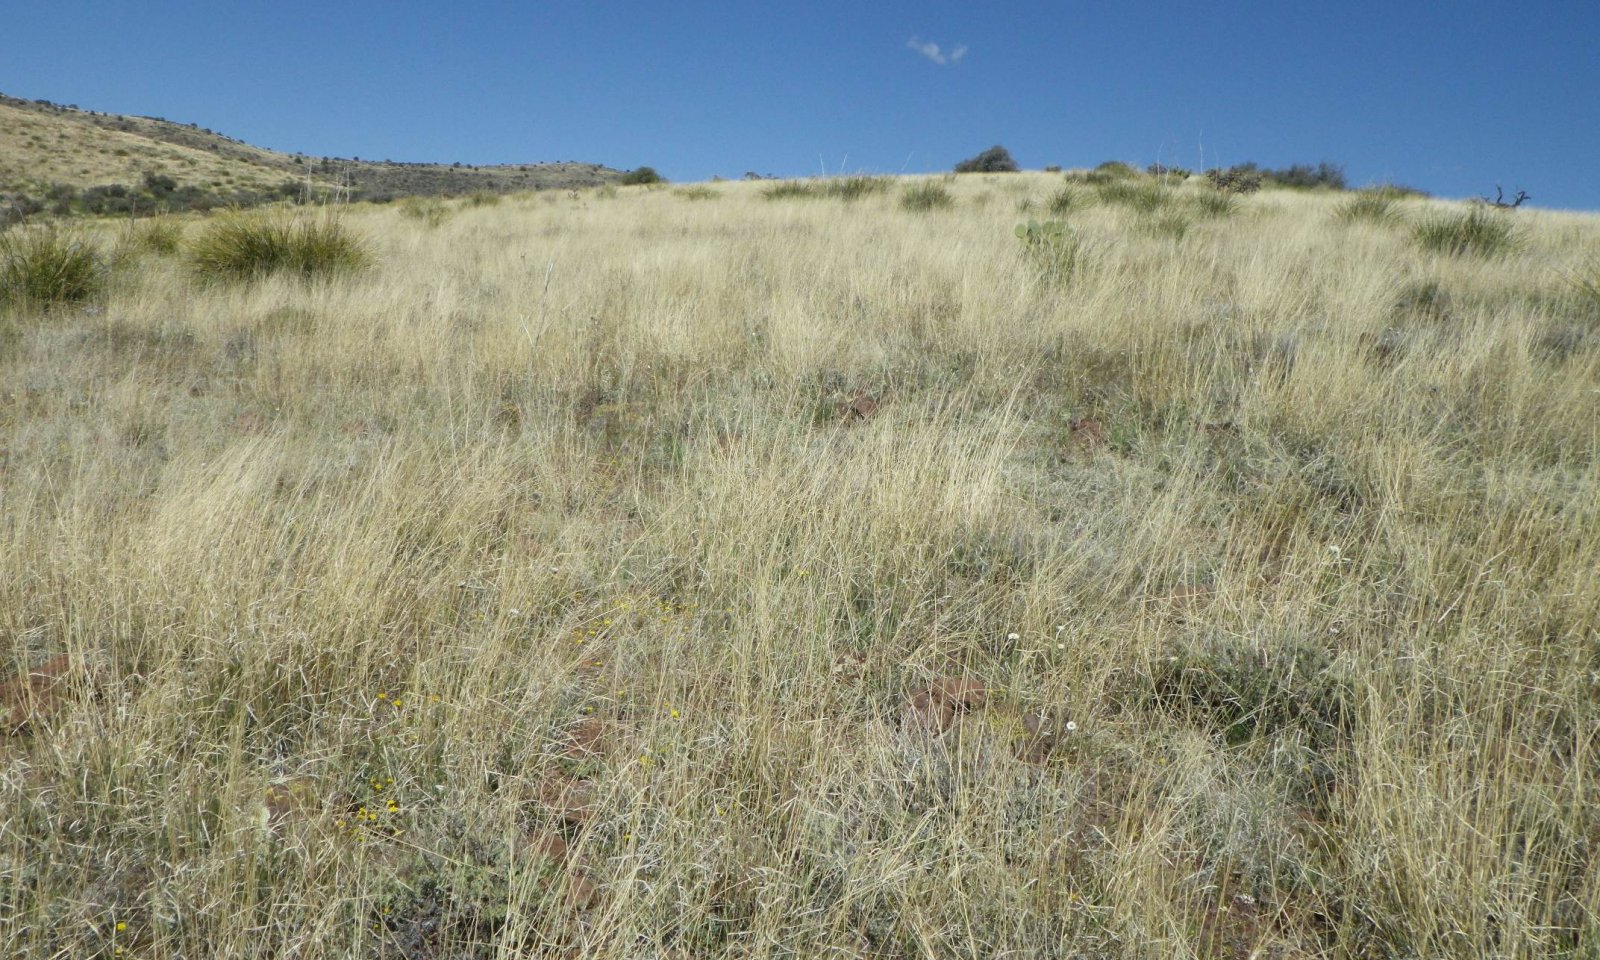
The Midgrass State is the Reference Plant community. It is a warm season dominated grassland (canopy cover of 60-85%) with an important component of cool season grasses that fluctuate with climate. Cool and warm season annual grasses and forbs are well represented in the flora and fluctuate with annual precipitation. Half shrubs and perennial forbs are also an important group. The reference sites are typically high in foliar cover (85-95%), dominated by perennial grasses (65-85%), of which side-oats grama was dominant (35-60% cover) with blue grama subdominant (8-25%). Basal cover by perennial grasses covered 5-10% of the ground with rock fairly high (30-35%) and litter cover very high (50-60%).
Fire return intervals are difficult to determine in non-woody plant communities, but likely occurred every 10-15 years maintaining a grassland versus a shrubland. The interactions of drought, fire and grazing can result in a loss of perennial grass cover.Figure 4. Annual production by plant type (representative values) or group (midpoint values)
Table 5. Annual production by plant type
Plant type Low
(lb/acre)Representative value
(lb/acre)High
(lb/acre)Grass/Grasslike 730 1200 1500 Shrub/Vine 100 200 400 Forb 0 150 400 Tree 5 8 10 Total 835 1558 2310 Table 6. Soil surface cover
Tree basal cover 0-0% Shrub/vine/liana basal cover 0-0% Grass/grasslike basal cover 10-10% Forb basal cover 0-0% Non-vascular plants 0% Biological crusts 0% Litter 50-70% Surface fragments >0.25" and <=3" 10-20% Surface fragments >3" 10-20% Bedrock 0-10% Water 0% Bare ground 0-10% Table 7. Canopy structure (% cover)
Height Above Ground (ft) Tree Shrub/Vine Grass/
GrasslikeForb <0.5 – 0-5% 5-20% 15-35% >0.5 <= 1 – 0-5% 10-25% 1-5% >1 <= 2 – 0-1% 15-60% 0-1% >2 <= 4.5 – 0-1% 1-5% – >4.5 <= 13 0-1% 0-1% – – >13 <= 40 0-1% – – – >40 <= 80 – – – – >80 <= 120 – – – – >120 – – – – Figure 5. Plant community growth curve (percent production by month). AZ3812 , 38.2 16-20" p.z. all sites. Growth begins in the spring and continues into the summer and fall..
Jan Feb Mar Apr May Jun Jul Aug Sep Oct Nov Dec J F M A M J J A S O N D 0 5 5 15 10 10 15 20 10 5 5 0 Community 1.2
Midgrass/Snakeweed CommunityBroom snakeweed can increase in abundance over time with favorable precipitation. It has been shown that broom snakeweed has greater access to and more rapid utilization of deeper soil water relative to side oats grama(Yoder, C.K.; Boutton, T.W., 1998). This may help explain broom snakeweed invasion in this grassland. This can have a slight deleterious effect on herbaceous production but does not prohibit this site from burning.
Pathway 1.1a
Community 1.1 to 1.2Favorable precipitation can increase germination of broom snakeweed on the site.
Pathway 1.2a
Community 1.2 to 1.1Broom snakeweed germination and survival can decrease with unfavorable precipitation over longer periods of time and/or natural fire kills broom snakeweed plants.
State 2
Short grass StateThe reference state transitions to the short grass state because blue grama can withstand heavy grazing pressure and drought (Sims, P. L.; Dahl, B. E.; Denham, A. H. 1976). Therefore, if these conditions occur, blue grama can outcompete, and dominant in the side oats grama reference grasslands. Blue grama can also grow in argillic horizons which would become evident if there is a loss of topsoil from erosion. The soil associated with this ecosite is clayey throughout (smectitic) and well drained. A study that looked at soil heterogeneity and distribution of plant species, showed through multivariate analysis, that Blue grama dominated in areas where Holocene surface deposits are deepest and the argillic (clay rich) B horizon is thickest (Buxbaum, Vanderbilt 2007). Therefore, if there are decreases in basal cover of side oats grama and decreases in top soil or A horizon, blue grama can outcompete side oats grama for dominance. It has fair tolerance to fire when dormant but experiences some damage if burned during active growth especially during drought (Owensby, Clenton E. 1970).
Community 2.1
Blue grama Community
There are various methods for reducing blue grama cover in areas that include chemical applications, salt applications and contour ripping. Chemicals such as atrazine, triclopyr, and picloram have been used to initially thin dense blue grama stands (Gesink, R. W.; Alley, H. P.; Lee, G. A. 1973). There is variable long-term response to chemical applications with blue grama recovering vigorously within 5 years of picloram application and long term negative effects on soil processes with atrazine. Blue grama has been shown to be intolerant of salt, tending to have a shallow root system that avoids soil salinity (Miyamoto, S. 1978). Miyamoto found that salt solution applications decreased blue grama germination and vegetative growth. Contour ripping may reduce cover of blue grama because of the way it recovers differentially to disturbance depending on size and proximity to seed source (Griffith, L. W.; Schuman, G. E.; Rauzi, F.; Baumgartner, R. E. 1984). In small disturbance patches, blue grama recovers through tiller replacement from the damaged plant. In large disturbance areas, recolonization is through seedling establishment. As a result, these larger disturbances not only reduce cover but also kill individual plants. Recovery of blue grama on disturbed sites may be constrained by soil texture, climatic factors, and seed production and availability, as well as by type and intensity of disturbance (Coffin, Debra P.; Lauenroth, William K. 1994;Coffin, Debra P.; Lauenroth, William K.; Burke, Ingrid C. 1996; Coffin, Debra P.; Laycock, William A.; Lauenroth, William K. 1998).
Community 2.2
Curly MesquiteAt lower elevations near the LRU boundaries the short grass state can be dominated by curly mesquite (Hilaria belangeri).
State 3
Shrub StateDrought, missed fire cycles and mismanaged grazing can increase shrubs and trees in areas leading to the altered states (shrub state, treed state)(Gori and Enquist 2003). Wet winters after periods of drought have also shown to convert grasslands to shrublands (Barton and other 2001; Grissino-Mayer and Swetnam 1997; Miller and Rose 1999; Swetnam and Betancourt 1998). The threshold that converts the reference state to the altered shrub or tree state is 35% shrub cover or 15% tree cover. The loss of perennial grass basal cover in converting to shrublands, generally increases bare ground cover thereby leading to higher exposure to wind and water erosion (Gori and Enquist 2003; Whitford 2002). This exposure to wind and water erosion can lead to losses in top soil and A horizons which would make re-colonization by grasses or at least the original species present, difficult even if shrub cover is decreased. The soil that is associated with this ecosite has a surface that is well covered by gravel, cobble and rock which protects from wind and water erosion. Therefore, many stressors have to occur synergistically to alter a community from the reference state to an altered state. In our model, we consider Nolina and Cholla species as acting as shrubs in succession. Nolina has been associated with disturbance, specifically as a “fire-caused subclimax” community ((Humphrey, R. R. 1958. 24: 193-253). Humphrey, Robert R. 1958. 61 p). It is also associated with heavy grazing and erosion, specifically in blue grama grasslands but presumably in side oats grama as well. Nolina reproduces sexually through seed production and asexually by sprouting (Curtin, Charles G. 2003). Nolina is typically only top-killed by fire, though burned plants are generally smaller and coverage and density are lower than unburned areas. It sprouts from the caudex following fire, whereas postfire seedling establishment was not reported. It has a root depth at a minimum of 50 cm, has a low salinity tolerance and a soil pH range from 6.5-9.5. Species of cholla can be heavy invaders of areas with exposed soil in which stem joints can take root in vegetative reproduction. It has been shown that “waves of invasion” typically occur four or five years after drought combined with grazing. Animals defecate seeds and carry stem joints stuck in their hide (Kunst, Carlos Roberto Guillermo 1990).
Community 3.1
Cholla Community
Cholla species has increased to dominate the site due to absence of natural fire.
Community 3.2
Nolina Community
Nolina can increase to dominate this site over time with the absence of natural fire. Restoration pathway from this state is unknown and likely undesireable due to cultural use of Nolina plant material.
State 4
Treed StateStudies have shown juniper species to invade neighboring grasslands (Ffolliott, Peter F.; Gottfried, Gerald J.;1992). Juniper species may invade this grassland and alter the community to one with 15-35% cover of trees and shrubs with only 10-20% cover of perennial grasses. Disruption in the natural fire cycle would allow Juniper species to invade grassland areas that have already been stressed by other disturbances such as drought or unmanaged grazing.
Community 4.1
Juniper species-shrub Community

Trees of either or both juniper and pinyon species have established. These trees occur with shrubs in the absence of fire to total canopy levels of 35-45%. Herbaceous production ranges 100-200 #/acre and canopy cover ranges from 10 to 20%.
Transition 1a
State 1 to 2Drought and continuous high intensity grazing with no summer deferment has decreased the cover of side-oats grama and transitioned the community to one dominated by blue grama.
Transition 1b
State 1 to 3The midgrass reference community can transition to a shrub dominated state with a decrease in the natural fire return interval, unmanaged grazing or drought.
Transition 1c
State 1 to 4Juniper species with an understory of shrubs has increased in the absence of fire to dominate the site.
Restoration pathway 2a
State 2 to 1Large scale restoration from this state is unknown. Contour ripping to break up the dominance of blue grama and allow other species to come in has been successful in blue grama dominated plant communities in central New Mexico (Pat Shaver, pers. comm.) and squirreltail is only observed in areas where pipelines have been ripped through blue grama communities north of Springerville, AZ. Contour ripping followed by range planting according to n NRCS Conservation Practice Specification developed by the local NRCS Field Office.
Restoration pathway 3a
State 3 to 1To achieve this restoration pathway, a remnant seed source or range planting, must occur. Cholla cover can be decreased by mechanical brush management. This form of management may be useful only in the short term though (Rocky Mtn. Forest and Range Exp. Stn. Annual Report 1968, pg. 37). Cholla can spread through vegetative reproduction and increased grazing pressure may add to active dispersal (Allen, L.J., Journal of ecology,1991,79(4), 1123-1135). natural or prescribed fire 3-5 years post treatment to facilitate killing of cholla regeneration followed by natural fire return internal of 10-15 years could also be applied.
Restoration pathway 4a
State 4 to 1Mechanical brush management can be applied followed by burning of skeletons if sufficient fine fuels are on site. Perennial grass canopy in the interspaces of trees can likely provide an adequate seed source for restoration following brush management or fires. Range planting should likely only be considered where perennial grass canopy in the interspaces of trees is less than 25%; however this threshold needs additional investigation.
Additional community tables
Table 8. Community 1.1 plant community composition
Group Common name Symbol Scientific name Annual production () Foliar cover (%) Grass/Grasslike1 Mid Grass 170–1253 sideoats grama BOCU Bouteloua curtipendula 170–1250 35–60 cane bluestem BOBA3 Bothriochloa barbinodis 0–1250 – blue grama BOGR2 Bouteloua gracilis 0–100 – plains lovegrass ERIN Eragrostis intermedia 0–1 – green sprangletop LEDU Leptochloa dubia 0–1 – 2 Cool Season Grasses 1–37 squirreltail ELEL5 Elymus elymoides 1–35 – prairie Junegrass KOMA Koeleria macrantha 0–1 – muttongrass POFE Poa fendleriana 0–1 – 3 Miscellaneous Perennial Grasses 0–300 hairy grama BOHI2 Bouteloua hirsuta 0–150 – purple grama BORA Bouteloua radicosa 0–150 – common wolfstail LYPH Lycurus phleoides 0–100 – spidergrass ARTE3 Aristida ternipes 0–50 – tobosagrass PLMU3 Pleuraphis mutica 0–25 – 4 0–50 sixweeks threeawn ARAD Aristida adscensionis 0–5 – little barley HOPU Hordeum pusillum 0–5 – Forb5 Perennial Forbs 0–107 milkvetch ASTRA Astragalus 0–100 – sego lily CANU3 Calochortus nuttallii 0–1 – Indian paintbrush CASTI2 Castilleja 0–1 – New Mexico thistle CINE Cirsium neomexicanum 0–1 – bluedicks DICA14 Dichelostemma capitatum 0–1 – desert globemallow SPAM2 Sphaeralcea ambigua 0–1 – vervain VERBE Verbena 0–1 – white sagebrush ARLU Artemisia ludoviciana 0–1 – 6 Annual Forbs 0–50 false springparsley PSEUD4 Pseudocymopterus 0–3 – sleepy silene SIAN2 Silene antirrhina 0–1 – hedgemustard SISYM Sisymbrium 0–1 – whitetip clover TRVA Trifolium variegatum 0–1 – madwort ALYSS Alyssum 0–1 – cryptantha CRYPT Cryptantha 0–1 – wild carrot DAUCU Daucus 0–1 – longleaf false goldeneye HELOA2 Heliomeris longifolia var. annua 0–1 – whitedaisy tidytips LAGL5 Layia glandulosa 0–1 – trefoil LOTUS Lotus 0–1 – Arizona lupine LUAR4 Lupinus arizonicus 0–1 – desert Indianwheat PLOV Plantago ovata 0–1 – Shrub/Vine7 Succulents 0–4 sacahuista NOMI Nolina microcarpa 0–80 – walkingstick cactus CYSP8 Cylindropuntia spinosior 0–80 – Engelmann's hedgehog cactus ECEN Echinocereus engelmannii 0–2 – cactus apple OPEN3 Opuntia engelmannii 0–1 – 8 Increaser half-shrubs 0–160 bastardsage ERWR Eriogonum wrightii 0–150 – broom snakeweed GUSA2 Gutierrezia sarothrae 0–10 – Tree9 Trees 0–50 oneseed juniper JUMO Juniperus monosperma 0–50 – singleleaf pinyon PIMO Pinus monophylla 0–50 – Table 9. Community 1.2 plant community composition
Group Common name Symbol Scientific name Annual production () Foliar cover (%) Table 10. Community 2.1 plant community composition
Group Common name Symbol Scientific name Annual production () Foliar cover (%) Table 11. Community 2.2 plant community composition
Group Common name Symbol Scientific name Annual production () Foliar cover (%) Table 12. Community 3.1 plant community composition
Group Common name Symbol Scientific name Annual production () Foliar cover (%) Table 13. Community 3.2 plant community composition
Group Common name Symbol Scientific name Annual production () Foliar cover (%) Table 14. Community 4.1 plant community composition
Group Common name Symbol Scientific name Annual production () Foliar cover (%) Interpretations
Animal community
This site is suitable for grazing and is easily traversed by all classes of livestock, except in areas where cobbles heavily cover the ground surface. It is suitable for year round grazing. This site has good habitat diversity for grassland wildlife species.
Hydrological functions
This site has high basal cover of perennial bunch grasses that maintain short water flow paths and relatively high infiltration. As this site is used by wildlife and livestock at higher degrees blue grama becomes the dominant species at most locations. If blue grama is maintained as a vigorous bunchgrass it provides a good level of infiltration on the site. As the vigor of blue grama further decreases at high levels of wildlife and livestock utilization and becomes a sod grass runoff can become significant but the grass can still provide a fair degree of soil protection and pedestalling is not very extensive.
Runoff is very high on moist soils and erosion hazard is slight due to significant rock cover on the soil surface. Hydrologic function for the reference site and altered states was evaluated using the RHEM (Rangeland Hydrology and Erosion Model) from SWRC (Southwest Watershed Research Center). All states were evaluated for the range in variability found for the soil component including slope ranges 3% vs. 15%, slope shape ranges linear vs. convex, soil texture silty clay vs. clay loam. Input parameters were averaged from point data and included dominant vegetation life form, foliar, basal, rock, litter and cryptogram cover.
Results show that the Nolina State had the lowest yearly average runoff (1.36-2.08mm/yr.) and soil loss/sediment yield (0.004-0.005 ton/ha/yr) with soil texture of clay loam lower than silty clay. The reference sites had runoff and soil loss/sediment yield values spanning 2.6-3.8mm/yr (clay loam vs. silty clay) with soil loss 0.018-0.02 ton/ha/yr). The cholla state had runoff values with clay loam texture lower than silty clay (3.4-4.84mm/yr) with soil loss 0.01-0.013 ton/ha/yr. The highest runoff and soil loss values were seen in the short grass state, which when evaluated as dominantly annual grass/forbs (total foliar cover was 83.5%) were runoff values of 8.59-10.34mm/yr for silty clay. When evaluated only with the bunch grass cover (33.5%,significantly lower than the total foliar cover), that value rose to 16.89-19.67mm/yr.
Recreational uses
Hunting, camping, horseback riding, backpacking, rock hounding, photography.
Wood products
There are no significant wood products produced on this site.
Other products
There is some native harvest of fool plants like wild onions, grassnuts and thistle. Beargrass for textile making.
Supporting information
Inventory data references
Bahre, C.J. (1985) Wildfire in southeastern Arizona between 1859 and 1890. Desert Plants, 7, 190-194. Barton, A.M., Swetnam, T.W. & Baisan, C.H. (2001) Arizona pine (Pinus arizonica) stand dynamics: local and regional factors in a fire-prone madrean gallery forest of southeast Arizona, USA. Landscape Ecology, 16, 351-369. Bock, C.E. & Bock, J.H. (1997) Shrub densities in relation to fire, livestock grazing, and precipitation in an arizona desert grassland. The Southwestern Naturalist, 42, 188-193. Bock, J.H. & Bock, C.E. (1992) Short-term reduction in plant densities following prescribed fire in an ungrazed semidesert shrub-grassland. The Southwestern Naturalist, 37, 49-53. Brown, J. H., Valone, T. J., and Curtin, C. G. Reorganization of an arid ecosystem in response to recent climate change. Proceedings of the National Academy of Science USA 94, 9729-9733. 1997. Cable, Dwight R. Fire effects in southwestern semidesert grass-shrub communities. Annual Tall Timbers Fire Ecology Conference; Jun 8-9, 1972. 109-127. 1973. Tallahassee, FL, Tall Timbers Research Station. Campbell, R.S. and E. H. Bomberger. 1934. The occurrence of Gutierreza sarothrae on Bouteloua eriopoda ranges in southern New Mexico. Ecology 15:49-61. Coffin, Debra P.; Lauenroth, William K. 1994. Successional dynamics of a semiarid grassland: effects of soil texture and disturbance size. Vegetation. 110(1): 67-82. [23088] Coffin, Debra P.; Lauenroth, William K.; Burke, Ingrid C. 1996. Recovery of vegetation in a semiarid grassland 53 years after disturbance. Ecological Applications. 6(2): 538-555. [28426] Coffin, Debra P.; Laycock, William A.; Lauenroth, William K. 1998. Disturbance intensity and above- and belowground herbivory effects on long-term (14 y) recovery of a semiarid grassland. Plant Ecology. 139(2): 221-233. [34885] Curtin, Charles G. 2003. Fire as a landscape restoration and management tool in the Malpai Borderlands. In: Galley, Krista E. M.; Klinger, Robert C.; Sugihara, Neil G., eds. Proceedings of fire conference 2000: the 1st national congress on fire ecology, prevention, and management; 2000 November 27-December 1; San Diego, CA. Miscellaneous Publication No. 13. Tallahassee, FL: Tall Timbers Research Station: 79-87. [51381]. Evans, Raymond A. 1988. Management of pinyon-juniper woodlands. Gen. Tech. Rep. INT-249. Ogden, UT: U.S. Department of Agriculture, Forest Service, Intermountain Research Station. 34 p. [4541] Ffolliott, Peter F.; Gottfried, Gerald J.; Bennett, Duane A.; [and others], technical coordinators. Ecology and management of oaks and associated woodlands: perspectives in the sw United States & n Mexico: Proceedings; 1992 April 27-30; Sierra Vista, AZ. Gen. Tech. Rep. RM-218. Fort Collins, CO: U.S. Department of Agriculture, Forest Service, Rocky Mountain Forest and Range Experiment Station: 78-86. [19745] Gesink, R. W.; Alley, H. P.; Lee, G. A. 1973. Vegetative response to chemical control of broom snakeweed on a blue grama range. Journal of Range Management. 26(2): 139-143. [1011]. Gori, David F. and Enquist, Carolyn A. F. An assessment of the spatial extent and condition of grasslands in central and southern Arizona, southwestern New Mexico and northern Mexico. 2003. The Nature Conservancy, Arizona Chapter. Gosz, R.J. & Gosz, J.R. (1996) Species interactions on the biome transition zone in New Mexico: response of blue grama (Bouteloua gracilis) and black grama (Bouteloua eriopoda) to fire and herbivory. Journal of Arid Environments, 34, 101-114. Griffith, L. W.; Schuman, G. E.; Rauzi, F.; Baumgartner, R. E. 1984. Mechanical renovation of shortgrass prairie for increased herbage production. Journal of Range Management. 38(1): 7-10. [35468]. Grissino-Mayer, H.D. & Swetnam, T.W. (1997) Multi-century history of wildfire in the ponderosa pine forests of EL Malpais National Monument. New Mexico Bureau of Mines & Mineral Resources Bulletin, 156, 163-171. Humphrey, R.R. (1949) Fire as a means of controlling velvet mesquite, burroweed, and cholla on southern Arizona ranges. Journal of Range Management, 2, 175-182. Humphrey, Robert R. 1958. The desert grassland: A history of vegetational change and an analysis of causes. Bull. 299. Tucson, AZ: University of Arizona, Agricultural Experiment Station. 61 p. [5270]. Jameson, D.A. 1966. Competition in a blue grama-broom snakeweed community and responses to selective herbicides. Jounal of Range Management. 19:121-124. Kaib, Mark, Baisan, Christopher, Grissino-Mayer, Henri D., and Swetnam, Thomas W. Fire history of the Gallery pine-oak forests and adjacent grasslands of the Chiracahua Mountains of Arizona. Ffolliott, Peter F., DeBano, Leonard F., Baker, Malchus B., Gottfried, Gerald J., Solis-Garza, Gilberto Edminster Carleton B., Neary, Daniel G., Allen, Larry S., and Hamre, R. H. Effects of Fire on Madrean Province Ecosystems - A symposium proceedings. March 11-15, 1996; Tucson AZ. General Technical Report. RM-GTR-289. December, 1996. Fort Collins, Colorado, United States Department of Agriculture. Kunst, Carlos Roberto Guillermo (1990). "Some autoecological aspects of Opuntia imbricata (Haw.) D.C. (cholla)" (title page of Ph. D. dissertation). Texas Tech University. Retrieved on 2009-08-15. Martin, S.C. (1983) Responses of semidesert grasses and shrubs to fall burning. Journal of Range Management, 36, 604-610. McAuliff, J.R. (1995) Landscape evolution, soil formation, and Arizona's desert grasslands. The desert grassland (McClaran, Mitchel P. and Van Devender, Tom R.), pp. 100-129. University of Arizona Press, Tucson, Arizona. McClaran, Mithcel P. A century of change on the Santa Rita Experimental Range. McClaran, Mithcel P. Santa Rita Experimental Range: 100 years (1903 to 2003) of accomplishments and contributions. RMRS-P-30. September 2003. Ogden, Utah, Ogden, Utah. McPherson, G.R. (1995) The role of fire in the desert grasslands. The Desert Grassland (McClaran, M. P. and Van Devender, T. R.), University of Arizona Press, Tucson, AZ. Miller, R.F. & Rose, J.A. (1999) Fire history and western juniper encroachment in sagebrush steppe. Journal of Range Management, 52, 550-559. 14-20 Miyamoto, S. 1978. Tolerance of some southwestern range plants to sodium chloride and sulfate. PR-3480. College Station, TX: Texas A&M University, Texas Agricultural Experiment Station. 8 p. [35552]. Owensby, Clenton E. 1970. Burning bluestem range. Journal of Range Management. 23: 81-92. [323]. Reynolds, H.G. & Bohning, J.W. (1956) Effects of burning on a desert grass-shrub range in southern Arizona. Ecology, 37, 769-777. Robinett, D. (1994) Fire effects on southeastern Arizona plains grasslands. Rangelands, 16, 143-148. Sims, P. L.; Dahl, B. E.; Denham, A. H. 1976. Vegetation and livestock response at three grazing intensities on sandhill rangeland in eastern Colorado. Technical Bulletin No. 130. Fort Collins, CO: Colorado State University, Agricultural Experiment Station. 48 p. [5415] Swetnam, T.W. & Betancourt, J.L. (1998) Mesoscale disturbance and ecological response to decadal climatic variability in the American Southwest. Journal of Climate, 11 , 3128-3147. Valone, T.J. & Kelt, D.A. (1999) Fire and grazing in a shrub-invaded arid grassland community: independent of interactive ecological effects? Journal of Arid Environments, 42, 15-28. Weaver, J.E. 1920. Root development in the grassland formation. Carnegie Institution of Washington Publication no. 292. Washington D.C. Whitford, Walter G. Ecology of Desert Systems. 2002. San Diego, CA, Academic Press. Whitford, W.G., Forbes, G.S. & Kerley, G.I. (1995) Diversity, spatial variability, and functional rolesof invertebrates in desert grassland ecosystems. The desert grassland (McClaran, M. P. and Van Devender, T. R.), pp. 152-195. University of Arizona Press, Tucson, Arizona. Wright, R.A. (1980) Increase of mesquite on a southern New Mexico desert grassland range. New Mexico State University. Yoder, c.K.; Boutton, T.W.;Thurow, T.L.; Midwood, A.J., Journal of range management, 1998, 51(2),200-206.
Contributors
Dan Robinett
Larry D. Ellicott
Stephanie Shoemaker
Stephanie Shoemaker, Dave WomackApproval
Scott Woodall, 5/07/2020
Rangeland health reference sheet
Interpreting Indicators of Rangeland Health is a qualitative assessment protocol used to determine ecosystem condition based on benchmark characteristics described in the Reference Sheet. A suite of 17 (or more) indicators are typically considered in an assessment. The ecological site(s) representative of an assessment location must be known prior to applying the protocol and must be verified based on soils and climate. Current plant community cannot be used to identify the ecological site.
Author(s)/participant(s) Stephanie Shoemaker; Dave Womack; Emilio Carillo Contact for lead author Date 04/18/2012 Approved by Approval date Composition (Indicators 10 and 12) based on Annual Production Indicators
-
Number and extent of rills:
None present on the site. Perennial grass basal cover is 5-10%, dominated by bunchgrass that promote infiltration and break up water flow, thereby reducing its energy and ability to produce rills on the site. -
Presence of water flow patterns:
Water flow paths are less than 12 inches in length before encountering plant bases. Perennial grass basal area is 5-10%, dominated by bunchgrasses that break up water flow paths. -
Number and height of erosional pedestals or terracettes:
None present on the site. High foliar cover of plants 87-95%, mostly perennials 64-86% cover with significant basal cover 5-10% and very high litter cover 50-60% and rock cover 32-60%, reduces the potential for soil erosion. -
Bare ground from Ecological Site Description or other studies (rock, litter, lichen, moss, plant canopy are not bare ground):
Very low for site, on average 2%. -
Number of gullies and erosion associated with gullies:
None present on the site. High foliar cover of plants 87-95%, mostly perennials 64-86% cover with significant basal cover 5-10% and very high litter cover 50-60% and rock cover 32-60%, reduces the potential for soil erosion. -
Extent of wind scoured, blowouts and/or depositional areas:
None present on the site. High foliar cover of plants 87-95%, mostly perennials 64-86% cover with significant basal cover 5-10% and very high litter cover 50-60% and rock cover 32-60%, reduces the potential for soil erosion. -
Amount of litter movement (describe size and distance expected to travel):
Herbaceous litter travels less than 12 inches before encountering a plant base. -
Soil surface (top few mm) resistance to erosion (stability values are averages - most sites will show a range of values):
Expect values of 5-6 across the site. -
Soil surface structure and SOM content (include type of structure and A-horizon color and thickness):
Moderate to strong, fine to medium granular structure. A horizon thickness ranges from 0-2 inches with moist colors ranging from 7.5YR3/2, 7.5YR3/3,7.5YR4/2, 7.5YR4/3. -
Effect of community phase composition (relative proportion of different functional groups) and spatial distribution on infiltration and runoff:
Midgrasses>>annual forbs and grasses>>shrubs>>perennial forbs. High foliar cover of plants 87-95%, mostly perennials 64-86% cover with significant basal cover 5-10% and very high litter cover 50-60% and rock cover 32-60%, reduces the potential for soil erosion. -
Presence and thickness of compaction layer (usually none; describe soil profile features which may be mistaken for compaction on this site):
None. -
Functional/Structural Groups (list in order of descending dominance by above-ground annual-production or live foliar cover using symbols: >>, >, = to indicate much greater than, greater than, and equal to):
Dominant:
MidgrassesSub-dominant:
Annual forbs and grasses=shrubs.Other:
Additional:
-
Amount of plant mortality and decadence (include which functional groups are expected to show mortality or decadence):
Slight. -
Average percent litter cover (%) and depth ( in):
-
Expected annual annual-production (this is TOTAL above-ground annual-production, not just forage annual-production):
835 lbs/ac below average year, 1558 lbs/ac average year, 2310 lbs/ac above average year. -
Potential invasive (including noxious) species (native and non-native). List species which BOTH characterize degraded states and have the potential to become a dominant or co-dominant species on the ecological site if their future establishment and growth is not actively controlled by management interventions. Species that become dominant for only one to several years (e.g., short-term response to drought or wildfire) are not invasive plants. Note that unlike other indicators, we are describing what is NOT expected in the reference state for the ecological site:
Single leaf pinyon, blue grama, bear grass, red berry juniper and one seed juniper,Cane cholla. -
Perennial plant reproductive capability:
Not affected after several years of drought in the region.
Print Options
Sections
Font
AAAAOther
PrintThe Ecosystem Dynamics Interpretive Tool is an information system framework developed by the USDA-ARS Jornada Experimental Range, USDA Natural Resources Conservation Service, and New Mexico State University.
Accessibility statement


