
Natural Resources
Conservation Service
Ecological site R038XB209AZ
Loamy Upland
16-20" p.z.
Last updated: 5/07/2020
Accessed: 09/23/2026
-
Search


Major Land Resource Area or ecological site by name and/or ID.
PreviousSectionsNextGeneral information
Provisional. A provisional ecological site description has undergone quality control and quality assurance review. It contains a working state and transition model and enough information to identify the ecological site.
MLRA notes
Major Land Resource Area (MLRA): 038X–Mogollon Transition South
AZ 38-2 Middle Mogollon Transition
Elevations range from 4200 to 5800 feet and precipitation averages 16 to 20 inches per year in this Land Resource Unit. Vegetation includes turbinella oak, Wright silktassel, hollyleaf buckthorn, desert buckbrush, one-seed juniper, alligator juniper, pinyon, algerita, sugar sumac, prairie junegrass, blue grama, curly mesquite, bottlebrush squirreltail, muttongrass, cane beardgrass, plains lovegrass and bullgrass. The soil temperature regime ranges from thermic to mesic and the soil moisture regime is aridic ustic. This unit occurs within the Transition Zone Physiographic Province and is characterized by canyons and structural troughs or valleys. Igneous, metamorphic and sedimentary rock classes occur on rough mountainous terrain in association with less extensive sediment filled valleys exhibiting little integrated drainage.Associated sites
R038XB202AZ Clayey Upland 16-20" p.z.
Clayey Upland 16-20" p.z.
R038XB203AZ Clay Loam Upland 16-20" p.z.
Clayloam Upland 16-20" p.z.
R038XB215AZ Clayey Hills 16-20" p.z.
Clayey Hills 16-20" p.z.
Similar sites
R038XC303AZ Clay Loam Upland 20-24" p.z.
Clayloam Upland 20+" p.z. will have trace amounts of oneseed, Utah, and redberry juniper but the savanna tree species is alligator juniper and when the site has been converted to woodland through juniper invasion alligator juniper is the dominant tree.
Table 1. Dominant plant species
Tree Not specified
Shrub Not specified
Herbaceous Not specified
Physiographic features
This site occurs in the mid to upper elevations of the Mogollon Transition zone south of the Mogollon Rim in central Arizona.
This site is in an upland position. It neither benefits significantly from run-in moisture nor suffers from excess runoff. Slopes range from 0 to 15 percent on valley fill plains, basalt flows and mesa tops.Table 2. Representative physiographic features
Landforms (1) Alluvial flat
(2) Mesa
Flooding frequency None Ponding frequency None Elevation 4200 – 5800 ft Slope 0 – 15 % Aspect N, S, W Climatic features
Precipitation in this Land Resource Unit averages 16 to 20 inches annually. The winter-summer rainfall ratio ranges from about 60/40% in the western part of the area to 45/55% in the eastern part. Summer rains fall July through September; and are from high-intensity, convective, thunderstorms. This moisture originates primarily from the Gulf of Mexico, but can come from the remnants of Pacific hurricanes in September. Winter moisture is frontal, originates in the north Pacific, and falls as rain or snow in widespread storms of low intensity and long duration. Snowfall ranges from 5 to 35 inches per year and can occur from November through April. Snow seldom persists for more than a week. May and June are the driest months of the year. Humidity is moderate to low all year. Average annual air temperatures range from 51 to 60 degrees F (thermic temperature regime). Daytime temperatures in the summer are commonly in the low 90’s. Freezing temperatures are common from October through April. The actual precipitation, available moisture and temperature vary, depending on, region, elevation, rain shadow effect and aspect.
Table 3 Representative climatic features
Frost-free period (average) 180 days Freeze-free period (average) 240 days Precipitation total (average) 20 in BarLineFigure 1. Monthly precipitation range
BarLineFigure 2. Monthly average minimum and maximum temperature
">Influencing water features
There are no water features associated with this site.
Soil features
Soils mapped under this site include: SSA675 San Carlos IR area MU's 8 Stanford and Lanque, 11 Biplane family, 26 & 81 Terrarossa.
Table 4. Representative soil features
Parent material (1) Alluvium – andesite
Surface texture (1) Gravelly loam
(2) Gravelly sandy loam
(3) Loam
Family particle size (1) Clayey
Drainage class Well drained to moderately well drained Permeability class Very slow to moderately rapid Soil depth 30 – 60 in Surface fragment cover <=3" 0 – 25 % Surface fragment cover >3" 0 – 15 % Available water capacity
(0-40in)2.6 – 7.9 in Calcium carbonate equivalent
(0-40in)0 – 10 % Electrical conductivity
(0-40in)0 – 2 mmhos/cm Sodium adsorption ratio
(0-40in)0 – 2 Soil reaction (1:1 water)
(0-40in)6.6 – 8.4 Subsurface fragment volume <=3"
(Depth not specified)0 – 30 % Subsurface fragment volume >3"
(Depth not specified)0 – 15 % Ecological dynamics
The plant communities found on an ecological site are naturally variable. Composition and production will vary with yearly conditions, location, aspect, and the natural variability of the soils. The Reference Plant Community represents the natural potential plant communities found on relict or relatively undisturbed sites. Other plant communities described here represent plant communities that are known to occur when the site is disturbed by factors such as grazing, fire, absence of fire, or drought.
Production data provided in this site description is standardized to air-dry weight at the end of the summer growing season. The plant communities described in this site description are based on near normal rainfall years.
NRCS uses a Similarity Index to compare existing plant communities to the plant communities described here. Similarity Index is determined by comparing the production and composition of a plant community to the production and composition of a plant community described in this site description. To determine Similarity Index, compare the production (air-dry weight) of each species to that shown in the plant community description. For each species, count no more than the maximum amount shown for the species, and for each group, count no more than the maximum shown for the group. Divide the resulting total by the total normal year production shown in the plant community description. If rainfall has been significantly above or below normal, use the total production shown for above or below normal years. If field data is not collected at the end of the summer growing season, then the field data must be corrected to the end of the year production before comparing it to the site description. The growth curve can be used as a guide for estimating production at the end of the summer growing season.State and transition model
Custom diagramStandard diagram
More interactive model formats are also available. View Interactive Models
More interactive model formats are also available. View Interactive Models
Click on state and transition labels to scroll to the respective textEcosystem states
States 2 and 5 (additional transitions)
State 1 submodel, plant communities
State 2 submodel, plant communities
State 3 submodel, plant communities
State 4 submodel, plant communities
State 5 submodel, plant communities
State 1
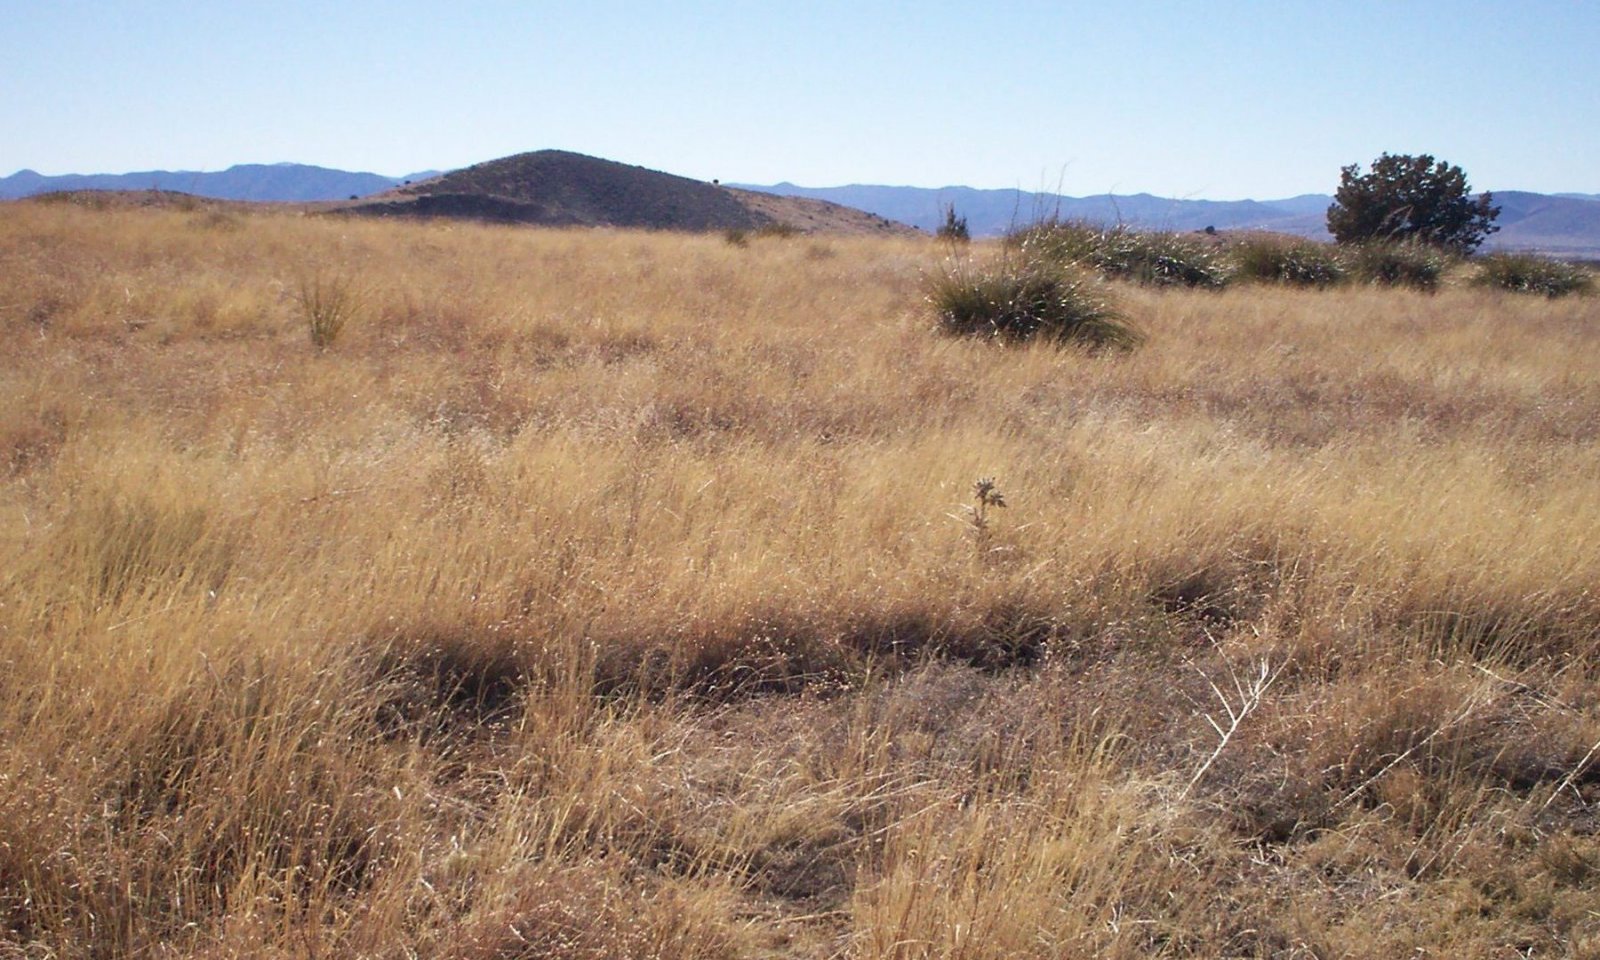
Reference Plant CommunityThe Midgrass State is the Reference Plant Community. It is a warm season dominated grassland (canopy cover of 55 to 65%) with an important component of cool season grasses that fluctuate with climate. Cool and warm season annual grasses and forbs are well represented in the flora. Half shrubs and perennial forbs are an important group also. Fire return intervals are difficult to determine in woody plant communities in this LRU. However, periodic wildfires likely occurred every 10 to 15 years from June through August, and controlled shrubs and succulents invading from adjacent, shallow soil, areas. In the absence of fire for long periods of time; shrubs, trees and cacti can dominate the site. The interactions of drought, fire and grazing can result in a loss of perennial grass cover. In these situations annuals, both native and non-native, can dominate the plant community. Non-native annuals can, over time, diminish the soil seed-bank of native annual species.
Community 1.1
Reference Plant Community
The Reference Plant Community is a grassland dominated by sideoats grama and blue grama. Prairie junegrass and bottlebrush squirreltail are important in the plant community, but can diminish to low levels after severe winter - spring drought. Squirreltail appears to be slightly less susceptible to drought than junegrass. Shrubby buckwheat is an important half-shrub in the plant community. A flora of native annual forbs and grasses, of both the winter and summer seasons, exist in the plant community. Periodic, naturally occurring, wildfires were important in maintaining the potential plant community.
Figure 3. Annual production by plant type (representative values) or group (midpoint values)
Table 5. Annual production by plant type
Plant type Low
(lb/acre)Representative value
(lb/acre)High
(lb/acre)Grass/Grasslike 700 1500 1900 Forb 20 150 400 Shrub/Vine 25 50 75 Tree 0 0 25 Total 745 1700 2400 Table 6. Soil surface cover
Tree basal cover 0-0% Shrub/vine/liana basal cover 0-0% Grass/grasslike basal cover 10-20% Forb basal cover 0-0% Non-vascular plants 0% Biological crusts 0% Litter 60-80% Surface fragments >0.25" and <=3" 0-30% Surface fragments >3" 0-20% Bedrock 0% Water 0% Bare ground 0-20% Table 7. Canopy structure (% cover)
Height Above Ground (ft) Tree Shrub/Vine Grass/
GrasslikeForb <0.5 – 0-1% 5-10% 0-5% >0.5 <= 1 – 0-1% 10-20% 0-15% >1 <= 2 – 0-1% 30-50% – >2 <= 4.5 – 0-1% – – >4.5 <= 13 – 0-1% – – >13 <= 40 – – – – >40 <= 80 – – – – >80 <= 120 – – – – >120 – – – – Figure 4. Plant community growth curve (percent production by month). AZ3812 , 38.2 16-20" p.z. all sites. Growth begins in the spring and continues into the summer and fall..
Jan Feb Mar Apr May Jun Jul Aug Sep Oct Nov Dec J F M A M J J A S O N D 0 5 5 15 10 10 15 20 10 5 5 0 State 2
Short grass StateThe Short grass state has a plant community dominated by short grasses.
Community 2.1
Blue grama high basal Community
The Blue Grama high basal community is dominated by blue grama that has basal area ranging from 10-15%. Proper livestock grazing in the form of periodic summer deferment or low intensity to no livestock grazing maintains high basal area.
Community 2.2
Blue grama medium basal CommunityThe Blue Grama medium basal Community is dominated by blue grama that has basal area ranging from 5-10%. Continuous livestock grazing with little to no summer deferment has reduced the vigor of blue grama to a point where its basal area begins to decline.
Pathway 2.1A
Community 2.1 to 2.2Continuous heavy livestock grazing with no summer deferment.
Pathway 2.2a
Community 2.2 to 2.1Application of prescribed grazing in the form of summer deferment.
Conservation practices
Prescribed Grazing State 3
Short grass / subshrub StateThe Short grass / subshrub State is a community where high levels of snakeweed have established and are co-dominant with blue grama.
Community 3.1
Blue grama medium basal / subshrub Community
The Blue grama medium basal Community of this state is a community where high levels of snakeweed have established and are now co-dominant with blue grama. Continuous livestock grazing with no summer deferment has reduced the vigor of blue grama to approximately 5-10% basal area and opened the community up to invasion by high densities of snakeweed. Snakeweed canopy is approximately 30-40%.
State 4
Eroded StateThe eroded state is a plant community where blue grama abundance has been substantially reduced.
Community 4.1
Blue grama low basal CommunityContinuous heavy livestock grazing and drought have substantially reduced the vigor of blue grama. Basal area of blue grama is reduced to less than 5% basal area. Plants are pedestalled with approximately 0.5-1" of the root exposed.
State 5
Juniper StateJuniper has increased in the absence of fire to dominate the site.
Community 5.1
Juniper Community
Juniper has established in the absence of fire to canopy levels of 15-50%. Herbaceous production ranges from 0-400 lbs/ac. The dominant juniper species is oneseed or redberry juniper. This is likely a stable state because trees are of sufficient size that very high temperatures and wind speeds are required to burn the site; conditions where practitioners are unlikely to apply prescribed fire.
Mechanical brush management can be applied followed by burning of skeletons if sufficient fine fuels are on site. Perennial grass canopy in the interspaces of trees is > 50% in some areas with existing plants likely providing an adequate seed source for restoration following brush management or fires. Range planting should likely only be considered where perennial grass canopy in the interspaces of trees is less than 25%; however this threshold needs additional investigation.Transition T1a
State 1 to 2Continuous livestock grazing with no summer deferrment.
Restoration pathway R2a
State 2 to 1Unknown. Contour ripping to break up the dominance of blue grama and allow other species to come in has been successful in blue grama dominated plant communities in central New Mexico (Pat Shaver, pers. comm.) and squirreltail is only observed in areas where pipelines have been ripped through blue grama communities north of Springerville, AZ. Contour ripping followed by range planting.
Transition T2a
State 2 to 3Continuous heavy livestock grazing with no summer deferment.
Transition T2b
State 2 to 5Juniper establishment and growth to maturity in the absence of fire.
Restoration pathway R3a
State 3 to 2Unknown. Contour ripping, range planting, prescribed grazing in the form of summer deferment.
Transition T3a
State 3 to 4Continued yearlong heavy livestock grazing with no summer deferment.
Restoration pathway R4a
State 4 to 3Long term application of prescribed grazing in the form of summer deferment. This restoration pathway likely only possible where soil erosion is less than 1/2 inch and very long term application of summer deferment.
Restoration pathway R5a
State 5 to 2Mechanical brush management with sufficient remnant perennial grass in the interspaces between trees. Reseeding may be needed where perennial grass is less than 25% canopy cover in the interspaces between trees. However, this needs additional investigation.
Additional community tables
Table 8. Community 1.1 plant community composition
Group Common name Symbol Scientific name Annual production () Foliar cover (%) Grass/Grasslike1 mid grasses 400–700 sideoats grama BOCU Bouteloua curtipendula 400–700 – cane bluestem BOBA3 Bothriochloa barbinodis 0–100 – plains lovegrass ERIN Eragrostis intermedia 0–50 – green sprangletop LEDU Leptochloa dubia 0–50 – 2 short grasses 100–400 blue grama BOGR2 Bouteloua gracilis 100–300 – hairy grama BOHI2 Bouteloua hirsuta 0–100 – sprucetop grama BOCH Bouteloua chondrosioides 0–100 – black grama BOER4 Bouteloua eriopoda 0–100 – 3 cool season grasses 10–200 squirreltail ELEL5 Elymus elymoides 10–200 – prairie Junegrass KOMA Koeleria macrantha 10–200 – muttongrass POFE Poa fendleriana 0–10 – 4 miscellaneous perennial grasses 10–50 spidergrass ARTEG Aristida ternipes var. gentilis 0–50 – threeawn ARIST Aristida 0–25 – Fendler threeawn ARPUL Aristida purpurea var. longiseta 0–25 – spidergrass ARTE3 Aristida ternipes 0–25 – sand dropseed SPCR Sporobolus cryptandrus 0–25 – common wolfstail LYPH Lycurus phleoides 0–15 – Arizona threeawn ARAR6 Aristida arizonica 0–15 – poverty threeawn ARDI5 Aristida divaricata 0–10 – creeping muhly MURE Muhlenbergia repens 0–10 – slender muhly MUTE4 Muhlenbergia tenuifolia 0–10 – curly-mesquite HIBE Hilaria belangeri 0–10 – 5 annual grasses 25–300 Mexican sprangletop LEFUU Leptochloa fusca ssp. uninervia 10–200 – mucronate sprangeltop LEPAB Leptochloa panicea ssp. brachiata 10–200 – Mexican panicgrass PAHI5 Panicum hirticaule 5–200 – prairie threeawn AROL Aristida oligantha 5–100 – needle grama BOAR Bouteloua aristidoides 0–50 – sixweeks threeawn ARAD Aristida adscensionis 0–50 – feather fingergrass CHVI4 Chloris virgata 0–50 – witchgrass PACA6 Panicum capillare 0–50 – tufted lovegrass ERPE Eragrostis pectinacea 0–50 – desert lovegrass ERPEM Eragrostis pectinacea var. miserrima 0–50 – sticky sprangletop LEVI5 Leptochloa viscida 0–50 – small fescue VUMI Vulpia microstachys 0–50 – Eastwood fescue VUMIC Vulpia microstachys var. ciliata 0–50 – sixweeks fescue VUOC Vulpia octoflora 5–50 – Bigelow's bluegrass POBI Poa bigelovii 0–25 – delicate muhly MUFR Muhlenbergia fragilis 0–25 – littleseed muhly MUMI Muhlenbergia microsperma 0–25 – little barley HOPU Hordeum pusillum 0–25 – canyon cupgrass ERLE7 Eriochloa lemmonii 0–25 – sixweeks grama BOBA2 Bouteloua barbata 0–25 – Arizona brome BRAR4 Bromus arizonicus 0–25 – Arizona signalgrass URAR Urochloa arizonica 0–15 – Forb6 perennial forbs 15–70 desert globemallow SPAM2 Sphaeralcea ambigua 1–15 – copper globemallow SPAN3 Sphaeralcea angustifolia 0–15 – Lewis flax LILE3 Linum lewisii 0–10 – bluedicks DICA14 Dichelostemma capitatum 0–10 – Forb, perennial 2FP Forb, perennial 0–10 – weakleaf bur ragweed AMCO3 Ambrosia confertiflora 1–10 – brownfoot ACWR5 Acourtia wrightii 0–5 – largeflower onion ALMA4 Allium macropetalum 1–5 – scarlet spiderling BOCO Boerhavia coccinea 0–5 – leastdaisy CHAET2 Chaetopappa 0–5 – rose heath CHER2 Chaetopappa ericoides 0–5 – sego lily CANU3 Calochortus nuttallii 0–2 – onion ALLIU Allium 0–2 – Greene's bird's-foot trefoil LOGR4 Lotus greenei 0–2 – Wright's deervetch LOWR Lotus wrightii 0–2 – Parry's beardtongue PEPA24 Penstemon parryi 0–2 – orange fameflower PHAU13 Phemeranthus aurantiacus 0–2 – twinleaf senna SEBA3 Senna bauhinioides 0–2 – ragwort SENEC Senecio 0–2 – brownplume wirelettuce STPA4 Stephanomeria pauciflora 0–2 – southwestern mock vervain GLGO Glandularia gooddingii 0–2 – vetch VICIA Vicia 0–1 – beeblossom GAURA Gaura 0–1 – tuber anemone ANTU Anemone tuberosa 0–1 – perennial rockcress ARPE2 Arabis perennans 0–1 – Watson's dutchman's pipe ARWA Aristolochia watsonii 0–1 – Texas bindweed COEQ Convolvulus equitans 0–1 – desert larkspur DEPA Delphinium parishii 0–1 – 7 annual forbs 0–150 longleaf false goldeneye HELO6 Heliomeris longifolia 1–100 – Forb, annual 2FA Forb, annual 0–25 – western tansymustard DEPI Descurainia pinnata 0–10 – Arizona popcornflower PLAR Plagiobothrys arizonicus 1–10 – creamcups PLCA5 Platystemon californicus 0–10 – spreading fanpetals SIAB Sida abutifolia 0–5 – Arizona lupine LUAR4 Lupinus arizonicus 0–5 – miniature lupine LUBI Lupinus bicolor 0–5 – Coulter's lupine LUSP2 Lupinus sparsiflorus 0–5 – hollowleaf annual lupine LUSU3 Lupinus succulentus 0–5 – California poppy ESCAM Eschscholzia californica ssp. mexicana 0–5 – common sunflower HEAN3 Helianthus annuus 0–5 – Coulter's spiderling BOCO2 Boerhavia coulteri 0–5 – spreading fleabane ERDI4 Erigeron divergens 0–5 – bristly fiddleneck AMTE3 Amsinckia tessellata 0–5 – aster ASTER Aster 0–5 – New Mexico thistle CINE Cirsium neomexicanum 0–5 – milkvetch ASTRA Astragalus 0–2 – sorrel buckwheat ERPO4 Eriogonum polycladon 0–2 – lambsquarters CHAL7 Chenopodium album 0–2 – spurge EUPHO Euphorbia 0–2 – cudweed GNAPH Gnaphalium 0–2 – tanseyleaf tansyaster MATA2 Machaeranthera tanacetifolia 0–2 – desert Indianwheat PLOV Plantago ovata 0–2 – woolly plantain PLPA2 Plantago patagonica 0–2 – sleepy silene SIAN2 Silene antirrhina 0–1 – sand fringepod THCU Thysanocarpus curvipes 0–1 – goldeneye VIGUI Viguiera 0–1 – green carpetweed MOVE Mollugo verticillata 0–1 – evening primrose OENOT Oenothera 0–1 – lacy tansyaster MAPI Machaeranthera pinnatifida 0–1 – aridland goosefoot CHDE Chenopodium desiccatum 0–1 – sanddune wallflower ERCA14 Erysimum capitatum 0–1 – miniature woollystar ERDI2 Eriastrum diffusum 0–1 – New Mexico fleabane ERNE3 Erigeron neomexicanus 0–1 – crestrib morning-glory IPCO2 Ipomoea costellata 1 – California goldfields LACA7 Lasthenia californica 0–1 – grassleaf lettuce LAGRA Lactuca graminifolia var. arizonica 0–1 – Goodding's bladderpod LEGO2 Lesquerella gooddingii 0–1 – shaggyfruit pepperweed LELA Lepidium lasiocarpum 0–1 – Thurber's pepperweed LETH2 Lepidium thurberi 0–1 – foothill deervetch LOHU2 Lotus humistratus 0–1 – coastal bird's-foot trefoil LOSA Lotus salsuginosus 0–1 – scrambled eggs COAU2 Corydalis aurea 0–1 – croton CROTO Croton 0–1 – cryptantha CRYPT Cryptantha 0–1 – American wild carrot DAPU3 Daucus pusillus 0–1 – annual agoseris AGHE2 Agoseris heterophylla 0–1 – Shrub/Vine8 shrubs 0–10 catclaw acacia ACGR Acacia greggii 0–5 – velvet mesquite PRVE Prosopis velutina 0–5 – fourwing saltbush ATCA2 Atriplex canescens 0–2 – pale desert-thorn LYPA Lycium pallidum 0–1 – catclaw mimosa MIACB Mimosa aculeaticarpa var. biuncifera 0–1 – Sonoran scrub oak QUTU2 Quercus turbinella 0–1 – currant RIBES Ribes 0–1 – 9 half shrubs 10–40 broom snakeweed GUSA2 Gutierrezia sarothrae 1–25 – bastardsage ERWR Eriogonum wrightii 5–20 – prairie acacia ACAN Acacia angustissima 1–5 – yerba de pasmo BAPT Baccharis pteronioides 1–5 – Cooley's bundleflower DECO2 Desmanthus cooleyi 1–5 – 10 succulents 0–100 sacahuista NOMI Nolina microcarpa 0–100 – cactus apple OPEN3 Opuntia engelmannii 0–5 – soaptree yucca YUEL Yucca elata 0–5 – walkingstick cactus CYSP8 Cylindropuntia spinosior 0–1 – Whipple cholla CYWH Cylindropuntia whipplei 0–1 – Tree12 trees 0–25 redberry juniper JUCO11 Juniperus coahuilensis 0–25 – oneseed juniper JUMO Juniperus monosperma 0–25 – twoneedle pinyon PIED Pinus edulis 0–25 – singleleaf pinyon PIMO Pinus monophylla 0–25 – Utah juniper JUOS Juniperus osteosperma 0–15 – Table 9. Community 2.1 plant community composition
Group Common name Symbol Scientific name Annual production () Foliar cover (%) Table 10. Community 2.2 plant community composition
Group Common name Symbol Scientific name Annual production () Foliar cover (%) Table 11. Community 3.1 plant community composition
Group Common name Symbol Scientific name Annual production () Foliar cover (%) Table 12. Community 4.1 plant community composition
Group Common name Symbol Scientific name Annual production () Foliar cover (%) Table 13. Community 5.1 plant community composition
Group Common name Symbol Scientific name Annual production () Foliar cover (%) Interpretations
Animal community
This site is suitable for grazing year round and is easily traversed by all classes of livestock. The site is very susceptible to erosion in overgrazed areas, old roads, cattle trails and concentration areas like bed grounds, water-lots and salt grounds.
The site has good habitat diversity for grassland wildlife species. Where it is adjacent to hill sites, with tree species or chaparral, it is a foraging area for elk.Hydrological functions
This site produces runoff when soils are moist. Surfaces can be easily compacted by traffic and high densities of livestock when soils are moist. Normal depth of soil freezing in the winter is 5 to 6 inches. This will not break up compacted layers deeper than that. Compacted surfaces will produce much more runoff than surfaces with good tilth and structure.
Recreational uses
Hunting, camping, hiking, horseback riding, and backpacking.
Wood products
None.
Other products
There is some native harvest of foods like wild onion, sunflower and thistle.
Supporting information
Type locality
Location 1: Yavapai County, AZ Township/Range/Section T23 R1E S15N UTM zone N UTM northing 3837140 UTM easting 387689 General legal description Between Prescott Valley and Jerome. Approximately 1700 feet north of Hwy 89A and 1.8 miles west of the base of Hickey Mountain. 5,400 feet elevation. Minor component among more dominant Clayey Upland 38-2. Contributors
Dave Womack
Larry D. Ellicott
Steve BarkerApproval
Scott Woodall, 5/07/2020
Rangeland health reference sheet
Interpreting Indicators of Rangeland Health is a qualitative assessment protocol used to determine ecosystem condition based on benchmark characteristics described in the Reference Sheet. A suite of 17 (or more) indicators are typically considered in an assessment. The ecological site(s) representative of an assessment location must be known prior to applying the protocol and must be verified based on soils and climate. Current plant community cannot be used to identify the ecological site.
Author(s)/participant(s) Dave Womack, Dan Robinett, Emilio Carrillo Contact for lead author USDA NRCS, Tucson Area Office Date 04/29/2011 Approved by Approval date Composition (Indicators 10 and 12) based on Annual Production Indicators
-
Number and extent of rills:
None present on the site. Perennial bunch grass plants are approximately 1-2 foot apart, promote high infiltration, and make the site not conducive to rill formation. -
Presence of water flow patterns:
Flow patterns are indiscrete and highly sinuous. Water flows no more than 1-2 feet before encountering base of perennial bunch grass plant. -
Number and height of erosional pedestals or terracettes:
None present on the site. Bunch grass community not conducive to forming terracettes. -
Bare ground from Ecological Site Description or other studies (rock, litter, lichen, moss, plant canopy are not bare ground):
5-15%. -
Number of gullies and erosion associated with gullies:
None present on the site. Very dense bunchgrass community promotes high infiltration and very stable soils. -
Extent of wind scoured, blowouts and/or depositional areas:
None present on the site. Perennial bunchgrass canopy cover is 55-65%. -
Amount of litter movement (describe size and distance expected to travel):
Herbaceous litter is the dominant litter on the site. Litter moves no more than 1-2 feet before being intercepted by plant bases. -
Soil surface (top few mm) resistance to erosion (stability values are averages - most sites will show a range of values):
Soil surface is highly resistant to erosion. Expect soil stability values of 4-6 across the site. -
Soil surface structure and SOM content (include type of structure and A-horizon color and thickness):
Strong very fine granular structure. Soil organic matter content is 1-3%. A horizon is 4-8" thick with 7.5YR4/3 dry color and 7.5YR3/3 moist color. -
Effect of community phase composition (relative proportion of different functional groups) and spatial distribution on infiltration and runoff:
Very high density bunch grass dominated plant community promotes very high infiltration. Perennial grass densities are approximately 3-5 plants per square yard. -
Presence and thickness of compaction layer (usually none; describe soil profile features which may be mistaken for compaction on this site):
None present on the site. Dry argillic horizon at 4-8 inches can be mistaken for compaction layer. -
Functional/Structural Groups (list in order of descending dominance by above-ground annual-production or live foliar cover using symbols: >>, >, = to indicate much greater than, greater than, and equal to):
Dominant:
Midgrasses >> shortgrassesSub-dominant:
Cool season grass > miscellaneous grasses > Perennial forbs = subshrubs > annual forbs = annual grass (Note: In El Nino years annual grasses = annual forbs > misc. grass > perennial forbs).Other:
Additional:
-
Amount of plant mortality and decadence (include which functional groups are expected to show mortality or decadence):
Approximately 2-5% mortality of perennial grass plants. -
Average percent litter cover (%) and depth ( in):
-
Expected annual annual-production (this is TOTAL above-ground annual-production, not just forage annual-production):
Below average year = 745 lb/ac, normal year = 1,700 lbs/ac, above average year 2,400 lbs/ac. -
Potential invasive (including noxious) species (native and non-native). List species which BOTH characterize degraded states and have the potential to become a dominant or co-dominant species on the ecological site if their future establishment and growth is not actively controlled by management interventions. Species that become dominant for only one to several years (e.g., short-term response to drought or wildfire) are not invasive plants. Note that unlike other indicators, we are describing what is NOT expected in the reference state for the ecological site:
With continuous heavy livestock grazing blue grama will become dominant. Deterioration of blue grama cover will open community up to spiny tansyaster, snakeweed, annual goldeneye, and tumble mustard. Absence of fire can result in increase in beargrass and juniper. -
Perennial plant reproductive capability:
Not affected after several years of regional drought.
Print Options
Sections
Font
AAAAOther
PrintThe Ecosystem Dynamics Interpretive Tool is an information system framework developed by the USDA-ARS Jornada Experimental Range, USDA Natural Resources Conservation Service, and New Mexico State University.
Accessibility statement


