Natural Resources
Conservation Service
-
Search


Major Land Resource Area or ecological site by name and/or ID.
PreviousSectionsNextGeneral information
Provisional. A provisional ecological site description has undergone quality control and quality assurance review. It contains a working state and transition model and enough information to identify the ecological site.
Click to explore map
Figure 1. Mapped extent
Areas shown in blue indicate the maximum mapped extent of this ecological site. Other ecological sites likely occur within the highlighted areas. It is also possible for this ecological site to occur outside of highlighted areas if detailed soil survey has not been completed or recently updated.
MLRA notes
Major Land Resource Area (MLRA): 035X–Colorado Plateau
Site Concept: The Alkali Bottom ecological site occurs on salt-affected soils that recieve extra water or have a seasonally high water table within 72 inches of the soil surface. It is found in the desert and semidesert climate zones (4,200-6,500 feet) of the Colorado and Green River Plateaus region (MLRA 35). Soils may be clay loams to sandy loams that occur on stream terraces, floodplains and valley bottoms. Annual precipitation ranges from 6 to 12 inches. The historic plant community is characterized by greasewood (Sarcobatus vermiculatus) and dropseed bunchgrasses (Sporobolus spp) with a fire return interval of 35-100 years. Greasewood maintains dominance of this site by bringing salts to the soil surface and by vigorous resprouting following disturbance events. Cheatgrass and Russian thistle are common invaders of the understory, but do not typically dominate the site. Tamarisk is capable of dominating this site when it occurs on low stream terraces.
Associated sites
R035XY009UT Alkali Flat (Greasewood)
The Alkali Flat may be adjacent to the Alkali Bottom in response to a natural gradient in water table depth; either due to gentle slopes, distinct terrace heights, or hilly terrain.
R035XY011UT Loamy Bottom (Basin Big Sagebrush)
Since the Loamy Bottom and Alkali Bottom occupy similar landscape positions with similar hydrology, they are often found in complex with eachother when soil salt content is relatively low and patchy.
R035XY012UT Semiwet Saline Streambank (Fremont Cottonwood)
Similar sites
R035XY011UT Loamy Bottom (Basin Big Sagebrush)
This site occupies the same landscape position and has similar water table characteristics. However, it is not salt-affected and mostly occurs on sandy loam soils, while the Alkali Bottom occurs mostly on finer textured soils.
R028AY004UT Alkali Flat (Black Greasewood)
R035XY009UT Alkali Flat (Greasewood)
This site occurs on salt affected soils and is typically dominated by greasewood, but it occurs in areas with a water table greater than 72 inches. Alkali Flat is often more sodic, with higher pH, and significantly less total production than Alkali Bottom. Greasewood plants are smaller and shrub interspaces are often sparsely vegetated.
Table 1. Dominant plant species
Tree Not specified
Shrub (1) Sarcobatus vermiculatus
Herbaceous (1) Sporobolus airoides
Physiographic features
This site occurs on flood plains, stream terraces, near stream channels, and in valley floors. It is a run-in site that recieves extra moisture from surrounding uplands, and often has a seasonlly high water table within 72 inches of the soil surface. Runoff is very low to high. Slopes typically range from 0-8%, and elevations are generally 4200 to 6500 ft.
Table 2. Representative physiographic features
Landforms (1) Flood plain
(2) Stream terrace
(3) Valley floor
Flooding duration Extremely brief (0.1 to 4 hours) to very brief (4 to 48 hours) Flooding frequency None to occasional Ponding frequency None Elevation 4200 – 6000 ft Slope 0 – 8 % Water table depth 42 – 72 in Aspect Aspect is not a significant factor Climatic features
The climate is characterized by hot summers and cool to warm winters. Large fluctuations in daily temperatures are common. Mean annual high temperatures range from 63-71 degrees Fahrenheit and mean annual low temperatures range from 39-63 degrees Fahrenheit. Approximately 70-75% occurs as rain from March through October. On the average, April, May, and June are the driest months and August through October are the wettest months. Precipitation is extremely variable from month to month and from year to year but averages between 7-11 inches. Much of the summer precipitation occurs as convection thunderstorms. This is a run-in site that receives additional moisture from adjacent sites and occasional flooding.
Table 3 Representative climatic features
Frost-free period (average) 160 days Freeze-free period (average) 190 days Precipitation total (average) 10 in BarLineFigure 2. Monthly precipitation range
BarLineFigure 3. Monthly average minimum and maximum temperature
">Influencing water features
This site may occur near stream channels and is often influenced by a seasonally high water table. However, this site does not support riparian obligate plant species.
Soil features
The soils of this site are very deep alluvial deposits, primarily derived form sedimentary materials. The defining characteristics of these soils are a seasonally high water table and high salt content, which results in high production of halophytic plants. Surface and subsurface textures can range from clay loams to sandy loams. Water holding capacity in the upper 40 inches of soil also has a broad range; from 3.7 inches in coarse soils to 7.4 in fine textured soils. These soils are well-drained with slow to rapid permeability. Rock fragments range from 0 to 10 percent on the suface and throughout the profile. The soil temperature regime is mesic and the soil moisture regime can be aridic (torric) or ustic aridic.
This site has been used in the following soil surveys and has been correlated to the following components:
UT626 – Beaver County – Saltair;
UT631 – Henry Mountains Area – Glenberg Family;
UT638 – San Juan County, Central – Bankard Family ;
UT636 – Panguitch Area – Borollic Natragids;
UT642 – Kane County Area – Billings;
UT685 - Capitol Reef National Park - Uzona, Henrieville, Befar;
UT686 – Escalante Grand Staircase National Monument – Suwanee, Jocity, Billings;
UT688 – Canyonlands National Park – Mido;
Typical Profile:
A – 0-5 inches; loamy sand; moderately alkaline
C – 5-80 inches; loamy vey fine sand; moderately alkaline
Table 4. Representative soil features
Parent material (1) Alluvium – sandstone and shale
Surface texture (1) Fine sandy loam
(2) Loam
(3) Clay loam
Family particle size (1) Loamy
Drainage class Well drained Permeability class Slow to rapid Soil depth 60 – 0 in Surface fragment cover <=3" 0 – 10 % Surface fragment cover >3" 0 – 3 % Available water capacity
(0-40in)3.7 – 7.4 in Calcium carbonate equivalent
(0-40in)1 – 30 % Electrical conductivity
(0-40in)0 – 8 mmhos/cm Sodium adsorption ratio
(0-40in)0 – 10 Soil reaction (1:1 water)
(0-40in)7.4 – 8.4 Subsurface fragment volume <=3"
(Depth not specified)0 – 10 % Subsurface fragment volume >3"
(Depth not specified)0 – 3 % Ecological dynamics
This site was historically dominated by greasewood and a diverse perennial understory, including seepweed, pale evening primrose, Indian ricegrass, Sporobolus spp, and James' galleta. The historic fire return interval is presumed to be about 35-100 years (Anderson 2004). Greasewood and native grasses would have resprouted within one year following fire and maintained dominance of the site. There is no evidence that prolonged drought would dramatically alter the species composition of the site in reference condition, although production is expected to be lower.
Today this site often burns less frequently due to fire suppression efforts and reduced fine fuel loads resulting from livestock grazing. In addition, excessive livestock grazing during the spring and summer can cause native grasses and forbs to lose vigor or disappear from the community completely.
Cheatgrass and Russian thistle commonly establish on this site, and Tamarisk can become dominant when the site occurs near stream and drainage corridors. When the ecological processes are altered due to improper grazing, prolonged drought, altered fire regime, invasive species dominance, or other disturbances, alternative states can occur that differ from the historic reference state in both plant community structure and ecological function. In areas where irrigation is possible and salinity problems are addressed, this site has been used for cropland with mixed success.State and transition model
Custom diagramStandard diagram
Figure 4. State-and-Transition Model
More interactive model formats are also available. View Interactive Models
More interactive model formats are also available. View Interactive Models
Click on state and transition labels to scroll to the respective textState 1 submodel, plant communities
State 2 submodel, plant communities
State 3 submodel, plant communities
State 4 submodel, plant communities
State 1
Reference StateThe reference state contains plant communities presumed to occur on the Alkali Bottom site prior to the introduction of non-native plants, livestock grazing, and other modern disturbances. The reference state is generally dominated by greasewood and deep-rooted perennial bunchgrasses. Greasewood harvests salts from the soil profile and concentrates them in its leaves. As a result, salts are deposited on the soil surface when the leaves are dropped or burned, which increases salinity and pH under greasewood plants. Seepweed commonly establishes in the harsh soils under greasewood plants, while perennial grasses and forbs tend to dominate the spaces between shrubs.
Invasive plant species, particularly cheatgrass and Russian thistle, can establish on the site given a seed source and germination sites in disturbed soil. These invasive annuals require little or no disturbance to establish. Once invasive plants establish, return to the reference state may not be possible.Community 1.1
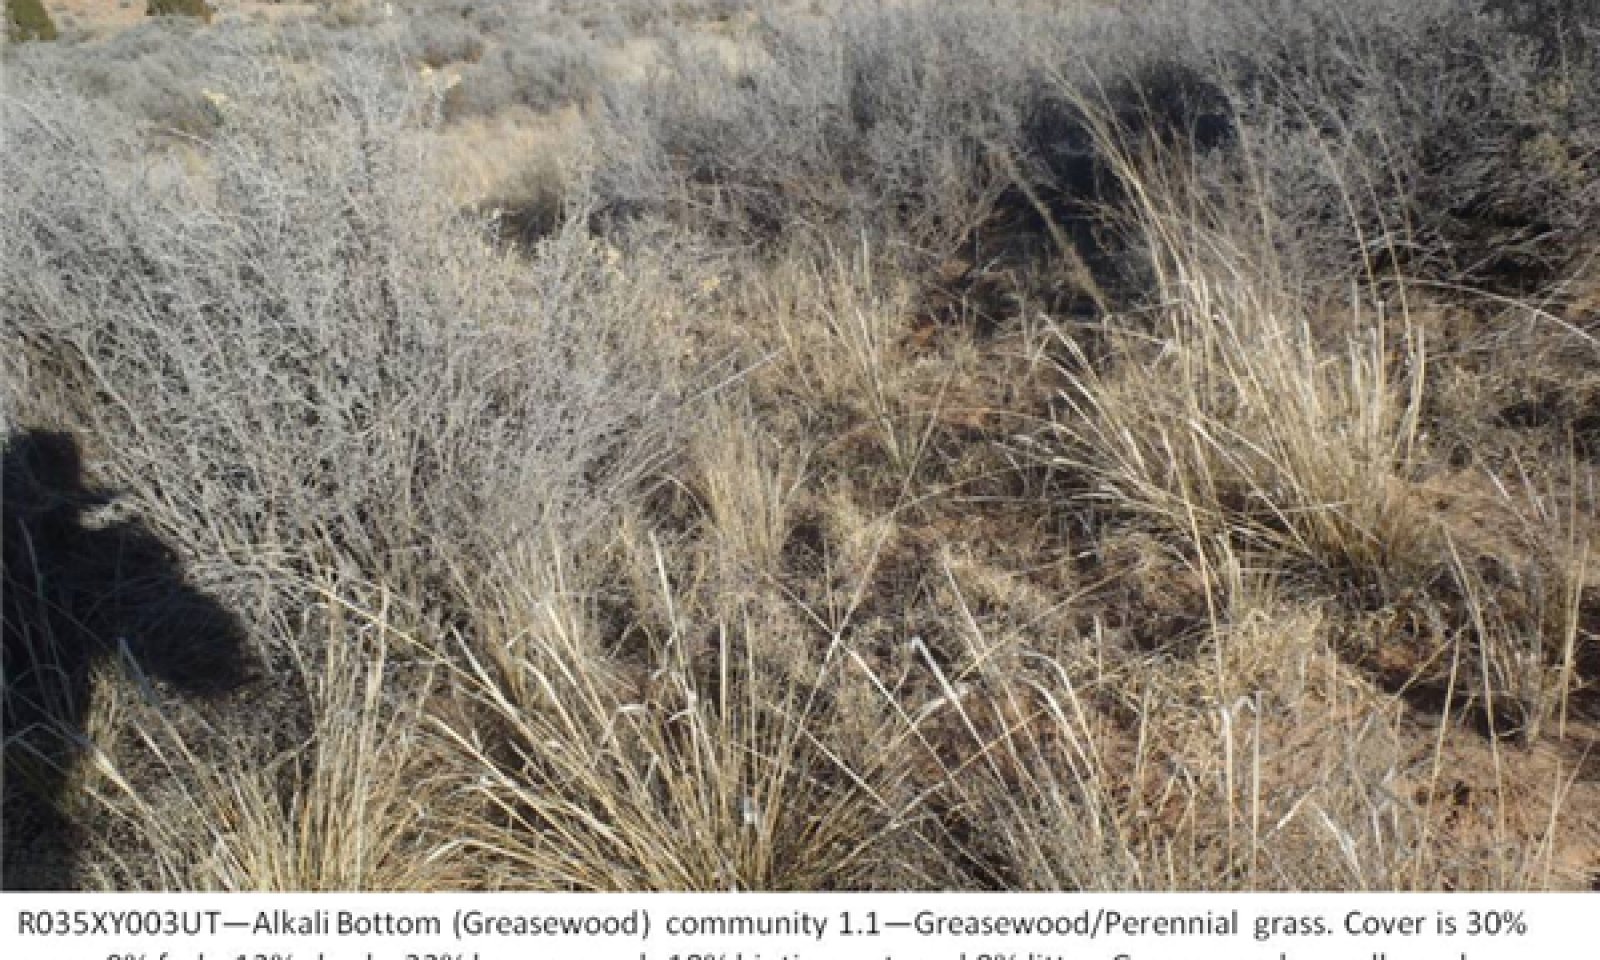
Greasewood/Perennial grass
Figure 5. Phase 1.1
Community phase 1.1 is characterized by a greasewood canopy with diverse perennial grasses and forbs in the interspaces. The fire-return interval for this phase is 35-100 years, which triggers vigorous re-sprouting of greasewood and perennial grasses within one year following fire. Composition by air-dry weight is 40-60% grasses, 5-15% forbs, and 25-50% shrubs.
Figure 6. Annual production by plant type (representative values) or group (midpoint values)
Table 5. Annual production by plant type
Plant type Low
(lb/acre)Representative value
(lb/acre)High
(lb/acre)Grass/Grasslike 250 350 500 Shrub/Vine 150 250 350 Forb 25 50 75 Total 425 650 925 Table 6. Ground cover
Tree foliar cover 0% Shrub/vine/liana foliar cover 20-30% Grass/grasslike foliar cover 10-30% Forb foliar cover 10-10% Non-vascular plants 0% Biological crusts 0-20% Litter 10-10% Surface fragments >0.25" and <=3" 0-10% Surface fragments >3" 0-0% Bedrock 0% Water 0% Bare ground 20-30% Table 7. Canopy structure (% cover)
Height Above Ground (ft) Tree Shrub/Vine Grass/
GrasslikeForb <0.5 – 0% 0-5% 0-5% >0.5 <= 1 – 0-5% 0-5% 0-5% >1 <= 2 – 5-10% 0-10% 0-2% >2 <= 4.5 – 0-20% 0-5% – >4.5 <= 13 – 0-20% – – >13 <= 40 – – – – >40 <= 80 – – – – >80 <= 120 – – – – >120 – – – – State 2
Invaded StateThe invaded state is similar to the reference state in composition and ecological function, but allows for non-native species to be present. It also includes an at-risk plant community with reduced perennial grass production. When perennial grasses are losing vigor and the ability to propagate themselves, this state is at risk of transitioning to the depleted understory state, which is not capable of recovering perennial grasses without significant management inputs.
Community 2.1
Greasewood/Perennial Grass
Figure 7. Phase 2.1
Phase 2.1 is similar to the reference plant community in composition and ecological function, but it allows for the presence of non-native/invasive species. It is dominated by greasewood and perennial grasses. Percent composition by air-dry weight is 30-60% perennial grasses, 5-15% forbs, and 25-55% shrubs.
Figure 8. Annual production by plant type (representative values) or group (midpoint values)
Table 8. Annual production by plant type
Plant type Low
(lb/acre)Representative value
(lb/acre)High
(lb/acre)Grass/Grasslike 250 350 500 Shrub/Vine 150 250 350 Forb 25 45 75 Total 425 645 925 Table 9. Ground cover
Tree foliar cover 0% Shrub/vine/liana foliar cover 20-30% Grass/grasslike foliar cover 10-30% Forb foliar cover 10-10% Non-vascular plants 0% Biological crusts 0-20% Litter 10-10% Surface fragments >0.25" and <=3" 0-10% Surface fragments >3" 0-0% Bedrock 0% Water 0% Bare ground 20-30% Table 10. Canopy structure (% cover)
Height Above Ground (ft) Tree Shrub/Vine Grass/
GrasslikeForb <0.5 – 0-5% 0-5% 0-5% >0.5 <= 1 – 0-5% 0-5% 0-5% >1 <= 2 – 5-10% 0-10% 0-2% >2 <= 4.5 – 0-20% 0-5% – >4.5 <= 13 – 0-20% – – >13 <= 40 – – – – >40 <= 80 – – – – >80 <= 120 – – – – >120 – – – – Community 2.2
At-risk: Greasewood/Reduced perennial grass
Figure 9. Phase 2.2
This plant community is at-risk of crossing a threshold into the depleted understory state (state 3). Years of excessive grazing of perennial grasses during growth has favored non-native invasive species, primarily cheatgrass and/or Russian thistle, to co-dominate the understory. Prescribed grazing is required to improve the reproductive capability of perennial grasses and avoid the transition to state 3.
Figure 10. Annual production by plant type (representative values) or group (midpoint values)
Table 11. Annual production by plant type
Plant type Low
(lb/acre)Representative value
(lb/acre)High
(lb/acre)Shrub/Vine 200 350 500 Grass/Grasslike 125 175 225 Forb 25 75 125 Total 350 600 850 Table 12. Ground cover
Tree foliar cover 0% Shrub/vine/liana foliar cover 20-40% Grass/grasslike foliar cover 10-20% Forb foliar cover 10-30% Non-vascular plants 0% Biological crusts 0% Litter 0-20% Surface fragments >0.25" and <=3" 0-10% Surface fragments >3" 0-0% Bedrock 0% Water 0% Bare ground 20-50% Table 13. Canopy structure (% cover)
Height Above Ground (ft) Tree Shrub/Vine Grass/
GrasslikeForb <0.5 – 0-5% 0-5% 0-5% >0.5 <= 1 – 0-5% 0-5% 0-5% >1 <= 2 – 5-10% 0-10% 0-2% >2 <= 4.5 – 0-20% 0-5% – >4.5 <= 13 – 0-20% – – >13 <= 40 – – – – >40 <= 80 – – – – >80 <= 120 – – – – >120 – – – – Pathway 2.1a
Community 2.1 to 2.2
Greasewood/Perennial Grass
At-risk: Greasewood/Reduced perennial grassThis pathway occurs when perennial grasses are reduced in the understory due to excessive grazing during the growing period. Perennial grasses are losing their ability to propagate themselves, and non-native species may co-dominate the understory.
Pathway 2.2a
Community 2.2 to 2.1
At-risk: Greasewood/Reduced perennial grass
Greasewood/Perennial GrassPrescribed grazing that provides rest during the growth period for perennial grasses to improve their vigor and reproductive capacity.
State 3
Depleted Understory StateThe depleted understory state occurs when perennial grasses have been lost from the understory. Perennial forbs may also be reduced. Interspaces may be sparsely vegetated or dominated by Russian thistle or other annual invasive species. This state is not as capable of carrying fire due to a reduction in fine fules. As a result, greasewood may continue to increase as the understory continues to be reduced.
Community 3.1
Greasewood/Limited understory
Figure 11. Phase 3.1

Figure 12. 3.1 after tamarisk removal
Phase 3.1 is characterized by greasewood dominance and a sparse understory that results from continued overgrazing. Increased size and production of greasewood plants may result in increased soil salinity in surface layers, further reinforcing greaswood dominance on the site.
Community 3.2
Greasewood/Annual understory
Figure 13. Phase 3.2
This phase is dominated by greasewood in the overstory and annual grasses and/or forbs in the understory.
Pathway 3.1a
Community 3.1 to 3.2
Greasewood/Limited understory
Greasewood/Annual understoryRemoval of livestock may allow invasive annuals to dominate shrub interspaces.
Pathway 3.2a
Community 3.2 to 3.1
Greasewood/Annual understory
Greasewood/Limited understoryThis pathway occurs when livestock use reduces the annual invasive species between shrubs. It may also be reinforced by an increase in salt deposits on the soil surface from increased greasewood production.
State 4
Tamarisk StateThis state primarily occurs on low stream terraces. The stream provides a corridor for tamarisk invasion, which spreads throughout the alkali bottom on low stream terraces, eventually dominating the site.
Community 4.1
Greasewood-Tamarisk
Figure 14. Phase 4.1
This community phase is characterized by the establishment and persistence of tamarisk. Greasewood is co-dominant with tamarisk in this phase.
Figure 15. Annual production by plant type (representative values) or group (midpoint values)
Table 14. Annual production by plant type
Plant type Low
(lb/acre)Representative value
(lb/acre)High
(lb/acre)Shrub/Vine 300 450 600 Forb 100 175 250 Grass/Grasslike 25 75 200 Total 425 700 1050 Table 15. Ground cover
Tree foliar cover 0% Shrub/vine/liana foliar cover 10-20% Grass/grasslike foliar cover 0-10% Forb foliar cover 20-30% Non-vascular plants 0% Biological crusts 0% Litter 10-10% Surface fragments >0.25" and <=3" 0-10% Surface fragments >3" 0-0% Bedrock 40-60% Water 0% Bare ground 40-70% Table 16. Canopy structure (% cover)
Height Above Ground (ft) Tree Shrub/Vine Grass/
GrasslikeForb <0.5 – 0-5% 0-5% 0-5% >0.5 <= 1 – 0-10% 0-5% 0-15% >1 <= 2 – 0-5% 0-5% 0-10% >2 <= 4.5 – 0-5% – – >4.5 <= 13 – 5-10% – – >13 <= 40 – – – – >40 <= 80 – – – – >80 <= 120 – – – – >120 – – – – Community 4.2
Tamarisk Dominated
Figure 16. Phase 4.2
This community phase is characterized by dominance of tamarisk. Greasewood is not dominant in this phase, but may be present as a sub-dominant shrub. Invasive grasses and forbs are often present in this phase.
Figure 17. Annual production by plant type (representative values) or group (midpoint values)
Table 17. Annual production by plant type
Plant type Low
(lb/acre)Representative value
(lb/acre)High
(lb/acre)Shrub/Vine 200 300 400 Forb 100 175 250 Grass/Grasslike 25 100 150 Total 325 575 800 Table 18. Ground cover
Tree foliar cover 0% Shrub/vine/liana foliar cover 10-20% Grass/grasslike foliar cover 10-10% Forb foliar cover 30-40% Non-vascular plants 0% Biological crusts 0% Litter 10-20% Surface fragments >0.25" and <=3" 0-10% Surface fragments >3" 0-0% Bedrock 40-60% Water 0% Bare ground 20-30% Table 19. Canopy structure (% cover)
Height Above Ground (ft) Tree Shrub/Vine Grass/
GrasslikeForb <0.5 – 0-5% 0-5% 0-10% >0.5 <= 1 – 0-5% 0-5% 0-20% >1 <= 2 – 0-5% 0-5% 0-10% >2 <= 4.5 – 0-10% – – >4.5 <= 13 – 5-10% – – >13 <= 40 – – – – >40 <= 80 – – – – >80 <= 120 – – – – >120 – – – – Pathway 4.1a
Community 4.1 to 4.2
Greasewood-Tamarisk
Tamarisk DominatedThis pathway occurs without disturbance, but may occur more quickly with major disturbaces such as fire, heavy livestock grazing, or a combination of the two.
Pathway 4.2a
Community 4.2 to 4.1
Tamarisk Dominated
Greasewood-TamariskThis community pathway may occur with tamarisk control efforts, either mechanical or biological. The saltcedar leaf beetle (Diorhabda elongata)can cause enough stress to kill tamarisk in 5-7 years (Richman, Biological Control Field Guide for Utah).
Transition T1
State 1 to 2Establishment and persistence of non-native species results in a transition from the reference state to the invaded state.
Transition T2a
State 2 to 3This transition occurs when perennial grasses are reduced by improper grazing to the point that they can no longer self-propagate. Few remnant plants may still persist under shrubs, but re-establishment and dominance by perennial grasses will not occur following a fire, or with the removal of livestock grazing.
Transition T2b
State 2 to 4This transition only occurs when the site is on low stream terraces. The stream provides a corridor for tamarisk invasion, which spreads to low terraces dominated by greasewood.
Transition T3a
State 3 to 4This transition most commonly occurs when the site is on low stream terraces. The stream provides a corridor for tamarisk invasion, which spreads to greasewood-dominated floodplains.
Restoration pathway R4
State 4 to 3This community pathway may occur with tamarisk control efforts, either mechanical or biological. The saltcedar leaf beetle (Diorhabda elongata)can cause enough stress to kill tamarisk in 5-7 years (Richman, Biological Control Field Guide for Utah).
Additional community tables
Table 20. Community 1.1 plant community composition
Group Common name Symbol Scientific name Annual production () Foliar cover (%) Shrub/Vine0 Dominant Shrub 125–275 greasewood SAVE4 Sarcobatus vermiculatus 100–200 10–20 fourwing saltbush ATCA2 Atriplex canescens 0–75 0–10 3 Sub-Dominant Shrubs 0–75 basin big sagebrush ARTRT Artemisia tridentata ssp. tridentata 0–50 0–5 Shrub, other 2S Shrub, other 0–30 0–2 shadscale saltbush ATCO Atriplex confertifolia 0–25 0–3 broom snakeweed GUSA2 Gutierrezia sarothrae 0–15 0–1 Torrey's jointfir EPTO Ephedra torreyana 0–10 0–2 plains pricklypear OPPO Opuntia polyacantha 0–5 0–2 winterfat KRLA2 Krascheninnikovia lanata 0–5 0–1 rubber rabbitbrush ERNA10 Ericameria nauseosa 0–5 0–1 valley saltbush ATCU Atriplex cuneata 0–5 0–1 Grass/Grasslike0 Dominant Grasses 200–450 alkali sacaton SPAI Sporobolus airoides 0–120 0–8 spike dropseed SPCO4 Sporobolus contractus 0–120 0–8 sand dropseed SPCR Sporobolus cryptandrus 0–120 0–8 mesa dropseed SPFL2 Sporobolus flexuosus 0–120 0–8 Indian ricegrass ACHY Achnatherum hymenoides 10–120 0–8 needle and thread HECO26 Hesperostipa comata 0–120 0–8 James' galleta PLJA Pleuraphis jamesii 10–100 0–6 1 Sub-Dominant Grasses 50–100 Grass, perennial 2GP Grass, perennial 10–50 1–5 blue grama BOGR2 Bouteloua gracilis 0–30 0–2 sixweeks fescue VUOC Vulpia octoflora 1–20 0–2 purple threeawn ARPU9 Aristida purpurea 0–20 0–1 saltgrass DISP Distichlis spicata 0–10 0–1 squirreltail ELEL5 Elymus elymoides 0–5 0–1 Forb2 Forbs 25–75 Mojave seablite SUMO Suaeda moquinii 0–50 0–5 Forb, annual 2FA Forb, annual 5–25 – Forb, perennial 2FP Forb, perennial 5–25 – tansymustard DESCU Descurainia 0–12 0–2 thicksepal cryptantha CRCR3 Cryptantha crassisepala 0–10 0–3 sand gilia ALLE7 Aliciella leptomeria 0–10 0–2 primrose PRIMU Primula 0–10 1–2 pale evening primrose OEPA Oenothera pallida 0–10 0–1 madwort ALYSS Alyssum 0–8 0–6 common pepperweed LEDE Lepidium densiflorum 0–8 0–2 snowball sand verbena ABFR2 Abronia fragrans 0–8 0–1 cryptantha CRYPT Cryptantha 3–6 0–2 gilia GILIA Gilia 0–6 0–1 scrambled eggs COAU2 Corydalis aurea 0–5 0–2 ragwort SENEC Senecio 0–5 0–2 Townsend daisy TOWNS Townsendia 0–5 0–1 woolly plantain PLPA2 Plantago patagonica 0–5 0–1 yellow spiderflower CLLU2 Cleome lutea 0–3 0–1 longbeak streptanthella STLO4 Streptanthella longirostris 0–2 0–1 Table 21. Community 2.1 plant community composition
Group Common name Symbol Scientific name Annual production () Foliar cover (%) Shrub/Vine0 Dominant Shrub 125–275 greasewood SAVE4 Sarcobatus vermiculatus 100–200 10–20 fourwing saltbush ATCA2 Atriplex canescens 0–75 0–10 3 Sub-dominant Shrubs 0–75 basin big sagebrush ARTRT Artemisia tridentata ssp. tridentata 0–50 0–5 Shrub, other 2S Shrub, other 0–30 0–3 shadscale saltbush ATCO Atriplex confertifolia 0–25 0–3 broom snakeweed GUSA2 Gutierrezia sarothrae 0–15 0–1 Torrey's jointfir EPTO Ephedra torreyana 0–10 0–2 plains pricklypear OPPO Opuntia polyacantha 0–5 0–2 winterfat KRLA2 Krascheninnikovia lanata 0–5 0–1 rubber rabbitbrush ERNA10 Ericameria nauseosa 0–5 0–1 valley saltbush ATCU Atriplex cuneata 0–5 0–1 Grass/Grasslike0 Dominant Grasses 200–450 Indian ricegrass ACHY Achnatherum hymenoides 10–120 0–8 needle and thread HECO26 Hesperostipa comata 0–120 0–8 alkali sacaton SPAI Sporobolus airoides 0–120 0–8 spike dropseed SPCO4 Sporobolus contractus 0–120 0–8 sand dropseed SPCR Sporobolus cryptandrus 0–120 0–8 mesa dropseed SPFL2 Sporobolus flexuosus 0–120 0–8 James' galleta PLJA Pleuraphis jamesii 10–100 0–6 1 Sub-dominant Grasses 50–100 Grass, perennial 2GP Grass, perennial 10–50 1–5 blue grama BOGR2 Bouteloua gracilis 0–30 0–3 cheatgrass BRTE Bromus tectorum 0–30 0–3 sixweeks fescue VUOC Vulpia octoflora 1–20 0–2 purple threeawn ARPU9 Aristida purpurea 0–20 0–1 saltgrass DISP Distichlis spicata 0–10 0–1 squirreltail ELEL5 Elymus elymoides 0–5 0 Forb2 Forbs 25–75 prickly Russian thistle SATR12 Salsola tragus 0–50 0–8 Forb, annual 2FA Forb, annual 5–40 0–3 Forb, perennial 2FP Forb, perennial 5–25 0–2 saltlover HALOG Halogeton 0–20 0–5 tansymustard DESCU Descurainia 0–12 0–2 Mojave seablite SUMO Suaeda moquinii 0–12 1–2 thicksepal cryptantha CRCR3 Cryptantha crassisepala 0–10 0–3 sand gilia ALLE7 Aliciella leptomeria 0–10 0–2 primrose PRIMU Primula 0–10 1–2 pale evening primrose OEPA Oenothera pallida 0–10 0–1 madwort ALYSS Alyssum 0–8 0–6 common pepperweed LEDE Lepidium densiflorum 0–8 0–2 snowball sand verbena ABFR2 Abronia fragrans 0–8 0–1 cryptantha CRYPT Cryptantha 3–6 0–2 gilia GILIA Gilia 0–6 0–1 scrambled eggs COAU2 Corydalis aurea 0–5 0–2 ragwort SENEC Senecio 0–5 0–2 woolly plantain PLPA2 Plantago patagonica 0–5 0–1 Townsend daisy TOWNS Townsendia 0–5 0–1 redstem stork's bill ERCI6 Erodium cicutarium 0–5 0 yellow spiderflower CLLU2 Cleome lutea 0–3 0–1 longbeak streptanthella STLO4 Streptanthella longirostris 0–2 0–1 Table 22. Community 2.2 plant community composition
Group Common name Symbol Scientific name Annual production () Foliar cover (%) Shrub/Vine0 Dominant Shrubs 200–500 greasewood SAVE4 Sarcobatus vermiculatus 200–500 15–25 fourwing saltbush ATCA2 Atriplex canescens 0–75 0–10 3 Sub-Dominant Shrubs 0–75 basin big sagebrush ARTRT Artemisia tridentata ssp. tridentata 0–50 0–5 rubber rabbitbrush ERNA10 Ericameria nauseosa 0–35 0–3 shadscale saltbush ATCO Atriplex confertifolia 0–25 0–3 broom snakeweed GUSA2 Gutierrezia sarothrae 0–15 0–1 Torrey's jointfir EPTO Ephedra torreyana 0–10 0–2 plains pricklypear OPPO Opuntia polyacantha 0–5 0–2 winterfat KRLA2 Krascheninnikovia lanata 0–5 0–1 valley saltbush ATCU Atriplex cuneata 0–5 0–1 Grass/Grasslike0 Dominant Grasses 100–225 needle and thread HECO26 Hesperostipa comata 0–60 0–4 James' galleta PLJA Pleuraphis jamesii 0–60 0–4 alkali sacaton SPAI Sporobolus airoides 0–60 0–4 spike dropseed SPCO4 Sporobolus contractus 0–60 0–4 sand dropseed SPCR Sporobolus cryptandrus 0–60 0–4 mesa dropseed SPFL2 Sporobolus flexuosus 0–60 0–4 Indian ricegrass ACHY Achnatherum hymenoides 0–30 0–3 cheatgrass BRTE Bromus tectorum 0–30 0–1 1 Sub-dominant Grasses 25–75 cheatgrass BRTE Bromus tectorum 0–40 0–3 Grass, perennial 2GP Grass, perennial 0–30 0–3 blue grama BOGR2 Bouteloua gracilis 0–30 0–3 squirreltail ELEL5 Elymus elymoides 0–20 0–2 purple threeawn ARPU9 Aristida purpurea 0–20 0–1 saltgrass DISP Distichlis spicata 0–10 0–1 sixweeks fescue VUOC Vulpia octoflora 1–10 0–1 Forb2 Forbs 25–125 prickly Russian thistle SATR12 Salsola tragus 25–125 5–15 tansymustard DESCU Descurainia 0–50 0–3 Forb, annual 2FA Forb, annual 5–40 0–2 saltlover HALOG Halogeton 0–20 0–5 Forb, perennial 2FP Forb, perennial 5–15 0–1 Mojave seablite SUMO Suaeda moquinii 0–12 1–2 thicksepal cryptantha CRCR3 Cryptantha crassisepala 0–10 0–3 sand gilia ALLE7 Aliciella leptomeria 0–10 0–2 primrose PRIMU Primula 0–10 1–2 pale evening primrose OEPA Oenothera pallida 0–10 0–1 common pepperweed LEDE Lepidium densiflorum 0–8 0–2 madwort ALYSS Alyssum 0–8 0–1 snowball sand verbena ABFR2 Abronia fragrans 0–8 0–1 cryptantha CRYPT Cryptantha 0–6 0–1 gilia GILIA Gilia 0–6 0–1 scrambled eggs COAU2 Corydalis aurea 0–5 0–2 ragwort SENEC Senecio 0–5 0–2 Townsend daisy TOWNS Townsendia 0–5 0–1 woolly plantain PLPA2 Plantago patagonica 0–5 0–1 burningbush BASC5 Bassia scoparia 0–5 0–1 yellow spiderflower CLLU2 Cleome lutea 0–3 0–1 longbeak streptanthella STLO4 Streptanthella longirostris 0–2 0–1 Table 23. Community 3.1 plant community composition
Group Common name Symbol Scientific name Annual production () Foliar cover (%) Table 24. Community 3.2 plant community composition
Group Common name Symbol Scientific name Annual production () Foliar cover (%) Table 25. Community 4.1 plant community composition
Group Common name Symbol Scientific name Annual production () Foliar cover (%) Shrub/Vine0 Dominant Shrubs 275–575 greasewood SAVE4 Sarcobatus vermiculatus 140–200 10–15 five-stamen tamarisk TACH2 Tamarix chinensis 100–200 10–15 James' galleta PLJA Pleuraphis jamesii 0–60 0–6 sixweeks fescue VUOC Vulpia octoflora 12–30 1–2 purple threeawn ARPU9 Aristida purpurea 0–20 0–1 3 Sub-Dominant Shrubs 0–25 Shrub, other 2S Shrub, other 5–25 0–2 plains pricklypear OPPO Opuntia polyacantha 0–5 0–5 basin big sagebrush ARTRT Artemisia tridentata ssp. tridentata 0–5 0–1 Torrey's jointfir EPTO Ephedra torreyana 0–2 0–1 rubber rabbitbrush ERNA10 Ericameria nauseosa 0–2 0–1 broom snakeweed GUSA2 Gutierrezia sarothrae 0–1 0–1 Grass/Grasslike0 Grasses 25–200 Grass, perennial 2GP Grass, perennial 0–150 0–5 cheatgrass BRTE Bromus tectorum 0–50 0–2 Forb2 Forbs 100–250 prickly Russian thistle SATR12 Salsola tragus 0–150 0–15 povertyweed IVAX Iva axillaris 0–140 0–30 Mojave seablite SUMO Suaeda moquinii 0–140 1–2 Bartlett daisy BASC Bartlettia scaposa 0–100 0–15 Forb, annual 2FA Forb, annual 35–80 – Forb, perennial 2FP Forb, perennial 35–80 – saltlover HALOG Halogeton 0–20 0–5 tansymustard DESCU Descurainia 0–12 0–2 thicksepal cryptantha CRCR3 Cryptantha crassisepala 0–10 0–3 sand gilia ALLE7 Aliciella leptomeria 0–10 0–2 primrose PRIMU Primula 0–10 1–2 pale evening primrose OEPA Oenothera pallida 0–10 0–1 madwort ALYSS Alyssum 0–8 0–6 common pepperweed LEDE Lepidium densiflorum 0–8 0–2 snowball sand verbena ABFR2 Abronia fragrans 0–8 0–1 cryptantha CRYPT Cryptantha 3–6 0–2 gilia GILIA Gilia 0–6 0–1 scrambled eggs COAU2 Corydalis aurea 0–5 0–2 ragwort SENEC Senecio 0–5 0–2 Townsend daisy TOWNS Townsendia 0–5 0–1 woolly plantain PLPA2 Plantago patagonica 0–5 0–1 yellow spiderflower CLLU2 Cleome lutea 0–3 0–1 longbeak streptanthella STLO4 Streptanthella longirostris 0–2 0–1 Table 26. Community 4.2 plant community composition
Group Common name Symbol Scientific name Annual production () Foliar cover (%) Shrub/Vine0 Dominant Shrub 150–350 five-stamen tamarisk TACH2 Tamarix chinensis 150–350 10–30 James' galleta PLJA Pleuraphis jamesii 0–60 0–6 sixweeks fescue VUOC Vulpia octoflora 0–30 1–2 purple threeawn ARPU9 Aristida purpurea 0–20 0–1 3 Sub-Dominant Shrubs 0–50 greasewood SAVE4 Sarcobatus vermiculatus 0–50 0–5 Shrub, other 2S Shrub, other 0–20 0–2 Grass/Grasslike0 Grasses 25–150 Grass, perennial 2GP Grass, perennial 25–125 – cheatgrass BRTE Bromus tectorum 0–50 0–3 Forb2 Forbs 100–250 prickly Russian thistle SATR12 Salsola tragus 0–150 0–15 povertyweed IVAX Iva axillaris 0–140 0–30 Mojave seablite SUMO Suaeda moquinii 0–140 1–2 Bartlett daisy BASC Bartlettia scaposa 0–100 0–15 Forb, annual 2FA Forb, annual 35–80 – Forb, perennial 2FP Forb, perennial 35–80 – saltlover HALOG Halogeton 0–20 0–5 tansymustard DESCU Descurainia 0–12 0–2 thicksepal cryptantha CRCR3 Cryptantha crassisepala 0–10 0–3 sand gilia ALLE7 Aliciella leptomeria 0–10 0–2 primrose PRIMU Primula 0–10 1–2 pale evening primrose OEPA Oenothera pallida 0–10 0–1 madwort ALYSS Alyssum 0–8 0–6 common pepperweed LEDE Lepidium densiflorum 0–8 0–2 snowball sand verbena ABFR2 Abronia fragrans 0–8 0–1 cryptantha CRYPT Cryptantha 3–6 0–2 gilia GILIA Gilia 0–6 0–1 scrambled eggs COAU2 Corydalis aurea 0–5 0–2 ragwort SENEC Senecio 0–5 0–2 Townsend daisy TOWNS Townsendia 0–5 0–1 woolly plantain PLPA2 Plantago patagonica 0–5 0–1 yellow spiderflower CLLU2 Cleome lutea 0–3 0–1 longbeak streptanthella STLO4 Streptanthella longirostris 0–2 0–1 Interpretations
Animal community
This site is suited to sheep and cattle during fall, winter, and spring. This site provides food and cover for wildlife. Wildlife using this site includes jackrabbit, coyote, bobcat, ferruginous hawk, kangaroo rat, mice and snake.
Hydrological functions
The soil is in hydrologic group a. The hydrologic curve numbers range from 49 to 68 depending on hydrologic condition of the waterdhed.
Recreational uses
Recreation uses in this site are hiking and hunting. Natural beauty values are found in the botanical diversity of the vegetation. Trafficability over unsurfaced roads is only fair because of the frequency of flooding and the deep gullies and stream channels.
Wood products
None
Other information
The following references explain management options for greasewood:
Ogle, D., Benson, B., Tilley, D., St. John, L., Green, S., and Briggs, J. (2007, February 07). Plant guide to black greasewood. Retrieved from ftp://ftp-fc.sc.egov.usda.gov/ID/programs/plant/black_greasewood_pg.pdf
Benson, B., Ogle, D., Tilley, D., and St. John, L. (2007, February 01). Technical note: Managing black greasewood sites. Retrieved from ftp://ftp-fc.sc.egov.usda.gov/ID/programs/technotes/black_greasewood.pdf
Supporting information
Other references
Anderson, Michelle D. 2004. Sarcobatus vermiculatus. In: Fire Effects Information System, [Online]. U.S. Department of Agriculture, Forest Service, Rocky Mountain Research Station, Fire Sciences Laboratory (Producer). Available: http://www.fs.fed.us/database/feis/ [].
General Description: Comb wash, Dirty Devil River, and Hackberry Creek
Richman, Amber. Biological Control Fieldguide for Utah. USDA-APHIS-PPQ.
Utah Climate Summaries. 2008. Available: http://www.wrcc.dri.edu/summary/climsmut.html. Accessed on February 25, 2008.
San Juan: Bankard Family – modal not in this site.
Henry Mountains: Glenberg Family – Alluvial floodplains of the Fremont, Muddy and Dirty Devil Rivers (modal not in this site)
Grand Staircase: Billings – near the Paria River in the Cockscomb area, along the Cottonwood Road. (Modal – Latitude: 37° 8’ 28.46” N Longitude: 111° 55’ 1.95” W) Jocity, saline – near the Paria River in the Cockscomb area, along the Cottonwood Road. (Modal – Latitude: 37° 10’ 46.22” N Longitude: 111° 54’ 47.72” W) Suwanee, saline – N of Hwy. 89 in the Paria River drainage, near the Paria Town Site; W of Big Water along Highway 89 in the Kitchen Corral Wash drainage; NE of Big Water in the Rogers Canyon Drainage on Fiftymile Mountain and drainages on Window Sash Bench; N of Big Water in drainages around Long Flat; SE of Escalante in the headwaters of the Alvey Wash and Wahweap Creek drainages; and in drainages NE of Tropic, along Henderson Creek and North Creek. (Modal – Latitude: 37° 9’ 12.5” N Longitude: 112° 5’ 41.88” W)
Contributors
Jamin Johanson
Susanne Mayne
UnknownRangeland health reference sheet
Interpreting Indicators of Rangeland Health is a qualitative assessment protocol used to determine ecosystem condition based on benchmark characteristics described in the Reference Sheet. A suite of 17 (or more) indicators are typically considered in an assessment. The ecological site(s) representative of an assessment location must be known prior to applying the protocol and must be verified based on soils and climate. Current plant community cannot be used to identify the ecological site.
Author(s)/participant(s) Shane A. Green (NRCS), Robert D. Stager (BLM), Dana Truman (NRCS), Paul Curtis (BLM) and Randy Beckstrand (BLM). Contact for lead author shane.green@ut.usda.gov Date 09/10/2008 Approved by Approval date Composition (Indicators 10 and 12) based on Annual Production Indicators
-
Number and extent of rills:
Very minor rill development in sparsely vegetated areas. Rills present should be widely spaced, and not connected. Rill development will increase following large storm events, but rills heal within a few years through frost heaving. Rill development may increase where the site is adjacent to other sites that produce large amounts of runoff (i.e. steeper sites, slickrock, etc.) -
Presence of water flow patterns:
Few throughout the site. Flow patterns are usually sinuous and wind around perennial plant bases. They may be long (10 to 20 feet), and less than one foot wide, and spaced form 5 to 15 feet apart. They are stable with only minor evidence of deposition. Evidence of flow will increase somewhat on slopes greater than 3 percent. This site is periodically inundated with runoff water due to its physiographic location. During very high flow events in adjacent channels (lotic, wash, etc.), this site may act as a filter and trap sediment, sometimes up to a foot or more. -
Number and height of erosional pedestals or terracettes:
Plants may show very minor pedestalling where they are adjacent to water flow patterns, but there should never be any exposed roots. Terracettes should be very few and stable, occurring behind pieces of woody litter blocking water flow patterns. -
Bare ground from Ecological Site Description or other studies (rock, litter, lichen, moss, plant canopy are not bare ground):
20- 30% Ground cover is based on the first raindrop impact, and bare ground is the opposite of ground cover. Ground cover + bare ground = 100%. Poorly developed biological soil crust that is interpreted as functioning as bare ground and therefore would be susceptible to raindrop splash erosion should be recorded as bare ground. -
Number of gullies and erosion associated with gullies:
Present, but rare. They would usually be expected in the lowest part of the site where water flows concentrate and/or in locations where there are concentrated flows into the site from an adjacent site or watershed. Gullies should show some signs of active erosion often with steep side walls but the bottoms would be mostly stabilized with perennial vegetation. Gullies may show more indication of erosion as the slope gets greater than 3 percent, or as influenced by adjacent steep sites or watersheds that may be providing concentrated flow patterns. -
Extent of wind scoured, blowouts and/or depositional areas:
Very minor evidence of wind generated soil movement. Wind scoured (blowouts) and depositional areas are rarely present. If present they have muted features and are mostly stabilized with vegetation or with biological crust. -
Amount of litter movement (describe size and distance expected to travel):
Due to the natural periodic concentration of runoff in this site, water flow patterns would be expected to be common with associated visible evidence of litter movement. Often litter from adjacent sites or watershed s contribute to litter noted on site. Litter removal may occur in water flow patterns with deposition occurring at points of obstruction, especially following large storm events. Litter movement is expected to increase with slopes over 3 percent. -
Soil surface (top few mm) resistance to erosion (stability values are averages - most sites will show a range of values):
This site should have a soil stability rating of 2 or 3 under plant canopies and a rating of 2 to 3 in the interspaces using the soil stability kit test. The average should be 2-3. Surface texture varies from loamy sand to silty clay loam. Vegetation cover, litter, and surface rock reduce erosion. -
Soil surface structure and SOM content (include type of structure and A-horizon color and thickness):
Soil surface horizon is typically 3 to 11 inches deep. Structure is typically weak fine to medium granular. Color is typically light brownish gray (2.5Y6/2) reddish brown (5YR5/4). Use the specific information for the soil you are assessing found in the published soil survey to supplement this description. -
Effect of community phase composition (relative proportion of different functional groups) and spatial distribution on infiltration and runoff:
Vascular plants are expected to break raindrop impact and splash erosion. Spatial distribution of vascular plants slows runoff somewhat by obstructing surface flows to help create sinuous flow patterns that dissipate energy and allow time for some infiltration. With the physiographic location of the site being in channels, bottoms, floodplains, alluvial flats, stream terraces and valley floors, this site is one of the terminal accumulation sites for runoff water. As such, infiltration is naturally facilitated; however the amount of sodium in the soil will reduce the infiltration and facilitate puddling on the surface. Natural erosion would be expected in severe thunder storms or heavy spring runoff. When perennial grasses decrease, reducing ground cover and increasing bare ground, runoff is expected to increase and any associated infiltration reduced. -
Presence and thickness of compaction layer (usually none; describe soil profile features which may be mistaken for compaction on this site):
None. Due to this sites lower placement (bottoms etc.), it accumulates fine particles such as silts and clays. The associated blocky and massive structures formed from these soil textures often confer naturally occurring hard layers in the soil subsurface. These should not be considered to be compaction layers. -
Functional/Structural Groups (list in order of descending dominance by above-ground annual-production or live foliar cover using symbols: >>, >, = to indicate much greater than, greater than, and equal to):
Dominant:
Plant community 50-100 years following a disturbance: Sprouting Shrubs (i.e. Greasewood, rabbitbrush) > Perennial Bunch Grasses (i.e. Alkali sacaton, Bottlebrush squirreltail)Sub-dominant:
Plant community 50-100 years following a disturbance: Perennial Forbs (i.e. Shrubby seepweed) >= non-sprouting shrubs = rhizomatous grasses > annual forbsOther:
Functional/structural groups may appropriately contain non-native species if their ecological function is the same as the native species in the reference state (e.g. Crested wheatgrass, Intermediate wheatgrass, etc.) Biological soil crust is variable in its expression where present on this site and is measured as a component of ground cover. Perennial and annual forbs can be expected to vary widely in their expression in the plant community based upon departures from average growing conditions.Additional:
Assumed disturbance regime includes insects, very infrequent fire, and flooding that kills the non-sprouting shrub species. Temporal variability is caused by fires, droughts, insects, etc. and spatial variability is caused by adjacency to other sites that produce runoff, soil pH levels, and topography. Following a recent disturbance such as fire, drought, or insects that removes the woody vegetation, forbs and perennial grasses (herbaceous species) may dominate the community until the sprouting shrubs come back. If a disturbance has not occurred for an extended period of time, woody species may continue to increase crowding out the perennial herbaceous understory species. In either case, these conditions reflect a community phase within the reference state. -
Amount of plant mortality and decadence (include which functional groups are expected to show mortality or decadence):
During years with average to above average precipitation, there should be very little recent mortality or decadence apparent in either the shrubs or grasses. During severe (multi-year) drought that affects groundwater levels, up to 20% of the greasewood plants may die. Some mortality of bunchgrass and other shrubs may also occur during severe droughts. There may be partial mortality of individual bunchgrasses and other shrubs during less severe drought. -
Average percent litter cover (%) and depth ( in):
Litter cover (including under plants) nearly all of which should be fine litter. Depth should be 1 leaf thickness in the interspaces and up to ¼” under canopies. -
Expected annual annual-production (this is TOTAL above-ground annual-production, not just forage annual-production):
600-700 #/acre on an average year. -
Potential invasive (including noxious) species (native and non-native). List species which BOTH characterize degraded states and have the potential to become a dominant or co-dominant species on the ecological site if their future establishment and growth is not actively controlled by management interventions. Species that become dominant for only one to several years (e.g., short-term response to drought or wildfire) are not invasive plants. Note that unlike other indicators, we are describing what is NOT expected in the reference state for the ecological site:
Russian thistle, halogeton, mustard, filarie, other native and non-native annual forbs and cheatgrass. -
Perennial plant reproductive capability:
All perennial plants should have the ability to reproduce sexually or asexually in most years, except in drought years.
Print Options
Sections
Font
AAAAOther
PrintThe Ecosystem Dynamics Interpretive Tool is an information system framework developed by the USDA-ARS Jornada Experimental Range, USDA Natural Resources Conservation Service, and New Mexico State University.
Accessibility statement