Natural Resources
Conservation Service
-
Search


Major Land Resource Area or ecological site by name and/or ID.
PreviousSectionsNextGeneral information
Provisional. A provisional ecological site description has undergone quality control and quality assurance review. It contains a working state and transition model and enough information to identify the ecological site.
Click to explore map
Figure 1. Mapped extent
Areas shown in blue indicate the maximum mapped extent of this ecological site. Other ecological sites likely occur within the highlighted areas. It is also possible for this ecological site to occur outside of highlighted areas if detailed soil survey has not been completed or recently updated.
MLRA notes
Major Land Resource Area (MLRA): 035X–Colorado Plateau
This ecological site occurs in Common Resource Area 35.8 - the Colorado Plateau Ponderosa Pine Forests
The Common Resource Area occurs within the Colorado Plateau Physiographic Province. Elevations range from 6800 to 8500 feet and precipitation averages 17 to 25 inches per year. Vegetation includes ponderosa pine, white fir, aspen, pinyon, juniper, Gambel oak, big sagebrush, ceanothus, blue elderberry, muttongrass, upland sedge, and big wildrye, mountain muhly, Arizona fescue, pine dropseed, and blue grama. The soil temperature regime ranges from mesic to frigid and the soil moisture regime is typic ustic. This unit occurs within the Colorado Plateau Physiographic Province and is characterized by a sequence of flat to gently dipping sedimentary rocks eroded into plateaus, valleys and deep canyons. Sedimentary rock classes dominate the plateau with volcanic fields occurring for the most part near its margin.Table 1. Dominant plant species
Tree (1) Juniperus scopulorum
(2) Pinus ponderosaShrub (1) Quercus gambelii
Herbaceous (1) Poa pratensis
(2) Carex duriusculaPhysiographic features
This site occurs on plateaus, fan terraces, and structural benches. Slopes range from 0 to 15 percent. The site does not benefit significantly from run-on moisture from adjacent sites.
Table 2. Representative physiographic features
Landforms (1) Plateau
(2) Fan
(3) Structural bench
Flooding frequency None Ponding frequency None Elevation 6800 – 8500 ft Slope 0 – 15 % Aspect Aspect is not a significant factor Climatic features
Winter-Summer moisture ratios are typically 70:30 on the west side of this CRA and shift to 60:40 on the east side. Late spring is usually the driest period and early fall moisture can be sporadic. Summer rains fall from June through September; moisture originates in the Gulf of Mexico and creates convective, usually brief, intense thunderstorms. Cool season moisture from October through May tends to be frontal; it originates in the Pacific and the Gulf of California and falls in widespread storms with longer duration and lower intensity. Precipitation generally comes as snow from October into April. Snowpack can persist for 3-4 months, although it may disappear in exposed areas during prolonged dry weather. Summer daytime temperatures are typically 80-90 F but can exceed 95 F. Winter temperatures around 0 F are common and can reach -25 F.
Table 3 Representative climatic features
Frost-free period (average) 100 days Freeze-free period (average) 130 days Precipitation total (average) 30 in BarLineFigure 2. Monthly precipitation range
BarLineFigure 3. Monthly average minimum and maximum temperature
">Influencing water features
The soil moisture on this ecological site comes from precipitation. The site does not benefit significantly from run-on moisture. The loamy surface texture of the soil allows the site to capture the majority of the winter storms and the light to moderate summer storms if the site has good vegetative cover. Intense summer thunderstorms will produce runoff, reducing the amount of effective rainfall.
Soil features
Soils on this site are moderately deep to very deep sois formed in alluvium from sedimentary and basalt and sandstones. They have 1 - 4% organic matter. Surface textures range from very fine sandy loam to sandy clay loam.
Soil survey map unit components correlated to this ecological site include:
SSA-699 Hualapai/Havasupai Area MU 44;
SSA-713 Chinle Area MU 4001 Cumulic Endoaquolis, 4001 Typic Argiustolls, 5000 Dula;
SSA-715 Ft. Defiance Area AZ/NM MU's 115 Sponsellar family and 123 Tunitcha family
SSA-717 Shiprock Area AZ/NM MU's 706 Todacheene, 602 Bostwick and 614 Tuntsa.Table 4. Representative soil features
Parent material (1) Alluvium – limestone and sandstone
(2) Residuum – basalt
Surface texture (1) Gravelly loam
(2) Loam
(3) Fine sandy loam
Family particle size (1) Loamy
Drainage class Moderately well drained to well drained Permeability class Very slow to moderately rapid Soil depth 40 – 80 in Soil reaction (1:1 water)
(0-40in)6.6 – 7.8 Subsurface fragment volume <=3"
(Depth not specified)0 – 35 % Ecological dynamics
An ecological site is not a precise assemblage of species for which the proportions are the same from place to place or from year to year. In all plant communities, variability is apparent in productivity and occurrence of individual species. Spatial boundaries of the communities; however, can be recognized by characteristic patterns of species composition, association, and community structure. The historic climax plant community for this ecological site has been described by sampling relict or relatively undisturbed sites and/or reviewing historic records. The historic climax plant community is the plant community that evolved over time with the soil forming process and long term changes in climatic conditions of the area. It is the plant community that was best adapted to the unique combination of environmental factors associated with the site.
Natural disturbances, such as drought, fire, grazing of native fauna, and insects, are inherent in the development and maintenance of these plant communities. The effects of these disturbances are part of the range of characteristics of the ecological site. Fluctuations in plant community structure and function caused by the effects of natural disturbances help establish the boundaries and characteristics of an ecological site. They are accounted for as part of the range of characteristics of the ecological site. Recognizable plant community phases are identified in the reference state of the ecological site. Some sites may have a small range of variation, while others have a large range. Some plant community phases may exist for long periods of time, while others may only occur for a couple of years after a disturbance.
Deterioration of the plant community, hydrology, or soil site stability on an ecological site can result in crossing a threshold or potentially irreversible boundary to another state, or equilibrium. This can occur as a result of the loss of soil surface through erosion, the loss of the stability of the site due to disturbances that cause active erosion on the site, increases in the amounts and/or patterns or runoff from rainstorms, changes in availability of surface and subsurface water, significant changes in plant structural and functional types, or the introduction of non-native species. When these thresholds are crossed, the potential of the ecological site to return to the historic climax plant community can be lost, or restoration will require significant inputs . There may be multiple states possible for an ecological site, determined by the type and or severity of disturbance.
The known states and transition pathways for this ecological site are described in the state and transition model. Within each state, there may be one or more known plant community phases. These community phases describe the different plant community that can be recognized and mapped across this ecological site. The state and transition model is intended to help land users recognize the current plant community on the ecological site, and the management options for improving the plant community to the desired plant community.
Plant production information in this site description is standardized to the annual production on an air-dry weight basis in near normal rainfall years.
State and transition model
Custom diagramStandard diagram
Figure 4. 358 LoamyUpland S&T
More interactive model formats are also available. View Interactive Models
More interactive model formats are also available. View Interactive Models
Click on state and transition labels to scroll to the respective textEcosystem states
State 1 submodel, plant communities
State 1
Reference StateThis is open meadow grassland site with some forbs present. There may be some shrub and tree encroachment near the upland margins of the site. Also,there is the possibility of non-native plants on the site (cheatgrass).
Community 1.1
Grassland Plant Community
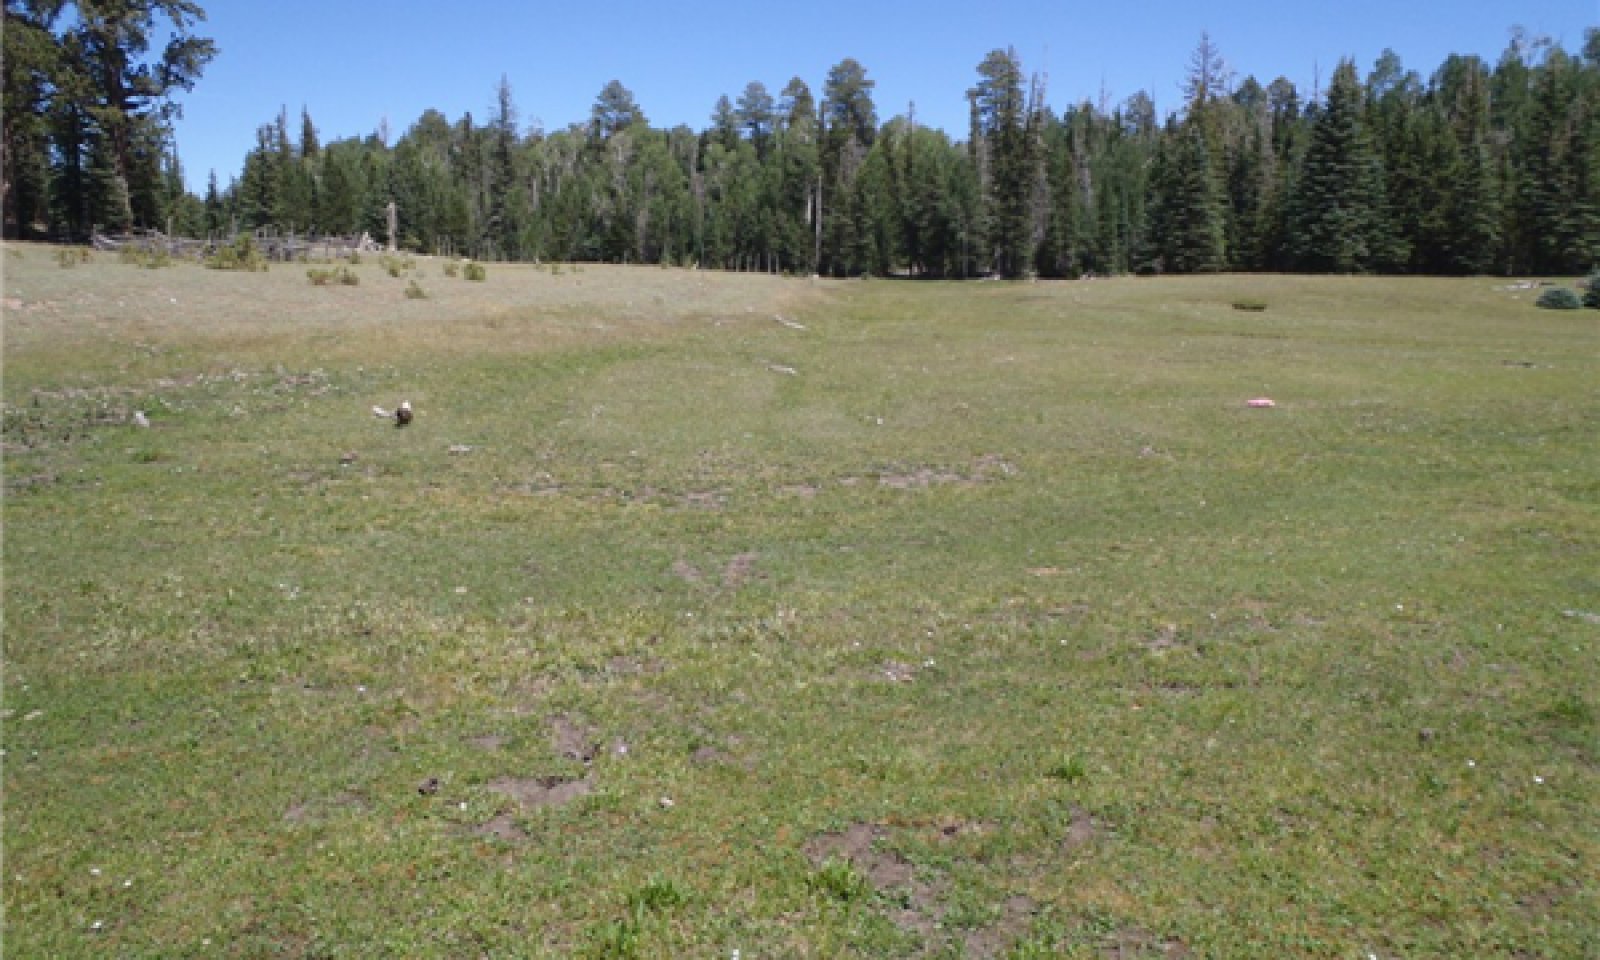
Figure 5. 35.8 Loamy Upland 17-25"p.z. R035XH807AZ - Grazed
1.1 This community is dominated by cool season grasses and a variety of forbs are present.
Figure 6. Annual production by plant type (representative values) or group (midpoint values)
Table 5. Annual production by plant type
Plant type Low
(lb/acre)Representative value
(lb/acre)High
(lb/acre)Grass/Grasslike 1100 1150 1235 Forb 70 85 110 Tree 15 40 70 Shrub/Vine 15 25 40 Total 1200 1300 1455 Community 1.2
Forb Dominated Plant CommunityDisturbance has reduced the grass componenet to the point that forbs increase and dominate the plant community.
There may be non-native plants on this site (cheatgrass).Pathway 1.1A
Community 1.1 to 1.2Drought, unmanaged grazing, and other disturbances will reduce the perennial grasses on the site and allow forbs to increase.
Pathway 1.2A
Community 1.2 to 1.1Grazing management and possible reseeding.
Additional community tables
Table 6. Community 1.1 plant community composition
Group Common name Symbol Scientific name Annual production () Foliar cover (%) Grass/Grasslike1 Grasses 1100–1235 Arizona fescue FEAR2 Festuca arizonica 150–350 – blue grama BOGR2 Bouteloua gracilis 0–200 – needleleaf sedge CADU6 Carex duriuscula 160–200 – Kentucky bluegrass POPR Poa pratensis 0–200 – mountain muhly MUMO Muhlenbergia montana 50–150 – muttongrass POFE Poa fendleriana 50–150 – Idaho fescue FEID Festuca idahoensis 0–150 – sheep fescue FEOV Festuca ovina 0–150 – pine dropseed BLTR Blepharoneuron tricholepis 50–150 – western wheatgrass PASM Pascopyrum smithii 0–125 – squirreltail ELELE Elymus elymoides ssp. elymoides 50–125 – prairie Junegrass KOMA Koeleria macrantha 20–100 – Canada bluegrass POCO Poa compressa 0–75 – little bluestem SCSC Schizachyrium scoparium 0–75 – spike muhly MUWR Muhlenbergia wrightii 10–50 – needle and thread HECOC8 Hesperostipa comata ssp. comata 0–40 – Forb2 Forbs 70–110 Forb, annual 2FA Forb, annual 0–20 – common yarrow ACMI2 Achillea millefolium 0–20 – rosy pussytoes ANRO2 Antennaria rosea 0–20 – milkvetch ASTRA Astragalus 0–20 – thistle CIRSI Cirsium 0–20 – buckwheat ERIOG Eriogonum 0–20 – pingue rubberweed HYRI Hymenoxys richardsonii 0–20 – Wright's deervetch LOWR Lotus wrightii 0–20 – lupine LUPIN Lupinus 0–20 – cinquefoil POTEN Potentilla 0–20 – common mullein VETH Verbascum thapsus 0–20 – Shrub/Vine3 Shrubs 15–40 Subshrub (<.5m) 2SUBS Subshrub (<.5m) 0–15 – rabbitbrush CHRYS9 Chrysothamnus 0–15 – snakeweed GUTIE Gutierrezia 0–15 – Tree4 Trees 15–70 ponderosa pine PIPO Pinus ponderosa 15–45 – alligator juniper JUDE2 Juniperus deppeana 0–25 – Utah juniper JUOS Juniperus osteosperma 0–25 – twoneedle pinyon PIED Pinus edulis 0–25 – Table 7. Community 1.2 plant community composition
Group Common name Symbol Scientific name Annual production () Foliar cover (%) Interpretations
Animal community
Site is favorable for grazing throughout most of the year except when snow cover restricts availability of forage. Planned grazing systems adapt well to use on this site.
The potential plant community produced by this site provides food for those species of wildlife that utilize grass as a major portion of their diet.Recreational uses
This site has a variety of spring and summer flowers which are particularly noticeable after good moisture periods. It has good aesthetic appeal when not severely disturbed.
Winters are cold, however, relatively mild spring, fall and summer months are attractive to recreationists. Recreational activities most likely to occur are hunting, cross-country riding, photography and wildlife observation.
Supporting information
Type locality
Location 1: San Juan County, NM Township/Range/Section T22N R19W S28 General legal description About 9.5 miles southwest of Sheep Springs, NM; alsoabout 8 miles northwest of Sanostee at Section 20, T26N, R20W. Other references
Updates and revisions for this ESD were conducted as part of a 2007-2012 Interagency Technical Assistance Agreement between the Bureau of Indian Affairs–Navajo Region and the NRCS-Arizona.
Contributors
Dan Carroll
Larry D. EllicottRangeland health reference sheet
Interpreting Indicators of Rangeland Health is a qualitative assessment protocol used to determine ecosystem condition based on benchmark characteristics described in the Reference Sheet. A suite of 17 (or more) indicators are typically considered in an assessment. The ecological site(s) representative of an assessment location must be known prior to applying the protocol and must be verified based on soils and climate. Current plant community cannot be used to identify the ecological site.
Author(s)/participant(s) Dan Carroll Contact for lead author State Rangeland Management Specialist - NRCS State Office - Phoenix, AZ Date 08/27/2012 Approved by Approval date Composition (Indicators 10 and 12) based on Annual Production Indicators
-
Number and extent of rills:
Generally, there are no rills present. There may be minor rill formation on steeper slopes (>15%) if there is bare ground present. -
Presence of water flow patterns:
Water flow patterns are few and scattered. They are short in length and compose only a small percentage of the site. -
Number and height of erosional pedestals or terracettes:
Any pedestals will be along water flow pathways next to perennial plants. -
Bare ground from Ecological Site Description or other studies (rock, litter, lichen, moss, plant canopy are not bare ground):
Bare ground is expected to be 20-35%. -
Number of gullies and erosion associated with gullies:
None expected. -
Extent of wind scoured, blowouts and/or depositional areas:
There can be some deposition around long lived perennial shrubs and grasses. -
Amount of litter movement (describe size and distance expected to travel):
Fine litter is transported by wind and water in open areas and coarse woody litter tends to stay in place. -
Soil surface (top few mm) resistance to erosion (stability values are averages - most sites will show a range of values):
Soil surface textures range from fine sandy loam to loam to clay loam. There may be gravels, cobbles or stones present on the soil surface and below. Permeability ranges from moderate to moderately slow. Infiltration rates are moderate. The erosion hazard is slight to moderate depending on slope. -
Soil surface structure and SOM content (include type of structure and A-horizon color and thickness):
The top soil horizon is 2” - 12” thick. Colors are dark and include black, gray and brown. Structures include moderate platy (medium and thick), medium granular (weak, moderate and strong) and weak subangular blocky (fine, medium and coarse) formations. -
Effect of community phase composition (relative proportion of different functional groups) and spatial distribution on infiltration and runoff:
This is a grassland dominated site with a high amount of production. The plant-soil moisture relationship is good. Infiltration rates are moderate and permeability is moderate on flatter slopes -
Presence and thickness of compaction layer (usually none; describe soil profile features which may be mistaken for compaction on this site):
None expected. -
Functional/Structural Groups (list in order of descending dominance by above-ground annual-production or live foliar cover using symbols: >>, >, = to indicate much greater than, greater than, and equal to):
Dominant:
Cool season grasses >>Sub-dominant:
Other:
Forbs>shrubs and treesAdditional:
-
Amount of plant mortality and decadence (include which functional groups are expected to show mortality or decadence):
All plant functional groups are adapted to survive in all years except during the most severe droughts. Severe winter drought affects shrubs and trees the most. Severe summer drought affects grasses the most. -
Average percent litter cover (%) and depth ( in):
This site is dominated by herbaceous litter with very little woody litter present. Litter amounts increase in the first years of drought and decrease in the later years of a drought. -
Expected annual annual-production (this is TOTAL above-ground annual-production, not just forage annual-production):
The median annual production for this site for an average year of precipitation ranges from 1000 to 1100 pounds per acre. -
Potential invasive (including noxious) species (native and non-native). List species which BOTH characterize degraded states and have the potential to become a dominant or co-dominant species on the ecological site if their future establishment and growth is not actively controlled by management interventions. Species that become dominant for only one to several years (e.g., short-term response to drought or wildfire) are not invasive plants. Note that unlike other indicators, we are describing what is NOT expected in the reference state for the ecological site:
Some of the plant species that are most likely to invade or increase on this site following disturbance are annual forbs, rabbitbrush, ponderosa pine and cheatgrass. -
Perennial plant reproductive capability:
All plant species native to this site are adapted to the climate and are capable of producing seeds, stolons and rhizomes in all but the most severe droughts.
Print Options
Sections
Font
AAAAOther
PrintThe Ecosystem Dynamics Interpretive Tool is an information system framework developed by the USDA-ARS Jornada Experimental Range, USDA Natural Resources Conservation Service, and New Mexico State University.
Accessibility statement