Natural Resources
Conservation Service
-
Search


Major Land Resource Area or ecological site by name and/or ID.
PreviousSectionsNextGeneral information
Provisional. A provisional ecological site description has undergone quality control and quality assurance review. It contains a working state and transition model and enough information to identify the ecological site.
Click to explore map
Figure 1. Mapped extent
Areas shown in blue indicate the maximum mapped extent of this ecological site. Other ecological sites likely occur within the highlighted areas. It is also possible for this ecological site to occur outside of highlighted areas if detailed soil survey has not been completed or recently updated.
MLRA notes
Major Land Resource Area (MLRA): 035X–Colorado Plateau
This ecological site occurs in Common Resource Area 35.6 - the Colorado Plateau Pinyon-Juniper-Sagebrush
The Common Resource Area occurs within the Colorado Plateau Physiographic Province. Elevations range from 5800 to 7300 feet and precipitation averages 13 to 17 inches per year. Vegetation includes pinyon, juniper, big sagebrush, cliffrose, Mormon tea, muttongrass, prairie junegrass, squirreltail, western wheatgrass, and blue grama. The soil temperature regime is mesic and the soil moisture regime is aridic ustic. This unit occurs within the Colorado Plateau Physiographic Province and is characterized by a sequence of flat to gently dipping sedimentary rocks eroded into plateaus, valleys and deep canyons. Sedimentary rock classes dominate the plateau with volcanic fields occurring for the most part near its margin.
Associated sites
F035XF627AZ Sandstone Upland (JUOS, PIED) 13-17" p.z. (Provisional)
Sandstone Upland 13-17" p.z. (JUOS, PIED)
Table 1. Dominant plant species
Tree Not specified
Shrub (1) Artemisia tridentata ssp. wyomingensis
(2) Purshia tridentataHerbaceous (1) Achnatherum hymenoides
(2) Bouteloua gracilisPhysiographic features
This site occurs on mostly level stabilized sand sheets and dunes that have formed on plateaus and mesas of sandstone geologic formations. The soils are deep with sandy textures througout the soil profile. Slopes range from 0 to 15 percent. The site is often intermingled with sandstone outcrops.
Table 2. Representative physiographic features
Landforms (1) Plateau
(2) Mesa
Flooding frequency None Ponding frequency None Elevation 5800 – 7300 ft Slope 0 – 15 % Ponding depth 0 in Water table depth 80 – 0 in Aspect Aspect is not a significant factor Climatic features
The climate of this land resource unit is semiarid with warm summers and cool winters. The mean annual precipitation ranges from 13 – 17 inches, but it is very erratic, often varying substantially from year to year. The majority of the precipitation comes from October through April. This precipitation comes as gentle rain or snow from frontal storms coming out of the Pacific Ocean. Snow is common from November through February. Generally no more than a few inches of snow accumulates, melting within a few days, but may last a week or more. The remaining precipitation comes from July through September as spotty, unreliable and sometimes violent thunderstorms. The moisture for this precipitation originates in the Gulf of Mexico (and the Pacific Ocean in the fall) and flows into the area on the north end of the Mexican monsoon. Late May through late June is generally a dry period. The mean annual air temperature ranges from 47 to 49 degrees Fahrenheit (F). The frost-free period (air temperature > 32 degrees F) ranges from 113 to 144 days (@ 50 percent probability). Strong winds are common, especially in the spring.
Table 3 Representative climatic features
Frost-free period (average) 140 days Freeze-free period (average) 160 days Precipitation total (average) 20 in BarLineFigure 2. Monthly precipitation range
BarLineFigure 3. Monthly average minimum and maximum temperature
">Influencing water features
The soil moisture on this ecological site comes from precipitation. The site does not benefit significantly from run-on moisture. The sandy surface texture of the soil allows the site to capture the majority of both gentle winter storms and intense summer thunderstorms with little runoff.
Soil features
The soils characterizing this site are moderately deep to deep and are well drained. Soil textures range from fine sand to coarse sand throughout the profile. Available water holding capacity is low to very low. Site occurs as sandsheets on structural benches. It is eolian sand..
Soil survey map unit components correlated to this ecological site include:
SSA-625 Mohave County NE part MU 52 Royosa; SSA-711 Navajo Mountain Area MU 4 Aridic Ustorthent & Royosa; MU 36 & 37 Pinepoint;
SSA-713 Chinle Area MU 40 Royosa;
SSA-715 Fort Defiance Area NM/AZ MU 103 Royosa.Table 4. Representative soil features
Parent material (1) Eolian sands – sandstone
Surface texture (1) Fine sand
(2) Sand
(3) Coarse sand
Family particle size (1) Sandy
Drainage class Somewhat excessively drained to excessively drained Permeability class Rapid to very rapid Soil depth 20 – 80 in Surface fragment cover <=3" Not specified Surface fragment cover >3" Not specified Available water capacity
(0-40in)1 – 5 in Calcium carbonate equivalent
(0-40in)Not specified Electrical conductivity
(0-40in)0 – 2 mmhos/cm Sodium adsorption ratio
(0-40in)Not specified Soil reaction (1:1 water)
(0-40in)6.6 – 7.8 Subsurface fragment volume <=3"
(Depth not specified)Not specified Subsurface fragment volume >3"
(Depth not specified)Not specified Ecological dynamics
An ecological site is not a precise assemblage of species for which the proportions are the same from place to place or from year to year. In all plant communities, variability is apparent in productivity and occurrence of individual species. Spatial boundaries of the communities; however, can be recognized by characteristic patterns of species composition, association, and community structure. The historic climax plant community for this ecological site has been described by sampling relict or relatively undisturbed sites and/or reviewing historic records. The historic climax plant community is the plant community that evolved over time with the soil forming process and long term changes in climatic conditions of the area. It is the plant community that was best adapted to the unique combination of environmental factors associated with the site.
Natural disturbances, such as drought, fire, grazing of native fauna, and insects, are inherent in the development and maintenance of these plant communities. The effects of these disturbances are part of the range of characteristics of the ecological site. Fluctuations in plant community structure and function caused by the effects of natural disturbances help establish the boundaries and characteristics of an ecological site. They are accounted for as part of the range of characteristics of the ecological site. Recognizable plant community phases are identified in the reference state of the ecological site. Some sites may have a small range of variation, while others have a large range. Some plant community phases may exist for long periods of time, while others may only occur for a couple of years after a disturbance.
Deterioration of the plant community, hydrology, or soil site stability on an ecological site can result in crossing a threshold or potentially irreversible boundary to another state, or equilibrium. This can occur as a result of the loss of soil surface through erosion, the loss of the stability of the site due to disturbances that cause active erosion on the site, increases in the amounts and/or patterns or runoff from rainstorms, changes in availability of surface and subsurface water, significant changes in plant structural and functional types, or the introduction of non-native species. When these thresholds are crossed, the potential of the ecological site to return to the historic climax plant community can be lost, or restoration will require significant inputs . There may be multiple states possible for an ecological site, determined by the type and or severity of disturbance.
The known states and transition pathways for this ecological site are described in the state and transition model. Within each state, there may be one or more known plant community phases. These community phases describe the different plant community that can be recognized and mapped across this ecological site. The state and transition model is intended to help land users recognize the current plant community on the ecological site, and the management options for improving the plant community to the desired plant community.
Plant production information in this site description is standardized to the annual production on an air-dry weight basis in near normal rainfall years.
State and transition model
Custom diagramStandard diagram
Figure 4. State and Transition Model - R035XF607AZ
More interactive model formats are also available. View Interactive Models
More interactive model formats are also available. View Interactive Models
Click on state and transition labels to scroll to the respective textEcosystem states
State 1 submodel, plant communities
State 2 submodel, plant communities
State 1
Reference StateCommunity 1.1
Mixed Shrub - Grassland (HCPC)
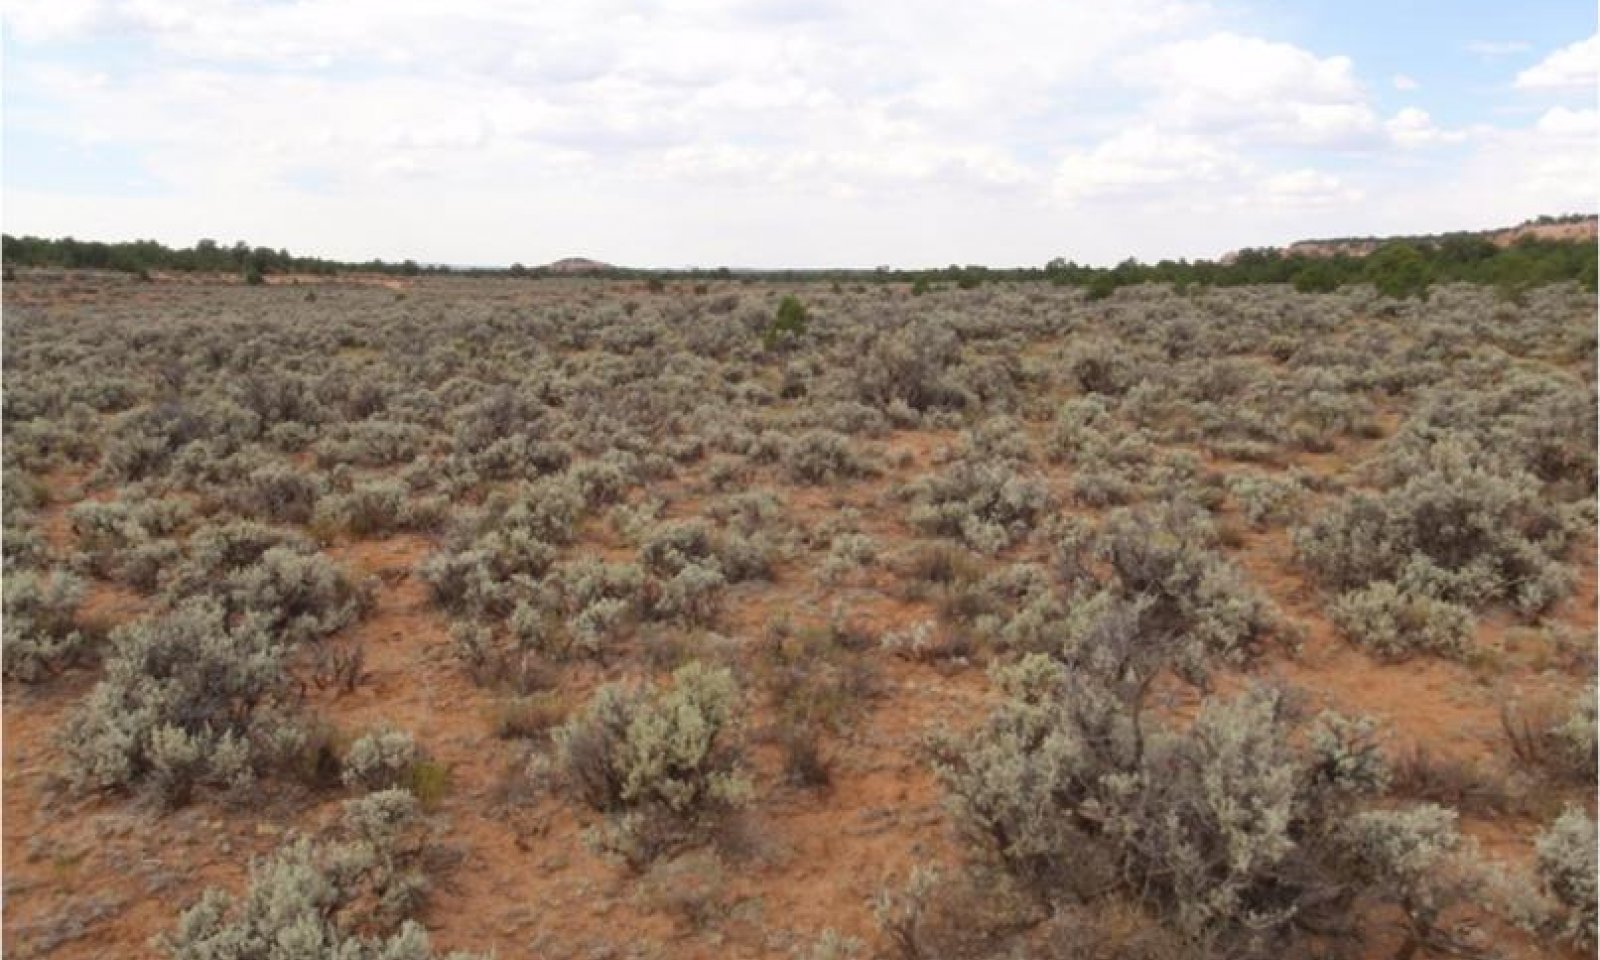
Figure 5. Sandy Upland 13-17" p.z.
The dominant aspect of this site is a mixed shrub-grassland. The major grasses are Indian ricegrass and muttongrass. The domimant shrubs are big sagebrush, antelope bitterbrush with occasional widely scattered trees,
Figure 6. Annual production by plant type (representative values) or group (midpoint values)
Table 5. Annual production by plant type
Plant type Low
(lb/acre)Representative value
(lb/acre)High
(lb/acre)Shrub/Vine 405 475 540 Grass/Grasslike 150 255 360 Forb 10 50 90 Tree 5 20 30 Total 570 800 1020 Table 6. Ground cover
Tree foliar cover 0-10% Shrub/vine/liana foliar cover 20-40% Grass/grasslike foliar cover 0-10% Forb foliar cover 0-10% Non-vascular plants 0% Biological crusts 0-20% Litter 10-20% Surface fragments >0.25" and <=3" 0% Surface fragments >3" 0% Bedrock 0% Water 0% Bare ground 20-40% Table 7. Soil surface cover
Tree basal cover 0-0% Shrub/vine/liana basal cover 0-10% Grass/grasslike basal cover 0-0% Forb basal cover 0-0% Non-vascular plants 0% Biological crusts 0% Litter 0% Surface fragments >0.25" and <=3" 0% Surface fragments >3" 0% Bedrock 0% Water 0% Bare ground 0% Table 8. Canopy structure (% cover)
Height Above Ground (ft) Tree Shrub/Vine Grass/
GrasslikeForb <0.5 – – – 0-1% >0.5 <= 1 – – 4-6% 0-1% >1 <= 2 – 1-10% 0-4% – >2 <= 4.5 – 15-25% – – >4.5 <= 13 0-5% – – – >13 <= 40 – – – – >40 <= 80 – – – – >80 <= 120 – – – – >120 – – – – Figure 7. Plant community growth curve (percent production by month). AZ3506 , 35.6 13-17" p.z. blue grama. Growth occurs mostly in summer and early fall during the rainy season..
Jan Feb Mar Apr May Jun Jul Aug Sep Oct Nov Dec J F M A M J J A S O N D 0 0 0 5 10 15 25 30 15 0 0 0 Figure 8. Plant community growth curve (percent production by month). AZ3561 , 35.6 13-17" p.z. all sites. Growth begins in the spring and continues into the fall..
Jan Feb Mar Apr May Jun Jul Aug Sep Oct Nov Dec J F M A M J J A S O N D 0 1 5 16 17 15 15 15 11 5 0 0 Figure 9. Plant community growth curve (percent production by month). AZ3565 , 35.6 13-17" p.z. needle and thread. Growth occurs mostly in the spring..
Jan Feb Mar Apr May Jun Jul Aug Sep Oct Nov Dec J F M A M J J A S O N D 0 0 5 40 40 5 0 0 5 5 0 0 Figure 10. Plant community growth curve (percent production by month). AZ3568 , Indian Ricegrass, 35-6, 13"-17" p.z.. Most Growth in Spring, Some Growth in Fall.
Jan Feb Mar Apr May Jun Jul Aug Sep Oct Nov Dec J F M A M J J A S O N D 0 0 10 50 30 0 0 0 5 5 0 0 Figure 11. Plant community growth curve (percent production by month). AZ3571 , Bottlebrush Squirreltail, 35-6, 13"-17" p.z.. Begins growth in late winter, stays green most winters..
Jan Feb Mar Apr May Jun Jul Aug Sep Oct Nov Dec J F M A M J J A S O N D 0 5 40 40 5 0 0 0 0 5 5 0 Figure 12. Plant community growth curve (percent production by month). AZ3572 , Mormon Tea, 35-6, 13"17" p.z.. Grows mainly in spring and early summer..
Jan Feb Mar Apr May Jun Jul Aug Sep Oct Nov Dec J F M A M J J A S O N D 0 0 5 25 25 20 15 10 0 0 0 0 Figure 13. Plant community growth curve (percent production by month). AZ3601 , 35.6 13-17" p.z. western wheatgrass. Growth begins in the spring and continues into fall during the rainy season..
Jan Feb Mar Apr May Jun Jul Aug Sep Oct Nov Dec J F M A M J J A S O N D 0 0 0 5 10 20 20 20 20 5 0 0 Figure 14. Plant community growth curve (percent production by month). AZ3602 , 35.6 13-17" p.z. muttongrass. Most growth occurs in early to mid spring, plants may be green in the fall. Seed set occurs by summer..
Jan Feb Mar Apr May Jun Jul Aug Sep Oct Nov Dec J F M A M J J A S O N D 0 0 10 20 30 15 5 5 10 5 0 0 Community 1.2
Sagebrush ShrublandThis site is cahracterized by a dominance of sagebrush along with other scattered shrubs, shrubs as mormom tea, snakeweed and rabbitbrush. Grasses are scattered with blue grama and squirreltail dominate.
Pathway 1.1a
Community 1.1 to 1.2No fire, drought, improper grazing leads to a increase of woody species and a decline in perennial grasses
Pathway 1.2a
Community 1.2 to 1.1Prescribed grazing, severe drought reduces shrub/tree canopy or natural patchy fire
State 2
Natives / Introduced Annuals StateCommunity 2.1
Mixed Shrub - Grassland w/ Introduced AnnualsIntroduced exotic annual grasses and forbs are present in minor amounts in the plant community, but the amount and proportions of native plants is similar to that found in plant community 1.2, Sagebrush Shrubland.
Community 2.2
Sagebrush - Trees w/ Introduced AnnualsSagebrush dominates the understory with a overstory of juniper and pinyons. The lack of natural fire along with periods of favorable precipitation promote tree regeneration/increase.
Pathway 2.1a
Community 2.1 to 2.2No fire, drought, improper grazing, shrub and tree increase and perennial grass decline
Pathway 2.2a
Community 2.2 to 2.1Prescribed grazing, Trees and Shrubs reduced through prolonged drought or natural patchy fire or brush treatment
State 3
Perennial Grassland - Introduced Annuals StateIn this plant community widespread fire has removed the shrub canopy. This site is characterized by a dominance of perennial grasses with a mix of introduced annuals grasses and forbs.
Transition T1A
State 1 to 2Introduction of non-native annuals species creates an irreversible change in the plant community
Transition T2A
State 2 to 3Fire, Establishment of annuals and increase of perennial grasses due to reduced competition from shrubs.
Transition R3A
State 3 to 2Seed source for sagebrush/desirable grasses species, possible seeding of grasses, prescribed grasses, favorable moisture.
Additional community tables
Table 9. Community 1.1 plant community composition
Group Common name Symbol Scientific name Annual production () Foliar cover (%) Grass/Grasslike1 Common Native Perennial Spring Grasses 45–90 muttongrass POFE Poa fendleriana 45–90 – Indian ricegrass ACHY Achnatherum hymenoides 45–90 – needle and thread HECOC8 Hesperostipa comata ssp. comata 18–45 – squirreltail ELELE Elymus elymoides ssp. elymoides 9–18 – 2 Common Native Perennial Summer Grasses 63–135 blue grama BOGR2 Bouteloua gracilis 45–90 – sandhill muhly MUPU2 Muhlenbergia pungens 18–45 – 3 Occasional Native Perennial Grasses 45–90 Grass, perennial 2GP Grass, perennial 0–27 – threeawn ARIST Aristida 9–27 – prairie Junegrass KOMA Koeleria macrantha 9–27 – western wheatgrass PASM Pascopyrum smithii 9–27 – James' galleta PLJA Pleuraphis jamesii 9–27 – sand dropseed SPCR Sporobolus cryptandrus 9–27 – Forb4 Occasional Native Perennial Forbs 10–45 Forb, perennial 2FP Forb, perennial 5–15 – milkvetch ASTRA Astragalus 0–4 – bastard toadflax COUM Comandra umbellata 0–4 – cryptantha CRYPT Cryptantha 0–4 – larkspur DELPH Delphinium 0–4 – sulphur-flower buckwheat ERUM Eriogonum umbellatum 0–4 – wallflower ERYSI Erysimum 0–4 – fineleaf hymenopappus HYFI Hymenopappus filifolius 0–4 – evening primrose OENOT Oenothera 0–4 – beardtongue PENST Penstemon 0–4 – phacelia PHACE Phacelia 0–4 – ragwort SENEC Senecio 0–4 – globemallow SPHAE Sphaeralcea 0–4 – spiderwort TRADE Tradescantia 0–4 – vervain VERBE Verbena 0–4 – 5 Occasional Native Annual Forbs 0–45 Forb, annual 2FA Forb, annual 0–25 – Wright's bird's beak COWR2 Cordylanthus wrightii 0–10 – touristplant DIWI2 Dimorphocarpa wislizeni 0–5 – shortstem lupine LUBR2 Lupinus brevicaulis 0–5 – small wirelettuce STEX Stephanomeria exigua 0–5 – Shrub/Vine6 Common Native Shrubs 315–450 mountain big sagebrush ARTRV Artemisia tridentata ssp. vaseyana 180–225 – mormon tea EPVI Ephedra viridis 45–90 – antelope bitterbrush PUTR2 Purshia tridentata 45–90 – Utah serviceberry AMUT Amelanchier utahensis 18–45 – narrowleaf yucca YUAN2 Yucca angustissima 9–27 – rubber rabbitbrush ERNAG Ericameria nauseosa ssp. nauseosa var. glabrata 9–27 – beavertail pricklypear OPBA2 Opuntia basilaris 9–27 – 7 Occasional Native Shrubs 80–120 broom snakeweed GUSA2 Gutierrezia sarothrae 9–27 – Sonoran scrub oak QUTU2 Quercus turbinella 9–27 – spineless horsebrush TECA2 Tetradymia canescens 9–27 – greenleaf manzanita ARPA6 Arctostaphylos patula 9–27 – hedgehog cactus ECHIN3 Echinocereus 9–18 – banana yucca YUBA Yucca baccata 9–18 – Shrub (>.5m) 2SHRUB Shrub (>.5m) 0–18 – Tree8 Occasional Native Trees 5–30 Gambel oak QUGA Quercus gambelii 5–45 – Utah juniper JUOS Juniperus osteosperma 0–18 – twoneedle pinyon PIED Pinus edulis 0–18 – ponderosa pine PIPO Pinus ponderosa 0–18 – Table 10. Community 1.2 plant community composition
Group Common name Symbol Scientific name Annual production () Foliar cover (%) Table 11. Community 2.1 plant community composition
Group Common name Symbol Scientific name Annual production () Foliar cover (%) Table 12. Community 2.2 plant community composition
Group Common name Symbol Scientific name Annual production () Foliar cover (%) Interpretations
Animal community
The site is suitable for livestock grazing throughout the year, although during severe winters snow depth may limit the site's suitability for grazing.
The sandy nature of the soil of the site inhibits livestock travel. Improved livestock water distribution and animal performance can be obtained by spacing livestock waters at intervals no greater than one mile.
Water is generally lacking for wildlife also. Fair to good wildlife cover is provided.Recreational uses
Recreational activities include deer hunting.
Wood products
No wood products are produced from this site.
Other information
Management Considerations:
Left undisturbed by fire or grazing the site will become increasingly dominated by shrubs at the expense of grasses and forbs. Fire, in the form of either natural or prescribed fire, can be used to reduce the shrub dominance, although this should be considered with caution due to the severe wind erosion potential of the site. An additional concern is the probability that shrub control through either fire or herbicidal treatment will also reduce the amount of desirabel shrub species, suc as antelope bitterbrush.Supporting information
Type locality
Location 1: Mohave County, AZ Township/Range/Section T41 N. R5 W. S23 General legal description Arizona, Mohave County, Moccasin 7 1/2 min. quad., Sec. 23, T. 41 N., R. 5 W., Moccasin Mountain, Kaibab-Paiute Indian Reservation. Other references
Updates and revisions for this ESD were conducted as part of a 2007-2012 Interagency Technical Assistance Agreement between the Bureau of Indian Affairs–Navajo Region and the NRCS-Arizona.
Contributors
Dan Carroll
Kenneth Gishi
Larry D. Ellicott
Stephen Cassady
Steve CassadyRangeland health reference sheet
Interpreting Indicators of Rangeland Health is a qualitative assessment protocol used to determine ecosystem condition based on benchmark characteristics described in the Reference Sheet. A suite of 17 (or more) indicators are typically considered in an assessment. The ecological site(s) representative of an assessment location must be known prior to applying the protocol and must be verified based on soils and climate. Current plant community cannot be used to identify the ecological site.
Author(s)/participant(s) Dean Schlichting, Dan Carroll and Ken Gishi Contact for lead author State Rangeland Management Specialist, NRCS-Arizona State Office Date 10/28/2010 Approved by Approval date Composition (Indicators 10 and 12) based on Annual Production Indicators
-
Number and extent of rills:
None on shallow slopes. A few minor rills may be be present on steeper slopes and likely to form below exposed bedrock. Rills will be short and 4-8' long in length. On this site there can be a increase of rills following instense storm events, but do not persist due to coarse textures, wind action and raindrop splash impact. -
Presence of water flow patterns:
A few water flow patterns may form due to the moderate hazard of water erosion for this site. These would be expected to be short and discontinuous due to the high potential for vegetative ground cover. These soils are well drained and have good permeability -
Number and height of erosional pedestals or terracettes:
Pedestals and terracettes may be seen on rare occasions near water flow patterns. Sites with well developed biological soil crust may resemble pedastals, but are normal surface roughness. These crusts will have a rolling or pinnacled appearance (.5 to 2" height) with a darken soil surface. -
Bare ground from Ecological Site Description or other studies (rock, litter, lichen, moss, plant canopy are not bare ground):
Bare ground is generally 20-40%. Biological soil crusts that is intact and functional shouldn't be counted as bare ground. -
Number of gullies and erosion associated with gullies:
None. -
Extent of wind scoured, blowouts and/or depositional areas:
Some depositional areas may occur around long lived grasses, shrubs and trees but are stable due to canopy, biological soil crust and litter cover. An occasional blowout may occur around large junipers, especially during and after severe droughts. -
Amount of litter movement (describe size and distance expected to travel):
Herbaceous and fine woody litter (<1/4" diameter) will be transported by wind in open areas a considerable distance (3-6'). The distance of movement in the water flow pathways will be a less (2-3')because of the high permeability and excessively drained soil. Coarse woody litter (>1/4" dia.) will remain under shrub and tree canopies. -
Soil surface (top few mm) resistance to erosion (stability values are averages - most sites will show a range of values):
Soil surface textures are fine sand to loamy sand. Soil stability values are 1-2 with no canopy cover and 2-3 under canopy. There is little water erosion and light to moderate wind erosion with the reference plant community in place. -
Soil surface structure and SOM content (include type of structure and A-horizon color and thickness):
Soil surface structure is typically single grain; loose (weak structure) and 3-8" deep. Surface horizons will typically have better developed horizons under plant canopies then the adjacent interspaces. Colors generally range from brown (7.5YR 5/4) to pale brown (10YR 6/3). -
Effect of community phase composition (relative proportion of different functional groups) and spatial distribution on infiltration and runoff:
This site's plant community composition is dominated by shrubs (50-60%), grasses (25-35%), forbs (10-15%) and trees (0-2%). The average distance to the nearest perennial plant (fetch) is 3-4" and the range is from 1" to 10". Shrub canopies, scattered grasses and the present of a biological soil crust will limit splash impact and reduce runoff. This type of plant community will capture and hold all available moisture the climate can provide. -
Presence and thickness of compaction layer (usually none; describe soil profile features which may be mistaken for compaction on this site):
None -
Functional/Structural Groups (list in order of descending dominance by above-ground annual-production or live foliar cover using symbols: >>, >, = to indicate much greater than, greater than, and equal to):
Dominant:
Evergreen shrubs > cool season grassesSub-dominant:
Warm season grasses > decidious shrubs > perennial forbsOther:
Trees > annual forbs = cactiAdditional:
-
Amount of plant mortality and decadence (include which functional groups are expected to show mortality or decadence):
All plant functional groups are adapted to survival in all but the most severe droughts. During normal precipitation years, mortality will be very low in grasses and shrubs. Severe winter droughts affect trees and shrubs the most. Severe summer drought affects grasses the most. -
Average percent litter cover (%) and depth ( in):
Of the total litter amount (depth range .1 - 2"), it would be expected that approximately 60-80% would be herbaceous fine litter (<1/4" diameter) and approximately 20-40% would be woody litter (>1/4" - 2" diameter). Litter amounts increase during the first few years of drought and decrease in later years. -
Expected annual annual-production (this is TOTAL above-ground annual-production, not just forage annual-production):
Average annual production on this site is expected to be 750 to 850 lbs./ac. in a year of average annual precipitation. -
Potential invasive (including noxious) species (native and non-native). List species which BOTH characterize degraded states and have the potential to become a dominant or co-dominant species on the ecological site if their future establishment and growth is not actively controlled by management interventions. Species that become dominant for only one to several years (e.g., short-term response to drought or wildfire) are not invasive plants. Note that unlike other indicators, we are describing what is NOT expected in the reference state for the ecological site:
Broom snakeeed, prickly pear, locoweed, Wright's bird's beak and six weeks fescue are native species that have the potential to increase and dominate the site after disturbance. Cheatgrass and Russian thistle are exotic annuals that is becoming endemic to the site regardless of management or fire frequency. -
Perennial plant reproductive capability:
All native plants are adapted to the climate and are capable of producing seeds, stolons and/or rhizomes except during the most severe droughts.
Print Options
Sections
Font
AAAAOther
PrintThe Ecosystem Dynamics Interpretive Tool is an information system framework developed by the USDA-ARS Jornada Experimental Range, USDA Natural Resources Conservation Service, and New Mexico State University.
Accessibility statement