Natural Resources
Conservation Service
Ecological site R035XC334AZ
Sandy Loam Upland
10-14" p.z.
Calcareous
Last updated: 5/19/2025
Accessed: 06/26/2026
-
Search


Major Land Resource Area or ecological site by name and/or ID.
PreviousSectionsNextGeneral information
Provisional. A provisional ecological site description has undergone quality control and quality assurance review. It contains a working state and transition model and enough information to identify the ecological site.
Click to explore map
Figure 1. Mapped extent
Areas shown in blue indicate the maximum mapped extent of this ecological site. Other ecological sites likely occur within the highlighted areas. It is also possible for this ecological site to occur outside of highlighted areas if detailed soil survey has not been completed or recently updated.
MLRA notes
Major Land Resource Area (MLRA): 035X–Colorado Plateau
AZ CRA 35.3 – Colorado Plateau Sagebrush – Grasslands
Elevations range from 4500 to 6000 feet and precipitation averages 10 to 14 inches. Vegetation includes Wyoming big sagebrush, Utah juniper, Colorado pinyon - cliffrose, Mormon tea, fourwing saltbush, blackbrush Indian ricegrass, needle and thread, western wheatgrass Galleta, black grama, blue grama, and sand dropseed. The soil temperature regime is mesic and the soil moisture regime is ustic aridic. This unit occurs within the Colorado Plateau Physiographic Province and is characterized by a sequence of flat to gently dipping sedimentary rocks eroded into plateaus, valleys and deep canyons. Sedimentary rock classes dominate the plateau with volcanic fields occurring for the most part near its margin.Table 1. Dominant plant species
Tree Not specified
Shrub (1) Ephedra nevadensis
(2) Atriplex canescensHerbaceous (1) Hesperostipa comata
(2) Bouteloua gracilisPhysiographic features
This site occurs on undulating plateaus, fan terraces, and alluvial fans on toe slopes, foot slopes, side slopes and depressions.
Table 2. Representative physiographic features
Landforms (1) Plateau
(2) Terrace
(3) Fan
Flooding frequency None to rare Ponding duration Very brief (4 to 48 hours) to brief (2 to 7 days) Ponding frequency None to rare Elevation 4800 – 6300 ft Slope 1 – 15 % Aspect Aspect is not a significant factor Climatic features
Winter summer moisture ratios range from 70:30 to 60:40. Late spring is usually the driest period, and early fall moisture can be sporadic. Summer rains fall from June through September; moisture originates in the Gulf of Mexico and creates convective, usually brief, intense thunderstorms. Cool season moisture from October through May tends to be frontal; it originates in the Pacific and the Gulf of California and falls in widespread storms with longer duration and lower intensity. Precipitation generally comes as snow from December through February. Accumulations above 12 inches are not common but can occur. Snow usually lasts for 3-4 days, but can persist much longer. Summer daytime temperatures are commonly 95 - 100 F and on occasion exceed 105 F. Winter air temperatures can regularly go below 10 F and have been recorded below - 20 F.
Table 3 Representative climatic features
Frost-free period (average) 170 days Freeze-free period (average) 190 days Precipitation total (average) 10 in BarLineFigure 2. Monthly precipitation range
BarLineFigure 3. Monthly average minimum and maximum temperature
">Influencing water features
Soil features
Soils on this site are deep to very deep. Surface textures are fine sandy loam and sandy loam. Subsurface textures are loamy fine sand, fine sandy loam, loam, and sandy clay loam. They are derived from mixed alluvium and alluvium from shale and sandstone. Soil moisture regime is ustic aridic and soil temperature regime is mesic. They are calcareous at the surface.
Typical taxonomic units on this site include:
SSA 623 Shivwits Area MU 11 Anasazi family;
SSA 625 Mohave County NE part MU's 4 Begay, 32 Progresso, 43 & 45 Penestaja, 44 Palma, and 50 Radnick;
SSA 701 Grand Canyon Area MU 157 Ustic torriorthents.Table 4. Representative soil features
Parent material (1) Alluvium – sandstone and shale
Surface texture (1) Fine sandy loam
(2) Sandy loam
Family particle size (1) Loamy
Drainage class Moderately well drained to well drained Permeability class Moderate to moderately rapid Soil depth 40 – 60 in Surface fragment cover <=3" 0 – 15 % Surface fragment cover >3" 0 – 10 % Available water capacity
(0-40in)2.5 – 10 in Calcium carbonate equivalent
(0-40in)5 – 30 % Electrical conductivity
(0-40in)0 – 2 mmhos/cm Sodium adsorption ratio
(0-40in)0 – 5 Soil reaction (1:1 water)
(0-40in)8.2 – 8.6 Subsurface fragment volume <=3"
(Depth not specified)0 – 10 % Ecological dynamics
The plant communities found on an ecological site are naturally variable. Composition and production will vary with yearly conditions, location, aspect, and the natural variability of the soils. The historical climax plant community represents the natural potential plant communities found on relict or relatively undisturbed sites. Other plant communities described here represent plant communities that are known to occur when the site is disturbed by factors such as grazing, fire, or drought.
Production data provided in this site description is standardized to air-dry weight at the end of the summer growing season. The plant communities described in this site description are based on near normal rainfall years.
NRCS uses a Similarity Index to compare existing plant communities to the plant communities described here. Similarity Index is determined by comparing the production and composition of a plant community to the production and composition of a plant community described in this site description. To determine Similarity Index, compare the production (air-dry weight) of each species to that shown in the plant community description. For each species, count no more than the maximum amount shown for the species, and for each group, count no more than the maximum shown for the group. Divide the resulting total by the total normal year production shown in the plant community description. If rainfall has been significantly above or below normal, use the total production shown for above or below normal years. If field data is not collected at the end of the summer growing season, then the field data must be corrected to the end of the year production before comparing it to the site description. The growth curve can be used as a guide for estimating production at the end of the summer growing season.
The State and Transition model shows the most common occurring plant communities likely to be encountered on this ecological site. This model may not show every possible plant community, but only those that are most prevalent and observed through field inventory. As more data is collected and research is available, these plant communities may be revised, removed, and even added to reflect the ecological dynamics of this site.State and transition model
Custom diagramStandard diagram
Figure 4. State and Transition Model - R035XC334AZ
More interactive model formats are also available. View Interactive Models
More interactive model formats are also available. View Interactive Models
Click on state and transition labels to scroll to the respective textEcosystem states
State 1 submodel, plant communities
State 1
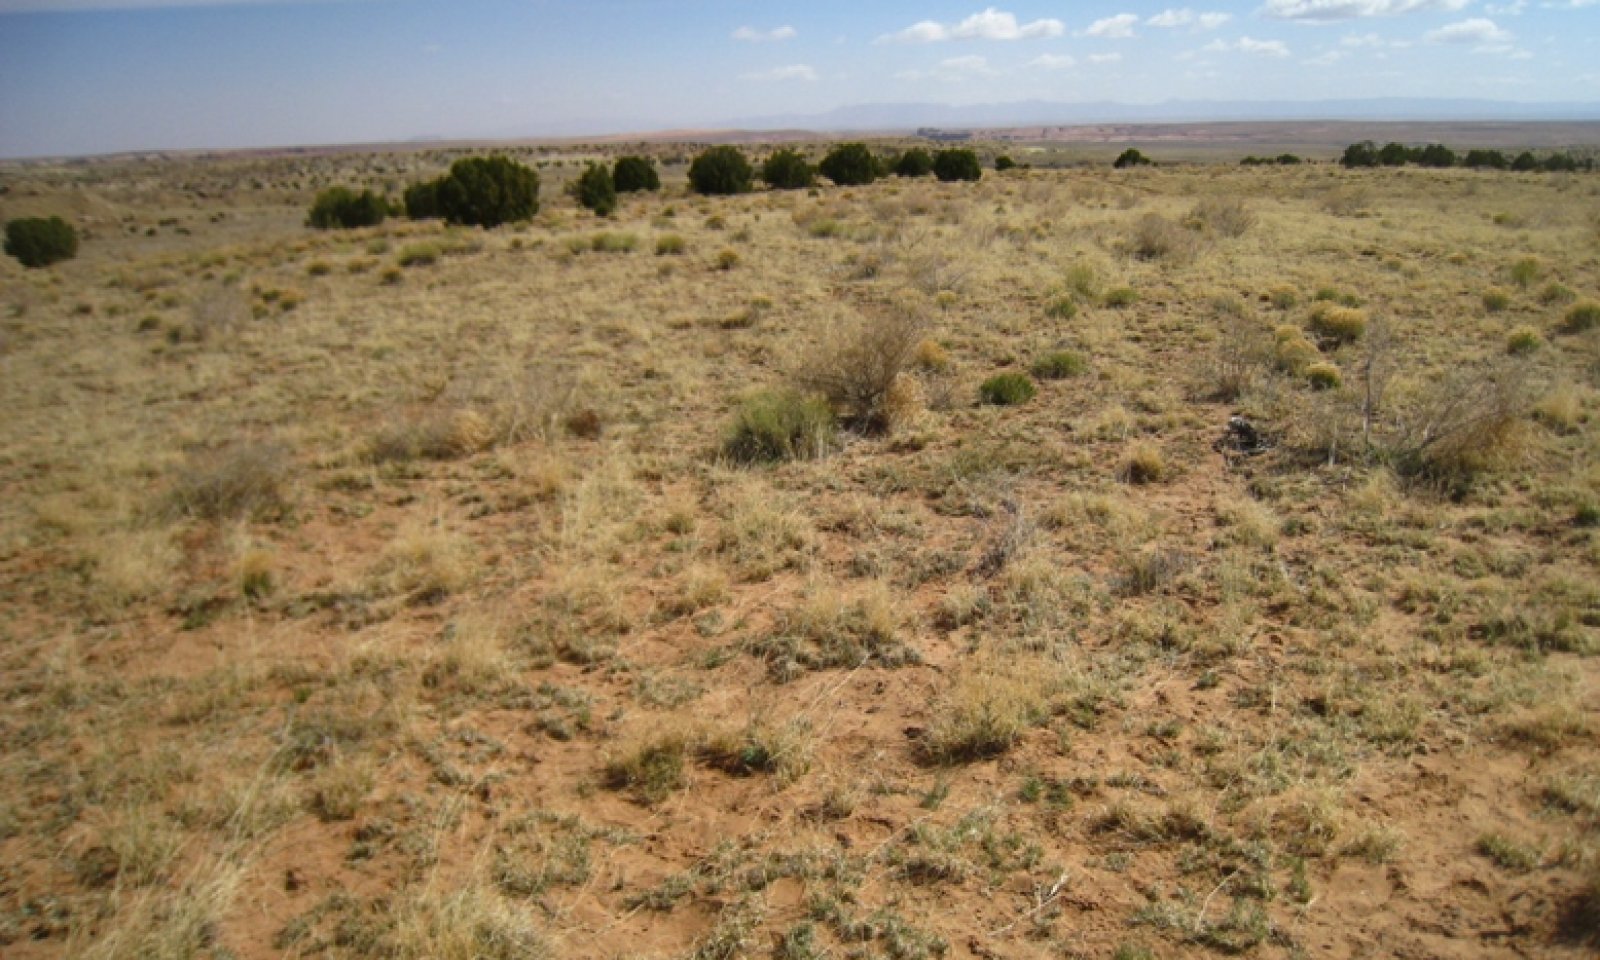
ReferenceCommunity 1.1
Grassland with Shrubs
Figure 5. Sandy Loam Upland 10-14" p.z. Calcareous
This site has a plant community made up primarily of mid and short grasses with a relatively small percentage of forbs and shrubs. In the original plant community there is a predominance of warm season grasses with shrubs, half shrubs, and cool season grasses.
The dominant aspect is desert grassland with scattered shrubs.
Plant species most likely to invade or increase on this site when it deteriorates are broom snakeweed, stickyleaf low rabbitbrush, annuals, and juniper.
Continuous grazing during the winter and spring periods will decrease the cool season grasses, which are replaced by warm season, lower forage value grasses and shrubs.Figure 6. Annual production by plant type (representative values) or group (midpoint values)
Table 5. Annual production by plant type
Plant type Low
(lb/acre)Representative value
(lb/acre)High
(lb/acre)Grass/Grasslike 360 460 555 Shrub/Vine 80 100 120 Forb 30 40 50 Tree 2 3 4 Total 472 603 729 Table 6. Ground cover
Tree foliar cover 0% Shrub/vine/liana foliar cover 0-10% Grass/grasslike foliar cover 10-30% Forb foliar cover 0-0% Non-vascular plants 0% Biological crusts 0% Litter 0% Surface fragments >0.25" and <=3" 0% Surface fragments >3" 0% Bedrock 0% Water 0% Bare ground 0% Table 7. Soil surface cover
Tree basal cover 0-0% Shrub/vine/liana basal cover 0-0% Grass/grasslike basal cover 0-10% Forb basal cover 0-0% Non-vascular plants 0% Biological crusts 0-20% Litter 20-30% Surface fragments >0.25" and <=3" 0-10% Surface fragments >3" 0-10% Bedrock 0% Water 0% Bare ground 40-60% Table 8. Canopy structure (% cover)
Height Above Ground (ft) Tree Shrub/Vine Grass/
GrasslikeForb <0.5 – – – 0-1% >0.5 <= 1 – 1-2% 5-10% 0-1% >1 <= 2 – 1-3% 5-25% – >2 <= 4.5 0-1% 0-1% – – >4.5 <= 13 0-1% – – – >13 <= 40 – – – – >40 <= 80 – – – – >80 <= 120 – – – – >120 – – – – Figure 7. Plant community growth curve (percent production by month). AZ3501 , 35.3 10-14" p.z. needle and thread. Growth starts in spring and extends into summer, plants may be green in the fall..
Jan Feb Mar Apr May Jun Jul Aug Sep Oct Nov Dec J F M A M J J A S O N D 0 0 10 20 30 10 5 5 10 10 0 0 Figure 8. Plant community growth curve (percent production by month). AZ3503 , 35.3 10-14" p.z. galleta. Growth begins in spring, most growth occurs during summer and early fall rainy season. Plants will green up again in the fall..
Jan Feb Mar Apr May Jun Jul Aug Sep Oct Nov Dec J F M A M J J A S O N D 0 0 0 0 5 20 15 20 30 10 0 0 Figure 9. Plant community growth curve (percent production by month). AZ3504 , 35.3 10-14" p.z. bottlebrush squirreltail. Growth occurs in late winter, spring, and fall. Plants often remain green through the winter..
Jan Feb Mar Apr May Jun Jul Aug Sep Oct Nov Dec J F M A M J J A S O N D 0 5 15 35 25 10 0 0 5 5 0 0 Figure 10. Plant community growth curve (percent production by month). AZ5104 , 35.3 10-14" p.z. sand dropseed. Growth begins in spring and extends into the fall..
Jan Feb Mar Apr May Jun Jul Aug Sep Oct Nov Dec J F M A M J J A S O N D 0 0 0 5 10 5 30 35 15 0 0 0 Figure 11. Plant community growth curve (percent production by month). AZ3505 , 35.3 10-14" p.z. Indian ricegrass. Growth begins in spring, with semi-dormancy occurring during July through August. Plants will green up again in the fall..
Jan Feb Mar Apr May Jun Jul Aug Sep Oct Nov Dec J F M A M J J A S O N D 0 0 10 20 25 20 5 5 10 5 0 0 Figure 12. Plant community growth curve (percent production by month). AZ3531 , 35.3 10-14" p.z. all sites. Growth begins in the spring and continues through the summer..
Jan Feb Mar Apr May Jun Jul Aug Sep Oct Nov Dec J F M A M J J A S O N D 0 1 3 17 18 10 19 20 10 1 1 0 Figure 13. Plant community growth curve (percent production by month). AZ3533 , Nevada mormon tea. Grows mainly in spring and early summer..
Jan Feb Mar Apr May Jun Jul Aug Sep Oct Nov Dec J F M A M J J A S O N D 0 0 5 25 25 20 15 10 0 0 0 0 Figure 14. Plant community growth curve (percent production by month). AZ3536 , Black Grama. Grows mainly on summer precipitation..
Jan Feb Mar Apr May Jun Jul Aug Sep Oct Nov Dec J F M A M J J A S O N D 0 0 0 0 5 5 30 50 10 0 0 0 Figure 15. Plant community growth curve (percent production by month). AZ3563 , 35.3 10-14" p.z. fourwing saltbush. Growth occurs in late spring through summer..
Jan Feb Mar Apr May Jun Jul Aug Sep Oct Nov Dec J F M A M J J A S O N D 0 0 0 0 10 25 35 25 5 0 0 0 Figure 16. Plant community growth curve (percent production by month). AZ3567 , 35.3 10-14" p.z. blue grama. Growth occurs mostly during the summer rainy season..
Jan Feb Mar Apr May Jun Jul Aug Sep Oct Nov Dec J F M A M J J A S O N D 0 0 0 0 5 5 30 55 5 0 0 0 Additional community tables
Table 9. Community 1.1 plant community composition
Group Common name Symbol Scientific name Annual production () Foliar cover (%) Tree0 Tree Group 0–6 Utah juniper JUOS Juniperus osteosperma 0–6 – Shrub/Vine0 Dominant Shrub Group 35–125 Nevada jointfir EPNE Ephedra nevadensis 30–60 – yellow rabbitbrush CHVI8 Chrysothamnus viscidiflorus 0–30 – fourwing saltbush ATCA2 Atriplex canescens 6–24 – broom snakeweed GUSA2 Gutierrezia sarothrae 0–18 – 6 Other shrubs 5–50 Shrub (>.5m) 2SHRUB Shrub (>.5m) 6–24 – Wyoming big sagebrush ARTRW8 Artemisia tridentata ssp. wyomingensis 0–6 – Wiggins' cholla CYEC3 Cylindropuntia echinocarpa 0–6 – mormon tea EPVI Ephedra viridis 0–6 – winterfat KRLA2 Krascheninnikovia lanata 0–6 – pale desert-thorn LYPA Lycium pallidum 0–6 – plains pricklypear OPPO Opuntia polyacantha 0–6 – whitestem paperflower PSCO2 Psilostrophe cooperi 0–6 – narrowleaf yucca YUAN2 Yucca angustissima 0–6 – Grass/Grasslike0 Dominant Perennial Grasses 230–450 blue grama BOGR2 Bouteloua gracilis 90–151 – James' galleta PLJA Pleuraphis jamesii 60–121 – squirreltail ELELE Elymus elymoides ssp. elymoides 60–90 – threeawn ARIST Aristida 6–30 – black grama BOER4 Bouteloua eriopoda 6–30 – sand dropseed SPCR Sporobolus cryptandrus 6–30 – 1 Co-Dominant Perennial Grasses 120–240 Indian ricegrass ACHY Achnatherum hymenoides 60–121 – needle and thread HECOC8 Hesperostipa comata ssp. comata 60–121 – 2 Other perennial grasses 0–15 Grass, perennial 2GP Grass, perennial 0–6 – mat muhly MURI Muhlenbergia richardsonis 0–6 – slim tridens TRMU Tridens muticus 0–6 – 3 Other annual grasses 0–15 Grass, annual 2GA Grass, annual 0–6 – cheatgrass BRTE Bromus tectorum 0–6 – sixweeks fescue VUOC Vulpia octoflora 0–6 – Forb0 Dominant Forb 5–15 globemallow SPHAE Sphaeralcea 6–18 – 4 Other perennial forbs 5–15 Forb, perennial 2FP Forb, perennial 6–18 – ragweed AMBRO Ambrosia 0–6 – mariposa lily CALOC Calochortus 0–6 – larkspur DELPH Delphinium 0–6 – phlox PHLOX Phlox 0–6 – ragwort SENEC Senecio 0–6 – 5 Other annual forbs 10–20 Forb, annual 2FA Forb, annual 12–18 – aster ASTER Aster 6–12 – milkvetch ASTRA Astragalus 0–6 – tansymustard DESCU Descurainia 0–6 – buckwheat ERIOG Eriogonum 0–6 – sunflower HELIA3 Helianthus 0–6 – plantain PLANT Plantago 0–6 – prickly Russian thistle SATR12 Salsola tragus 0–6 – Interpretations
Animal community
Site is favorable for grazing throughout most of the year except when snow cover restricts availability of forage. With continuous grazing use during winter and spring, the cool season mid grasses are replaced by stickyleaf low rabbitbrush, snakeweed and lower value forbs and grasses. Planned grazing systems adapt well to use on this site.
The potential plant community produced by this site provides food for those species of wildlife that utilize grass as a major portion of their diet. When vegetative retrogression occurs, unpalatable shrubby species increase and some wildlife species may be benefit.
Wildlife that frequents the area: Pronghorn antelope, Black-tailed jackrabbit, coyote, badger, Antelope squirrel, Kangaroo rat, deer mouse, Red tail hawk, Raven, meadowlark, gopher snake, Western rattlesnake, Longnose leopard lizzard, Short-horned lizzard, western whiptail, and Black-collared lizzard.
Recreational uses
Site is typically fans and terraces. It produces high desert grasslands which can be very picturesque.
Winters are cold, however, relatively mild spring, fall and summer months are attractive to recreationists.
Activities include hunting, cross-country riding, photography, hiking, rock collecting, and wildlife observation.
Supporting information
Type locality
Location 1: Mohave County, AZ Township/Range/Section T36n R10w S31 General legal description Poverty Knoll 7 1/2 Min. Quad; Approximately 7 miles Northwest of Mount Trumbull; Section 31, T36N, R10W; Mohave County, AZ. Other references
Updates and revisions for this ESD were conducted as part of a 2007-2012 Interagency Technical Assistance Agreement between the Bureau of Indian Affairs–Navajo Region and the NRCS-Arizona.
Contributors
Larry D. Ellicott
Steve BarkerApproval
Kendra Moseley, 5/19/2025
Rangeland health reference sheet
Interpreting Indicators of Rangeland Health is a qualitative assessment protocol used to determine ecosystem condition based on benchmark characteristics described in the Reference Sheet. A suite of 17 (or more) indicators are typically considered in an assessment. The ecological site(s) representative of an assessment location must be known prior to applying the protocol and must be verified based on soils and climate. Current plant community cannot be used to identify the ecological site.
Author(s)/participant(s) Kenneth Gishi Contact for lead author State Rangeland Management Specialist, NRCS-Arizona State Office, Phoenix, AZ Date 08/06/2012 Approved by Approval date Composition (Indicators 10 and 12) based on Annual Production Indicators
-
Number and extent of rills:
None. Due to the low to medium runoff, well to somewhat excessively drained and moderate to rapid permeability, rills would not be expected on this site. -
Presence of water flow patterns:
None on level slopes due to the low to medium runoff, well to somewhat excessively drained and moderate to rapid permeability, water patterns would not be expected on this site. On steeper slopes, a few water flow patterns may be present, especially following large storm events or where adjacent to rock outcrops. -
Number and height of erosional pedestals or terracettes:
There may be a few occasional pedestals and terracettes, especially on steeper slopes and/or during a drought, due to the high wind erosion hazards of the soils -
Bare ground from Ecological Site Description or other studies (rock, litter, lichen, moss, plant canopy are not bare ground):
Bare ground (soil surface cover) ranges from 40-60%. This site has the potential to produce a moderate amount of plant cover and litter due to an average availability of water capacity of 6-10 inches. Drought may cause an increase in bare ground. -
Number of gullies and erosion associated with gullies:
None. Any gullies present are stabilized with grasses and shrubs and should not be actively eroding. -
Extent of wind scoured, blowouts and/or depositional areas:
Some wind scoured areas, blowouts and/or depositional areas may occur, especially during droughts due to high wind erosion hazard of the soils. There may be some slight deposition around long lived shrubs. -
Amount of litter movement (describe size and distance expected to travel):
The majority of herbaceous and fine woody litter will be transported by wind and some by water in flow pathways. Coarse woody litter will remain under shrub and tree canopies. -
Soil surface (top few mm) resistance to erosion (stability values are averages - most sites will show a range of values):
Soil surface textures ranging from loamy fine sand to loam. When well vegetated, these soils have a moderate to high resistance to water erosion, but only a moderate resistance to wind erosion. Expected stability ratings of 4-5 under canopies and 2-3 in the interspaces. -
Soil surface structure and SOM content (include type of structure and A-horizon color and thickness):
Most soils have a fine granular structure. The typical thickness of the A-horizon is 3-8 inches. Typical surface color is yellowish red (5YR 5/6). -
Effect of community phase composition (relative proportion of different functional groups) and spatial distribution on infiltration and runoff:
This site is characterized by a dominance of grasses with scattered shrubs, with lesser amounts of forbs and trees. Trees are often widely scattered sparsely across the site. Canopy cover ranges from 15-30% (grasses >> shrubs > forbs> trees and cacti). Basal cover ranges from 5-12% for vascular plants and 0-15% for biological crust. Both canopy and basal cover values decrease during a prolonged drought. This type of plant community is moderately effective at capturing and storing precipitation. -
Presence and thickness of compaction layer (usually none; describe soil profile features which may be mistaken for compaction on this site):
None. These soils are not easily compacted. Some soils may have a massive structure and should not be confused with a compacted layer. -
Functional/Structural Groups (list in order of descending dominance by above-ground annual-production or live foliar cover using symbols: >>, >, = to indicate much greater than, greater than, and equal to):
Dominant:
Cool season grasses (needle and thread, Indian ricegrass, squirreltail) > Warm season grasses (blue grama, black grama, galleta, sand dropseed) >Sub-dominant:
Shrubs (Mormon tea, fourwing saltbush, rabbitbrush, snakeweed > Forbs > TreesOther:
Cacti & YuccaAdditional:
-
Amount of plant mortality and decadence (include which functional groups are expected to show mortality or decadence):
All plant functional groups are adapted to survival in all but the most severe droughts. Severe winter droughts affect shrubs and trees the most. Severe summer droughts affect grasses the most. -
Average percent litter cover (%) and depth ( in):
Litter depth ranges from 1 leaf thickness to 2 inches. Of the total litter amount, it would be expected that up to 90% would be herbaceous litter and 10-30 percent would be woody litter. There may be a slight increase of litter following a drought and decrease in later years. -
Expected annual annual-production (this is TOTAL above-ground annual-production, not just forage annual-production):
The expected total annual production is 550 – 650 lbs/ac in a normal precipitation year. -
Potential invasive (including noxious) species (native and non-native). List species which BOTH characterize degraded states and have the potential to become a dominant or co-dominant species on the ecological site if their future establishment and growth is not actively controlled by management interventions. Species that become dominant for only one to several years (e.g., short-term response to drought or wildfire) are not invasive plants. Note that unlike other indicators, we are describing what is NOT expected in the reference state for the ecological site:
Broom snakeweed, Greene's rabbitbrush, prickly pear, and juniper are all natives that have the potential to increase and co-dominate after disturbance. Cheatgrass and Russian thistle is an exotic annual that is becoming endemic to the site regardless of management or disturbance. -
Perennial plant reproductive capability:
All plants native to the site are adapted to the climate and are capable of producing seeds, stolons, and/or rhizomes except during the most severe drought.
Print Options
Sections
Font
AAAAOther
PrintThe Ecosystem Dynamics Interpretive Tool is an information system framework developed by the USDA-ARS Jornada Experimental Range, USDA Natural Resources Conservation Service, and New Mexico State University.
Accessibility statement