Natural Resources
Conservation Service
-
Search


Major Land Resource Area or ecological site by name and/or ID.
PreviousSectionsNextGeneral information
Provisional. A provisional ecological site description has undergone quality control and quality assurance review. It contains a working state and transition model and enough information to identify the ecological site.
Click to explore map
Figure 1. Mapped extent
Areas shown in blue indicate the maximum mapped extent of this ecological site. Other ecological sites likely occur within the highlighted areas. It is also possible for this ecological site to occur outside of highlighted areas if detailed soil survey has not been completed or recently updated.
MLRA notes
Major Land Resource Area (MLRA): 035X–Colorado Plateau
This ecological site occurs in Common Resource Area 35.2 - the Colorado Plateau Shrub – Grasslands
Elevations range from 3800-5800 feet and precipitation averages 6 to 10 inches per year. Vegetation includes shadscale, fourwing saltbush, Mormon tea, blackbrush, Indian ricegrass, galleta, blue grama, and black grama. The soil temperature regime is mesic and the soil moisture regime is typic aridic. This unit occurs within the Colorado Plateau Physiographic Province and is characterized by a sequence of flat to gently dipping sedimentary rocks eroded into plateaus, valleys and deep canyons. Sedimentary rock classes dominate the plateau with volcanic fields occurring for the most part near its margin.
Associated sites
R035XB232AZ Limestone/Sandstone Upland 6-10" p.z.
Limestone/Sandstone Upland 6-10" p.z. Gravelly
Table 1. Dominant plant species
Tree Not specified
Shrub (1) Atriplex confertifolia
(2) Artemisia bigeloviiHerbaceous (1) Bouteloua eriopoda
Physiographic features
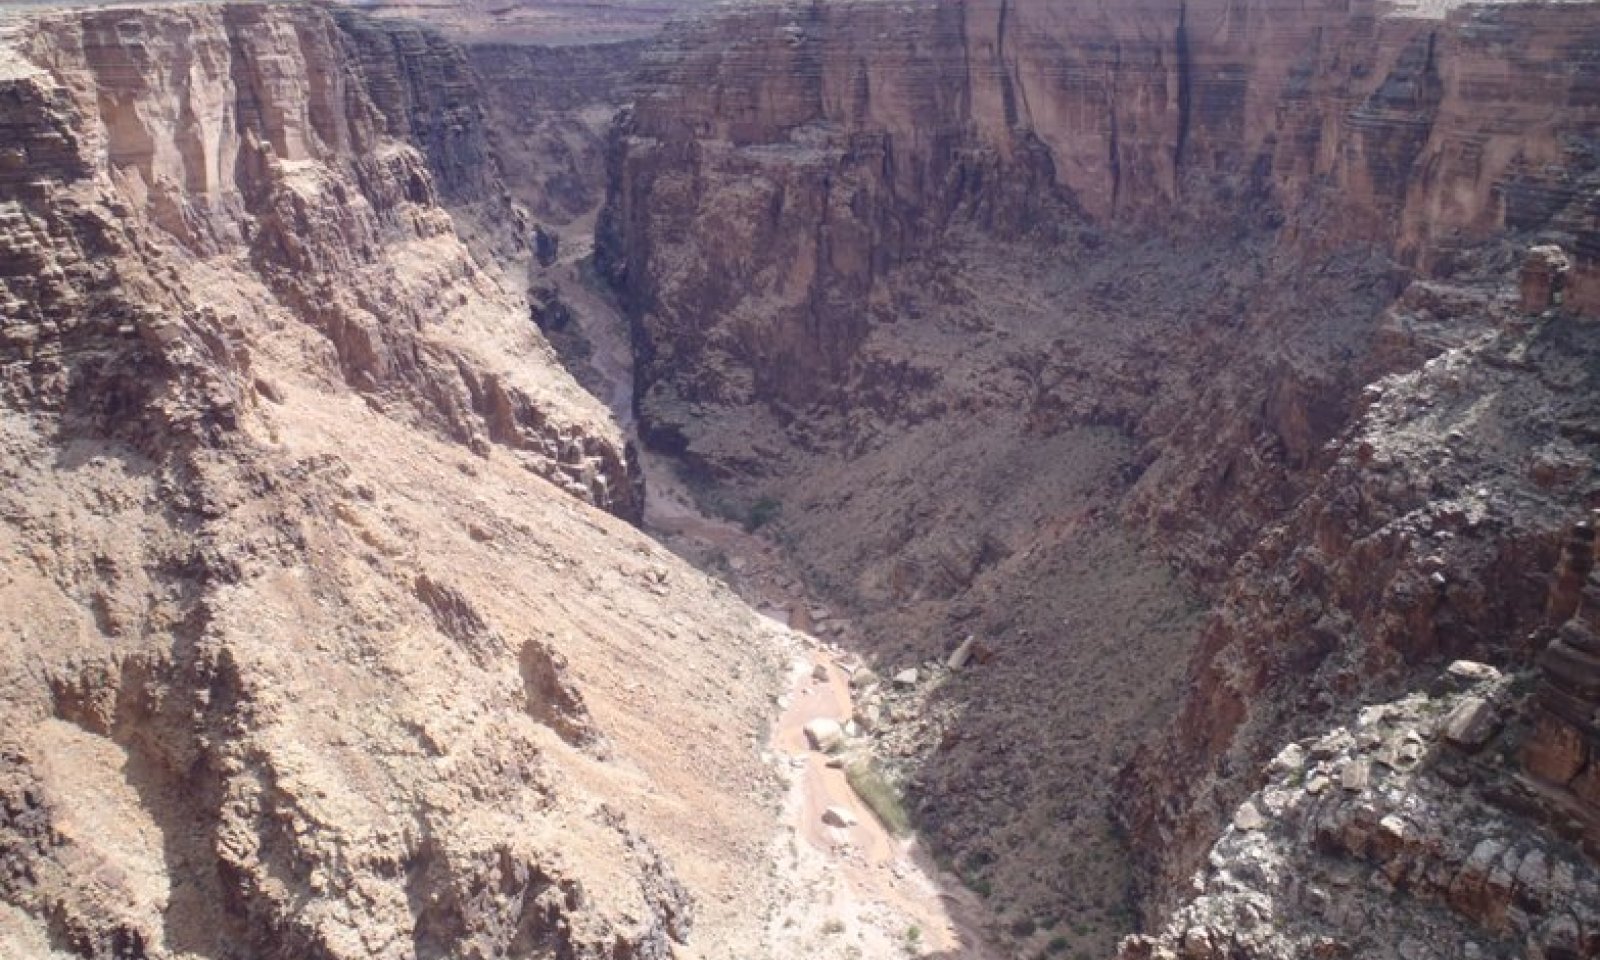
This ecological site is found on cliffs and escarpments along the sides of canyons and on the canyon rims. The plants grow on ledges, in rock cracks, and on colluvial slopes between the ledges.
This site occurs on all aspects. Some areas may get minimal direct sunlight during the day. Plant diversity and production is highly variable due to the extreme aspect changes and the patterns of storms tracks along the canyons.Table 2. Representative physiographic features
Landforms (1) Cliff
(2) Escarpment
(3) Canyon
Flooding frequency None Ponding frequency None Elevation 3800 – 5800 ft Slope 15 – 90 % Aspect N, S, W Climatic features
The 35.2 Colorado Plateau Cold Desert Shrub - Grassland common resource area has a very dry and windy climate that is hot in the summer and cold in the winter. The annual precipitation averages between 6 and 10 inches. The soil moisture regime is typic aridic, and the soil temperature regime is mesic. A slight majority of the precipitation arrives during the late fall, winter, and early spring. This winter season moisture originates in the Pacific Ocean and arrives as rain, or sometimes snow, during widespread frontal storms of generally low intensity. The majority of the snow (average range of 1 to 17 inches) falls from December through February but rarely lasts more than a few days. A seasonal drought occurs from late May through early July. Summer rains occur from July through September during brief intense local thunderstorms. The rain is sporadic in intensity and location. The moisture originates from the Gulf of Mexico in the early summer and the Gulf of California in the late summer/early fall. Windy conditions are common year round, but the winds are strongest and most frequent during the spring.
Table 3 Representative climatic features
Frost-free period (average) 180 days Freeze-free period (average) 210 days Precipitation total (average) 10 in BarLineFigure 2. Monthly precipitation range
BarLineFigure 3. Monthly average minimum and maximum temperature
">Influencing water features
The soil moisture on this ecological site comes from precipitation. The site does not benefit significantly from run-on moisture from adjacent sites. Shallow bedrock areas will concentrate water in deeper soil pockets, where most of the vegetation production occurs. Because of the shallow soils, larger rainfall events will not be entirely captured by the site. This site contributes runoff to other ecological sites.
Soil features
The majority of the ecological site is vertical rock outcrop that does not have any soil to support vegetation. Plant production occurs on the parts of the site that are flat enough for soil development and eaolian deposits that can support vegetation.
The soils on the ecological site are very shallow or shallow to bedrock (<20"). The soils formed in alluvium, colluvium, and residuum from limestone, calcareous sandstone, and siltstone of the Kaibab Formation. Surface textures range from sandy loam to sandy clay loam. The subsurface textures are mostly very fine sandy loam, fine sandy loam, and loam, but they include sandy loam, silt loam, and clay loam. The soil surface effervesces strongly to violently when treated with hydrochloric acid. The subsurface is generally strongly to violently effervescent, but occasionally, some horizons are non-effervescent or only slightly effervescent.
Soil survey map unit components correlated to this ecological site include:
SSA 701 Grand Canyon Area 106, 107, 109-Lithic Torriorthents, 116-Typic Torriorthents;
SSA 707 Little Colorado River Area 37-Tsaya, 44-Lithic Torriorthents.Table 4. Representative soil features
Parent material (1) Alluvium – limestone and siltstone
(2) Colluvium – calcareous sandstone
Surface texture (1) Extremely gravelly sandy loam
(2) Very gravelly loam
(3) Very channery sandy clay loam
Family particle size (1) Loamy
Drainage class Well drained to somewhat excessively drained Permeability class Moderately slow to moderately rapid Soil depth 1 – 20 in Surface fragment cover <=3" 30 – 80 % Surface fragment cover >3" 0 – 20 % Available water capacity
(0-40in)0.5 – 2.5 in Electrical conductivity
(0-40in)0 – 8 mmhos/cm Soil reaction (1:1 water)
(0-40in)8 – 9 Subsurface fragment volume <=3"
(Depth not specified)10 – 50 % Subsurface fragment volume >3"
(Depth not specified)0 – 30 % Ecological dynamics
The plant communities found on an ecological site are naturally variable. Composition and production will vary with yearly conditions, location, aspect, and the natural variability of the soils. The historical climax plant community (HCPC) represents the natural potential plant communities found on relict or relatively undisturbed sites. Other plant communities described here represent plant communities that are known to occur when the site is disturbed by factors such as grazing, fire, or drought.
Production data provided in this site description is standardized to air-dry weight at the end of the summer growing season. The plant communities described in this site description are based on near normal rainfall years.
NRCS uses a Similarity Index to compare existing plant communities to the plant communities described here. Similarity Index is determined by comparing the production and composition of a plant community to the production and composition of a plant community described in this site description. To determine Similarity Index, compare the production (air-dry weight) of each species to that shown in the plant community description. For each species, count no more than the maximum amount shown for the species, and for each group, count no more than the maximum shown for the group. Divide the resulting total by the total normal year production shown in the plant community description. If rainfall has been significantly above or below normal, use the total production shown for above or below normal years. If field data is not collected at the end of the summer growing season, then the field data must be corrected to the end of the year production before comparing it to the site description. The growth curve can be used as a guide for estimating production at the end of the summer growing season.
The State and Transition model shows the most common occurring plant communities likely to be encountered on this ecological site. This model may not show every possible plant community, but only those that are most prevalent and observed through field inventory. As more data is collected these plant communities may be revised, removed, and some added to reflect the ecological dynamics of this site.State and transition model
Custom diagramStandard diagram
Figure 4. STM - R035XB240AZ
More interactive model formats are also available. View Interactive Models
More interactive model formats are also available. View Interactive Models
Click on state and transition labels to scroll to the respective textEcosystem states
State 1 submodel, plant communities
State 2 submodel, plant communities
State 1
Reference StateThis ecological site is characterized by steep slopes with a diverse shrubland dominated by shadscale saltbush, Bigelow sagebrush, Torrey Mormon tea, and fourwing saltbush.
Community 1.1
Diverse Native Shrubland with Grasses
Figure 5. Limestone/Sandstone Cliffs 6-10" p.z.
This plant community is a diverse shrubland with grasses and a few forbs. The dominant plants are: shadscale saltbush, black grama, Bigelow sagebrush, Torrey Mormon tea, and fourwing saltbush.
There is 2-10% plant basal cover and 10-45% plant canopy cover on the site. Cover is highly variable depending on amount of rock cover, slope and aspect.
The production amount varies depending upon how much rock outcrop and the aspect of the site. The maximum production amount of 350 pounds per acre may only occur in areas with the highest amount of soil and the least amount of rock outcrop.Figure 6. Annual production by plant type (representative values) or group (midpoint values)
Table 5. Annual production by plant type
Plant type Low
(lb/acre)Representative value
(lb/acre)High
(lb/acre)Shrub/Vine 65 150 235 Grass/Grasslike 25 85 145 Forb 5 20 35 Total 95 255 415 Table 6. Soil surface cover
Tree basal cover 0% Shrub/vine/liana basal cover 0% Grass/grasslike basal cover 0% Forb basal cover 0% Non-vascular plants 0% Biological crusts 0-10% Litter 10-30% Surface fragments >0.25" and <=3" 30-60% Surface fragments >3" 0-30% Bedrock 0-30% Water 0% Bare ground 0-10% Figure 7. Plant community growth curve (percent production by month). AZ3521 , 35.2 6-10" p.z. all sites. Growth begins in the spring and continues through the summer. Most growth in this CRA occurs in the spring using stored winter moisture..
Jan Feb Mar Apr May Jun Jul Aug Sep Oct Nov Dec J F M A M J J A S O N D 0 1 9 20 27 14 10 11 5 3 0 0 State 2
Native/ Invasive AnnualsThis state is characterized by the establishment of exotic annuals, such as red brome, cheatgrass and Russian thistle. Invasion of annuals can occur with or without disturbance, regardless of management.
Community 2.1
Diverse Native Shrubland with Grasses and ExoticsThis community phase is very similar to the plant community in 1.1, but non-native species have established themselves. Non-native and native annuals composition ranges from 1 to 15 percents. Common exotics found on this site include cheatgrass, red brome and Russian Thistle.
Transition T1A
State 1 to 2Introduction of non-native annuals species creates an irreversible change in the plant community
Additional community tables
Table 7. Community 1.1 plant community composition
Group Common name Symbol Scientific name Annual production () Foliar cover (%) Grass/Grasslike1 Warm Season Grasses 25–75 black grama BOER4 Bouteloua eriopoda 10–50 – bush muhly MUPO2 Muhlenbergia porteri 0–25 – sand dropseed SPCR Sporobolus cryptandrus 0–20 – Grass, perennial 2GP Grass, perennial 0–20 – James' galleta PLJA Pleuraphis jamesii 0–10 – blue grama BOGR2 Bouteloua gracilis 0–10 – low woollygrass DAPU7 Dasyochloa pulchella 0–10 – spike dropseed SPCO4 Sporobolus contractus 0–5 – 2 Cool Season Grasses 0–50 desert needlegrass ACSP12 Achnatherum speciosum 0–30 – Mormon needlegrass ACAR14 Achnatherum aridum 0–20 – Indian ricegrass ACHY Achnatherum hymenoides 0–5 – squirreltail ELEL5 Elymus elymoides 0–5 – needle and thread HECO26 Hesperostipa comata 0–5 – muttongrass POFE Poa fendleriana 0–5 – 3 Annual Grasses 0–20 sixweeks fescue VUOC Vulpia octoflora 0–15 – Grass, annual 2GA Grass, annual 0–10 – sixweeks grama BOBA2 Bouteloua barbata 0–10 – Forb4 Forbs 5–35 Forb, annual 2FA Forb, annual 0–20 – Forb, perennial 2FP Forb, perennial 0–10 – rose heath CHER2 Chaetopappa ericoides 0–4 – tall mountain larkspur DESC Delphinium scaposum 0–4 – tansymustard DESCU Descurainia 0–4 – flatcrown buckwheat ERDE6 Eriogonum deflexum 0–4 – desert trumpet ERIN4 Eriogonum inflatum 0–4 – mountain pepperweed LEMO2 Lepidium montanum 0–4 – spiny phlox PHHO Phlox hoodii 0–4 – gypsum phacelia PHIN Phacelia integrifolia 0–4 – popcornflower PLAGI Plagiobothrys 0–4 – desert globemallow SPAM2 Sphaeralcea ambigua 0–4 – Shrub/Vine5 Summer Flowering Shrubs 50–150 shadscale saltbush ATCO Atriplex confertifolia 0–75 – Bigelow sage ARBI3 Artemisia bigelovii 0–50 – fourwing saltbush ATCA2 Atriplex canescens 0–20 – yellow rabbitbrush CHVI8 Chrysothamnus viscidiflorus 0–20 – broom snakeweed GUSA2 Gutierrezia sarothrae 0–20 – winterfat KRLA2 Krascheninnikovia lanata 0–10 – Stansbury cliffrose PUST Purshia stansburiana 0–10 – Shrub (>.5m) 2SHRUB Shrub (>.5m) 0–10 – Apache plume FAPA Fallugia paradoxa 0–10 – rubber rabbitbrush ERNA10 Ericameria nauseosa 0–5 – threadleaf ragwort SEFLF Senecio flaccidus var. flaccidus 0–5 – longspine horsebrush TEAX Tetradymia axillaris 0–5 – 6 Spring Flowering Shrubs 10–50 Eastern Mojave buckwheat ERFA2 Eriogonum fasciculatum 0–20 – water jacket LYAN Lycium andersonii 0–20 – blackbrush CORA Coleogyne ramosissima 0–15 – Nevada jointfir EPNE Ephedra nevadensis 0–15 – Torrey's jointfir EPTO Ephedra torreyana 0–15 – mormon tea EPVI Ephedra viridis 0–5 – Cutler's jointfir EPCU Ephedra cutleri 0–5 – desert almond PRFA Prunus fasciculata 0–5 – pallid hoptree PTTRP Ptelea trifoliata ssp. pallida 0–5 – spiny greasebush GLSP Glossopetalon spinescens 0–5 – crispleaf buckwheat ERCO14 Eriogonum corymbosum 0–2 – 7 Yucca and Agave-like 0–10 narrowleaf yucca YUAN2 Yucca angustissima 0–10 – Utah agave AGUT Agave utahensis 0–5 – 8 Cacti 5–25 cottontop cactus ECPOX Echinocactus polycephalus var. xeranthemoides 0–15 – beavertail pricklypear OPBA2 Opuntia basilaris 0–15 – Engelmann's hedgehog cactus ECEN Echinocereus engelmannii 0–10 – Table 8. Community 2.1 plant community composition
Group Common name Symbol Scientific name Annual production () Foliar cover (%) Interpretations
Animal community
The more accessible areas of this site are grazed by cattle, horses, sheep, goats, and wild horses.
There are many species of birds found on this site including canyon wrens, sparrows, doves, roadrunners, and ravens. Other wildlife found on this site include several species of lizards, rabbits, antelope, ground squirrels, and coyotes.Hydrological functions
There are intermittent and perennial streams at the bottom of canyons below this ecological site.
Recreational uses
This site has significant scenic value with views of canyons including the Grand Canyon. The plant community is more diverse than on the surrounding upland sites.
Wood products
There is no potential for the production of wood on this site.
Supporting information
Type locality
Location 1: Coconino County, AZ Latitude 36° 36′ 28″ Longitude 111° 43′ 33″ General legal description Navajo Reservation. NW of Bitter Springs. Unnamed canyon near confluence with Marble Canyon. N aspect. Location 2: Coconino County, AZ Latitude 36° 36′ 50″ Longitude 111° 44′ 9″ General legal description Navajo Reservation. NW of Bitter Springs. Unnamed canyon near the confluence with Marble Canyon. S and SW aspect. Other references
Updates and revisions for this ESD were conducted as part of a 2007-2012 Interagency Technical Assistance Agreement between the Bureau of Indian Affairs–Navajo Region and the NRCS-Arizona.
Contributors
Karlynn Huling
Ken GishiRangeland health reference sheet
Interpreting Indicators of Rangeland Health is a qualitative assessment protocol used to determine ecosystem condition based on benchmark characteristics described in the Reference Sheet. A suite of 17 (or more) indicators are typically considered in an assessment. The ecological site(s) representative of an assessment location must be known prior to applying the protocol and must be verified based on soils and climate. Current plant community cannot be used to identify the ecological site.
Author(s)/participant(s) Kenneth Gishi Contact for lead author State Rangeland Management Specialist - NRCS State Office - Phoenix, AZ Date 08/27/2012 Approved by Approval date Composition (Indicators 10 and 12) based on Annual Production Indicators
-
Number and extent of rills:
Few expected. Rills are not likely in most areas due to extensive surface cover of rock fragment armor and the large amount of rock fragments in the soil profile. -
Presence of water flow patterns:
Occasional water flow patterns are expected. Flow patterns present are usually very short and discontinuous due to frequency of rock fragments on the surface. -
Number and height of erosional pedestals or terracettes:
Some occasional pedestals and terracettes may form, but they will be very short. -
Bare ground from Ecological Site Description or other studies (rock, litter, lichen, moss, plant canopy are not bare ground):
Bare ground ranges from 3-10 percent. -
Number of gullies and erosion associated with gullies:
None. -
Extent of wind scoured, blowouts and/or depositional areas:
None. -
Amount of litter movement (describe size and distance expected to travel):
Herbaceous, fine woody and some coarse woody litter will be transported in water flow pathways. Most coarse woody litter will remain under shrub canopies. There may be more litter movement in areas that are adjacent to large expanses of rock outcrop. -
Soil surface (top few mm) resistance to erosion (stability values are averages - most sites will show a range of values):
Soil surface textures are mostly loamy coarse sand to fine sandy loam. All surface horizons contain a significant amount of rock fragments (gravel, cobbles and/or stones). Most soils have 50-80% cover of rock fragments (mostly gravels and stones with some cobbles.) When well vegetated or covered with rock armor, the soils have a high resistance to both water and wind erosion. -
Soil surface structure and SOM content (include type of structure and A-horizon color and thickness):
Surface thickness range is 2 to 5 inches. Structure is single grain, loose or weak, fine subangular blocky structure. Surface horizon color typically ranges from light brown to yellowish brown, but can vary to reddish brown. -
Effect of community phase composition (relative proportion of different functional groups) and spatial distribution on infiltration and runoff:
The vegetation communities on this site are scattered and patchy. This site is characterized by a dominance of shrubs followed by grasses, succulents and then forbs. Canopy cover range is 20-40 % and is also dominated by shrubs. The plant basal cover ranges from 5-10%, where basal cover values are higher is where more grasses occur. Due to a high amount of rock cover and the site’s low water holding capacity this site is only slight to moderately effective at capturing and storing moisture. -
Presence and thickness of compaction layer (usually none; describe soil profile features which may be mistaken for compaction on this site):
None. These soils are not easily compacted due to the extensive rock fragments throughout the profile. -
Functional/Structural Groups (list in order of descending dominance by above-ground annual-production or live foliar cover using symbols: >>, >, = to indicate much greater than, greater than, and equal to):
Dominant:
Summer flowering shrubs > Warm season grasses > Spring flowering shrubs >Sub-dominant:
Cool season grasses > Cacti >Other:
Forbs > Annual grasses > Yucca & AgavesAdditional:
-
Amount of plant mortality and decadence (include which functional groups are expected to show mortality or decadence):
All plant functional groups are adapted to survive in all but most severe droughts. Severe winter droughts affect shrubs the most. Severe summer droughts affect grasses the most. -
Average percent litter cover (%) and depth ( in):
Litter consists of a combination of herbaceous and woody litter. Litter depth range from 1 leaf thickness to ¼ inches. Litter amounts increase during the first few years of drought, then decrease in later years. Litter amounts can vary greatly between plant canopies and interspaces, and also with aspects. -
Expected annual annual-production (this is TOTAL above-ground annual-production, not just forage annual-production):
Average annual production on this site is expected to be 175-275 lbs/ac. in a year of average annual precipitation. -
Potential invasive (including noxious) species (native and non-native). List species which BOTH characterize degraded states and have the potential to become a dominant or co-dominant species on the ecological site if their future establishment and growth is not actively controlled by management interventions. Species that become dominant for only one to several years (e.g., short-term response to drought or wildfire) are not invasive plants. Note that unlike other indicators, we are describing what is NOT expected in the reference state for the ecological site:
Cheatgrass, red brome, filaree, and Russian thistle -
Perennial plant reproductive capability:
All plants native to this site are adapted and are capable of producing seeds, stolons and rhizomes in all but the most severe drought.
Print Options
Sections
Font
AAAAOther
PrintThe Ecosystem Dynamics Interpretive Tool is an information system framework developed by the USDA-ARS Jornada Experimental Range, USDA Natural Resources Conservation Service, and New Mexico State University.
Accessibility statement