Natural Resources
Conservation Service
-
Search


Major Land Resource Area or ecological site by name and/or ID.
PreviousSectionsNextGeneral information
Provisional. A provisional ecological site description has undergone quality control and quality assurance review. It contains a working state and transition model and enough information to identify the ecological site.
Click to explore map
Figure 1. Mapped extent
Areas shown in blue indicate the maximum mapped extent of this ecological site. Other ecological sites likely occur within the highlighted areas. It is also possible for this ecological site to occur outside of highlighted areas if detailed soil survey has not been completed or recently updated.
MLRA notes
Major Land Resource Area (MLRA): 035X–Colorado Plateau
This ecological site occurs in Common Resource Area 35.8 - the Colorado Plateau Ponderosa Pine Forests
The Common Resource Area occurs within the Colorado Plateau Physiographic Province. Elevations range from 6800 to 8500 feet and precipitation averages 17 to 25 inches per year. Vegetation includes ponderosa pine, white fir, aspen, pinyon, juniper, Gambel oak, big sagebrush, ceanothus, blue elderberry, muttongrass, upland sedge, and big wildrye, mountain muhly, Arizona fescue, pine dropseed, and blue grama. The soil temperature regime ranges from mesic to frigid and the soil moisture regime is typic ustic. This unit occurs within the Colorado Plateau Physiographic Province and is characterized by a sequence of flat to gently dipping sedimentary rocks eroded into plateaus, valleys and deep canyons. Sedimentary rock classes dominate the plateau with volcanic fields occurring for the most part near its margin.
Associated sites
R035XH807AZ Loamy Upland 17-25" p.z.
Deep and very deep soils in wide drainageways and open valleys.
Similar sites
F035XH805AZ Loamy Hills 17-25" p.z. (PIPO)
Steeper slopes, hills and escarpments.
Table 1. Dominant plant species
Tree (1) Pinus ponderosa
(2) Quercus gambeliiShrub (1) Artemisia tridentata ssp. wyomingensis
(2) Ceanothus fendleriHerbaceous (1) Poa fendleriana
(2) Carex rossiiPhysiographic features
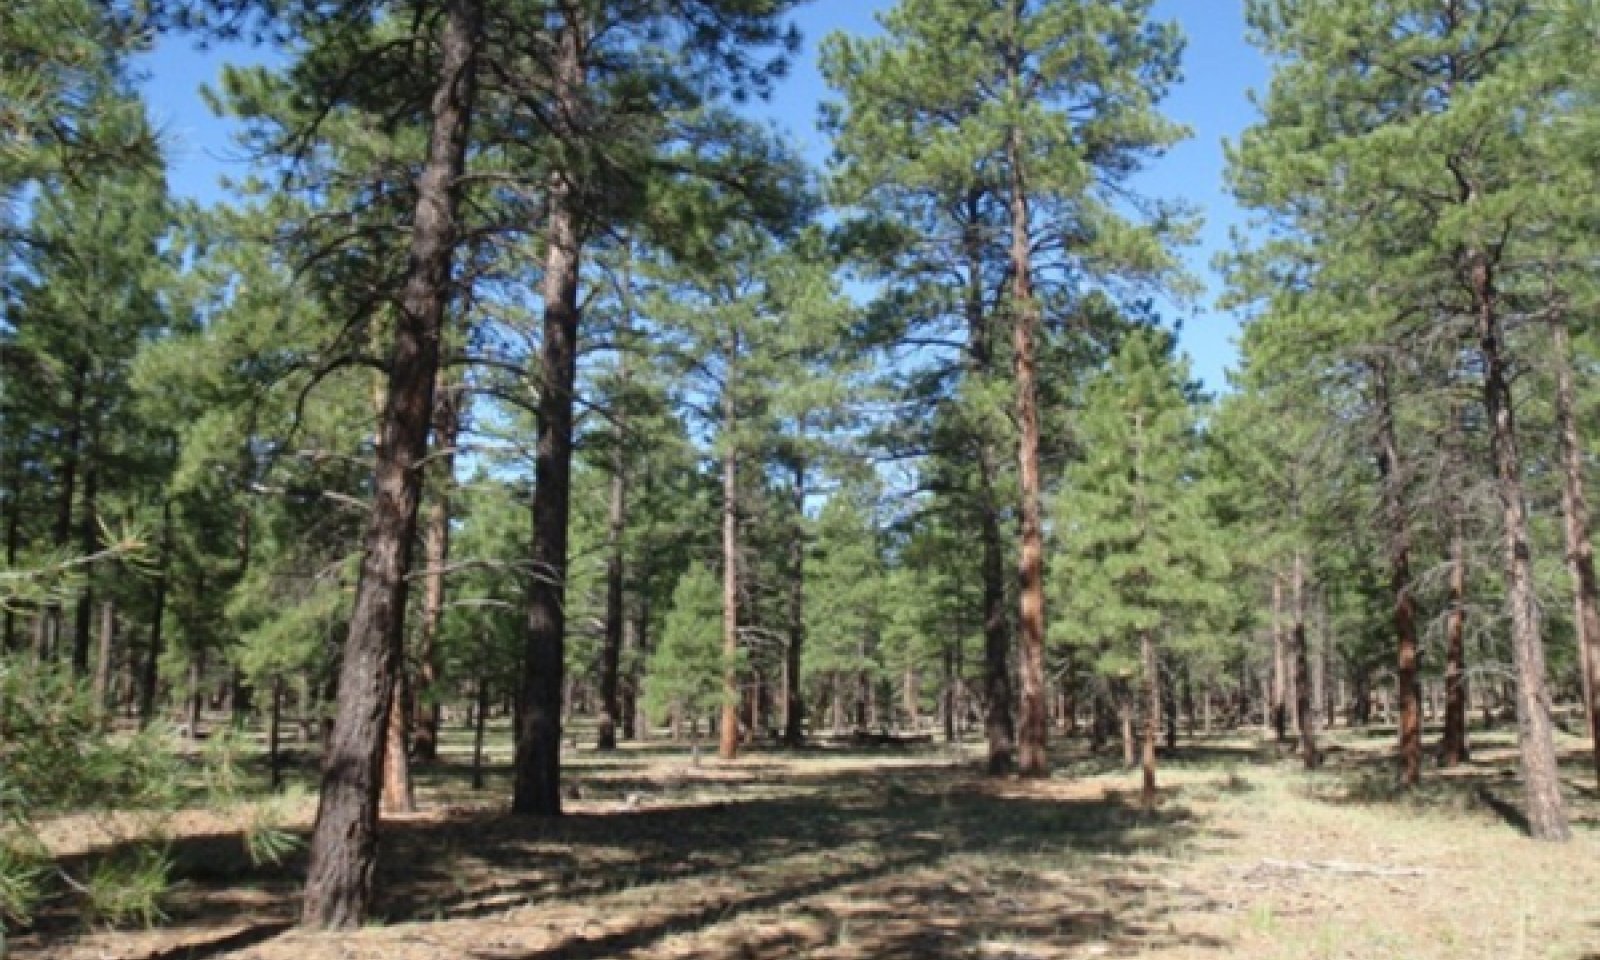
This site is a forestland dominated by ponderosa pine. It occurs on nearly level to gently sloping plateaus, benches, and mesas. Soils are typically moderately deep, well-developed and non effervescent. The site can have small inclusions of deeper soils, or shallow soils associated with rock outcrops. Slopes on this site generally range from 1 - 15%, occasionally as high as 20%. The site does not benefit significantly from run-on moisture from adjacent sites.
Table 2. Representative physiographic features
Landforms (1) Plateau
(2) Mesa
(3) Structural bench
Elevation 6800 – 8500 ft Slope 0 – 15 % Aspect Aspect is not a significant factor Climatic features
Winter-summer moisture ratios are typically 70:30 on the west side of this LRU and shift to 60:40 on the east side. Late spring is usually the driest period, and early fall moisture can be sporadic. Summer rains fall from June through September; moisture originates in the Gulf of Mexico and creates convective, usually brief, intense thunderstorms. Cool season moisture from October through May tends to be frontal; It originates in the Pacific Ocean and the Gulf of California and falls in widespread storms with longer duration and lower intensity. Precipitation generally comes as snow from October into April. Snowpack can persist for 3-4 months, although it may disappear in exposed areas during prolonged dry weather. Summer daytime temperatures are typically 80-90 but can exceed 95 degrees F. Winter temperatures of around 0 degrees F are common and can reach -25 degrees F.
Table 3 Representative climatic features
Frost-free period (average) 100 days Freeze-free period (average) 130 days Precipitation total (average) 30 in BarLineFigure 2. Monthly precipitation range
BarLineFigure 3. Monthly average minimum and maximum temperature
">Influencing water features
The soil moisture on this ecological site comes from precipitation. The site does not benefit significantly from run-on moisture. The loamy surface texture of the soil allows the site to capture the majority of the winter storms and the light to moderate summer storms if the site has good vegetative cover. Intense summer thunderstorms will produce runoff, reducing the amount of effective rainfall.
Soil features
The soils on this site are moderately deep. They have been formed in place from residuum. Surfaces have a O horizon 1-4 inches deep. The surface textures of the mineral soil range from sandy loam to silt loam, sometimes gravelly. The A horizon is typically no more than 6 inches thick. Subsurface textures are clay loam to clay, occasionally gravelly. An argillic horizon is unually present; in come cases it has been degraded away.
Soil survey map unit components that have been correlated to this ecolgical site include:
SSA-625 Mohave county NE 12-Godding;
SSA-701 Grand Canyon area 37-Elledge Family, 91-Pinntank;
SSA-713 Chinle Area 21-Jacks/Manuelito, 26-Jacks family/Pachic Haplustolls, 59-Jacks family
SSA-715 Ft Defiance 54-Manuelito, 55-Manuelito
SSA-717 Shiprock area 10-Kunz.Table 4. Representative soil features
Surface texture (1) Gravelly loam
(2) Gravelly sandy loam
(3) Gravelly silt loam
Family particle size (1) Clayey
Drainage class Well drained Permeability class Very slow to slow Soil depth 20 – 40 in Surface fragment cover <=3" 0 – 10 % Available water capacity
(0-40in)2.5 – 7 in Electrical conductivity
(0-40in)0 – 2 mmhos/cm Soil reaction (1:1 water)
(0-40in)6.6 – 7.3 Subsurface fragment volume <=3"
(Depth not specified)0 – 15 % Ecological dynamics
The plant communities found on an ecological site are naturally variable. Composition and production will vary with yearly conditions, location, aspect, and the natural variability of the soils. The historical climax plant community represents the natural potential plant communities found on relict or relatively undisturbed sites. Other plant communities described here represent plant communities that are known to occur when the site is disturbed by factors such as grazing, fire, or drought.
Production data provided in this site description is standardized to air-dry weight at the end of the summer growing season. The plant communities described in this site description are based on near normal rainfall years.
NRCS uses a Similarity Index to compare existing plant communities to the plant communities described here. Similarity Index is determined by comparing the production and composition of a plant community to the production and composition of a plant community described in this site description. To determine Similarity Index, compare the production (air-dry weight) of each species to that shown in the plant community description. For each species, count no more than the maximum amount shown for the species, and for each group, count no more than the maximum shown for the group. Divide the resulting total by the total normal year production shown in the plant community description. If rainfall has been significantly above or below normal, use the total production shown for above or below normal years. If field data is not collected at the end of the summer growing season, then the field data must be corrected to the end of the year production before comparing it to the site description. The growth curve can be used as a guide for estimating production at the end of the summer growing season.
The State and Transition model shows the most common occurring plant communities likely to be encountered on this ecological site. This model may not show every possible plant community, but only those that are most prevalent and observed through field inventory. As more data is collected and research is available, these plant communities may be revised, removed, and even added to reflect the ecological dynamics of this site.State and transition model
Custom diagramStandard diagram
Figure 4. 358 LoamyUpland S&T
More interactive model formats are also available. View Interactive Models
More interactive model formats are also available. View Interactive Models
Click on state and transition labels to scroll to the respective textEcosystem states
State 1 submodel, plant communities
State 2 submodel, plant communities
State 1
Reference StateThis is a forest site that is dominated by a ponderosa pine tree overstory. Cool season grasses dominate the understory vegetation with shrubs and forbs as minor components throughout the site. Fire suppression, grazing and favorable climatic conditions have increased shrub and/or tree components of theis site. This is in conjunction with decreased amounts of grass cover and an increase in pine needle litter and annuals.
Community 1.1
Historic Climax Plant Community
Figure 5. Loamy Upland 17-25" p.z.
1.1 This site was developed under historic Colorado Plateau climatic conditions and reflects the natural influences of herbivores, climate fluctuations and occasional fire.
This community has an overstory layer dominated by mature and widely-spaced ponderosa pine. The shrub layer is intermittent. Grasses are dominantly cool-season perennials and make up a substantial part of the vegetation. Perennial and annual forbs are also well represented.Figure 6. Annual production by plant type (representative values) or group (midpoint values)
Table 5. Annual production by plant type
Plant type Low
(lb/acre)Representative value
(lb/acre)High
(lb/acre)Grass/Grasslike 265 318 370 Forb 75 113 150 Shrub/Vine 5 27 55 Tree 5 28 55 Total 350 486 630 Figure 7. Plant community growth curve (percent production by month). AZ3581 , 35.8 17-25" p.z. all sites. Growth begins in the spring, most growth occurs during the summer rainy season..
Jan Feb Mar Apr May Jun Jul Aug Sep Oct Nov Dec J F M A M J J A S O N D 0 0 0 4 10 24 21 23 13 5 0 0 Figure 8. Plant community growth curve (percent production by month). AZ3901 , 35.8 17-25" p.z. muttongrass. Growth begins in the spring and extends through the summer rainy season..
Jan Feb Mar Apr May Jun Jul Aug Sep Oct Nov Dec J F M A M J J A S O N D 0 0 0 5 10 30 20 20 10 5 0 0 Figure 9. Plant community growth curve (percent production by month). AZ3902 , 35.8 17-25" p.z. Arizona fescue. Growth begins in the late spring and extends through the summer rainy season..
Jan Feb Mar Apr May Jun Jul Aug Sep Oct Nov Dec J F M A M J J A S O N D 0 0 0 0 5 20 30 30 10 5 0 0 Community 1.2
Ponderosa Pine Overstory with Increased Shrub UnderstoryFire suppression and grazing have decreased the amount of grass understory and various shrubs have increased on the site.
Pathway 1.1A
Community 1.1 to 1.2Fire suppression and unmanaged grazing.
Pathway 1.2A
Community 1.2 to 1.1Brush treatment and possible grass re-seeding.
State 2
Heavy OverstoryThis state has a very dense overstory of ponderosa pine trees. Much of the understory vegetation is excluded from this plant community. It takes large amounts of energy to return to the reference plant community.
Community 2.1
Heavy OverstoryThick pondrosa pine overstory with a very diminished plant community understory.
Transition T1A
State 1 to 2Lack of fire/fire suppression, excessive grazing, high precipitation years
Restoration pathway R2A
State 2 to 1Thinning of forest overstory, burning of understory and possible re-seeding
Additional community tables
Table 6. Community 1.1 plant community composition
Group Common name Symbol Scientific name Annual production () Foliar cover (%) Grass/Grasslike1 Grasses 265–370 muttongrass POFE Poa fendleriana 55–160 – Ross' sedge CARO5 Carex rossii 5–80 – big squirreltail ELMU3 Elymus multisetus 10–55 – Arizona fescue FEAR2 Festuca arizonica 0–25 – blue grama BOGR2 Bouteloua gracilis 0–25 – mountain muhly MUMO Muhlenbergia montana 0–25 – prairie Junegrass KOMA Koeleria macrantha 0–15 – pinyon ricegrass PIFI Piptochaetium fimbriatum 0–5 – bluebunch wheatgrass PSSP6 Pseudoroegneria spicata 0–5 – Porter brome BRPO2 Bromus porteri 0–5 – Grass, perennial 2GP Grass, perennial 0–5 – pine dropseed BLTR Blepharoneuron tricholepis 0–5 – needle and thread HECOC8 Hesperostipa comata ssp. comata 0–5 – Forb2 Perennial Forbs 55–105 cinquefoil POTEN Potentilla 0–15 – ragwort SENEC Senecio 0–15 – goldenrod SOLID Solidago 0–15 – Forb, perennial 2FP Forb, perennial 0–15 – Indian paintbrush CASTI2 Castilleja 0–15 – silvery lupine LUAR3 Lupinus argenteus 0–15 – Hill's lupine LUHI2 Lupinus hillii 0–15 – tansyaster MACHA Machaeranthera 0–15 – toadflax penstemon PELI2 Penstemon linarioides 0–15 – Utah bird's-foot trefoil LOUT3 Lotus utahensis 0–10 – Wright's deervetch LOWR Lotus wrightii 0–10 – larkspur DELPH Delphinium 0–10 – redroot buckwheat ERRA3 Eriogonum racemosum 0–10 – aspen fleabane ERSPM Erigeron speciosus var. macranthus 0–10 – pussytoes ANTEN Antennaria 0–10 – Fendler's sandwort ARFE3 Arenaria fendleri 0–5 – sego lily CANU3 Calochortus nuttallii 0–5 – western yarrow ACMIO Achillea millefolium var. occidentalis 0–5 – Lewis flax LILE3 Linum lewisii 0–5 – rock goldenrod PETRA Petradoria 0–5 – beardlip penstemon PEBA2 Penstemon barbatus 0–5 – yellow salsify TRDU Tragopogon dubius 0–5 – 3 Annual Forbs 25–50 Forb, annual 2FA Forb, annual 0–10 – milkvetch ASTRA Astragalus 0–10 – Wheeler's thistle CIWH Cirsium wheeleri 0–10 – trailing fleabane ERFL Erigeron flagellaris 0–10 – Cooper's rubberweed HYCO2 Hymenoxys cooperi 0–10 – fineleaf hymenopappus HYFI Hymenopappus filifolius 0–10 – scarlet gilia IPAG Ipomopsis aggregata 0–10 – lousewort PEDIC Pedicularis 0–10 – desert Indianwheat PLOV Plantago ovata 0–10 – hillside vervain VENE Verbena neomexicana 0–10 – Shrub/Vine4 Shrubs 5–50 Wyoming big sagebrush ARTRW8 Artemisia tridentata ssp. wyomingensis 0–25 – Fendler's ceanothus CEFE Ceanothus fendleri 0–25 – black sagebrush ARNO4 Artemisia nova 0–20 – rubber rabbitbrush ERNAN5 Ericameria nauseosa ssp. nauseosa var. nauseosa 0–15 – broom snakeweed GUSA2 Gutierrezia sarothrae 0–10 – Gambel oak QUGA Quercus gambelii 0–10 – wax currant RICE Ribes cereum 0–5 – New Mexico raspberry RUNE Rubus neomexicanus 0–5 – blue elderberry SANIC5 Sambucus nigra ssp. cerulea 0–5 – mountain snowberry SYOR2 Symphoricarpos oreophilus 0–5 – pingue rubberweed HYRI Hymenoxys richardsonii 0–5 – Fremont's mahonia MAFR3 Mahonia fremontii 0–5 – creeping barberry MARE11 Mahonia repens 0–5 – Stansbury cliffrose PUST Purshia stansburiana 0–5 – Shrub (>.5m) 2SHRUB Shrub (>.5m) 0–5 – Tree5 Evergreen Trees 5–50 ponderosa pine PIPO Pinus ponderosa 5–50 – white fir ABCO Abies concolor 0–5 – Utah juniper JUOS Juniperus osteosperma 0–5 – Rocky Mountain juniper JUSC2 Juniperus scopulorum 0–5 – twoneedle pinyon PIED Pinus edulis 0–5 – 6 Deciduous trees 0–15 Gambel oak QUGA Quercus gambelii 0–15 – quaking aspen POTR5 Populus tremuloides 0–5 – Table 7. Community 1.2 plant community composition
Group Common name Symbol Scientific name Annual production () Foliar cover (%) Table 8. Community 2.1 plant community composition
Group Common name Symbol Scientific name Annual production () Foliar cover (%) Interpretations
Animal community
Site is favorable for grazing throughout most of the year except when snow cover restricts availability of forage. With continuous grazing use during winter and spring, the relatively scarce cool season mid grasses are replaced by rabbit brush, snakeweed and lower value forbs and grasses. Planned grazing systems adapt well to use on this site.
Recreational uses
Winters are cold, however, relatively mild spring, fall and summer months are attractive to recreationists.
Activities include hunting, cross-country riding, photography, hiking, rock collecting, and wildlife observation.
Supporting information
Other references
Updates and revisions for this ESD were conducted as part of a 2007-2012 Interagency Technical Assistance Agreement between the Bureau of Indian Affairs–Navajo Region and the NRCS-Arizona.
Contributors
Art Meen
Dan Carroll
Karlynn Huling
Larry D. EllicottRangeland health reference sheet
Interpreting Indicators of Rangeland Health is a qualitative assessment protocol used to determine ecosystem condition based on benchmark characteristics described in the Reference Sheet. A suite of 17 (or more) indicators are typically considered in an assessment. The ecological site(s) representative of an assessment location must be known prior to applying the protocol and must be verified based on soils and climate. Current plant community cannot be used to identify the ecological site.
Author(s)/participant(s) Contact for lead author Date Approved by Approval date Composition (Indicators 10 and 12) based on Annual Production Indicators
-
Number and extent of rills:
-
Presence of water flow patterns:
-
Number and height of erosional pedestals or terracettes:
-
Bare ground from Ecological Site Description or other studies (rock, litter, lichen, moss, plant canopy are not bare ground):
-
Number of gullies and erosion associated with gullies:
-
Extent of wind scoured, blowouts and/or depositional areas:
-
Amount of litter movement (describe size and distance expected to travel):
-
Soil surface (top few mm) resistance to erosion (stability values are averages - most sites will show a range of values):
-
Soil surface structure and SOM content (include type of structure and A-horizon color and thickness):
-
Effect of community phase composition (relative proportion of different functional groups) and spatial distribution on infiltration and runoff:
-
Presence and thickness of compaction layer (usually none; describe soil profile features which may be mistaken for compaction on this site):
-
Functional/Structural Groups (list in order of descending dominance by above-ground annual-production or live foliar cover using symbols: >>, >, = to indicate much greater than, greater than, and equal to):
Dominant:
Sub-dominant:
Other:
Additional:
-
Amount of plant mortality and decadence (include which functional groups are expected to show mortality or decadence):
-
Average percent litter cover (%) and depth ( in):
-
Expected annual annual-production (this is TOTAL above-ground annual-production, not just forage annual-production):
-
Potential invasive (including noxious) species (native and non-native). List species which BOTH characterize degraded states and have the potential to become a dominant or co-dominant species on the ecological site if their future establishment and growth is not actively controlled by management interventions. Species that become dominant for only one to several years (e.g., short-term response to drought or wildfire) are not invasive plants. Note that unlike other indicators, we are describing what is NOT expected in the reference state for the ecological site:
-
Perennial plant reproductive capability:
Print Options
Sections
Font
AAAAOther
PrintThe Ecosystem Dynamics Interpretive Tool is an information system framework developed by the USDA-ARS Jornada Experimental Range, USDA Natural Resources Conservation Service, and New Mexico State University.
Accessibility statement