Natural Resources
Conservation Service
Ecological site DX035X01I117
Sandy Loam Upland
10-14" p.z.
Last updated: 5/02/2024
Accessed: 07/09/2026
-
Search


Major Land Resource Area or ecological site by name and/or ID.
PreviousSectionsNextGeneral information
Provisional. A provisional ecological site description has undergone quality control and quality assurance review. It contains a working state and transition model and enough information to identify the ecological site.
Click to explore map
Figure 1. Mapped extent
Areas shown in blue indicate the maximum mapped extent of this ecological site. Other ecological sites likely occur within the highlighted areas. It is also possible for this ecological site to occur outside of highlighted areas if detailed soil survey has not been completed or recently updated.
MLRA notes
Major Land Resource Area (MLRA): 035X–Colorado Plateau
This ecological site occurs in Common Resource Area 35.1 - the Colorado Plateau Mixed Grass Plains
Elevations range from 4800 to 6300 feet and precipitation averages 10 to 14 inches per year. Vegetation includes Stipa species, Indian ricegrass, galleta, and blue grama, fourwing saltbush, winterfat, and cliffrose. The soil temperature regime is mesic and the soil moisture regime is ustic aridic. This unit occurs within the Colorado Plateau Physiographic Province and is characterized by a sequence of flat to gently dipping sedimentary rocks eroded into plateaus, valleys and deep canyons. Sedimentary rock classes dominate the plateau with volcanic fields occurring for the most part near its margin.Ecological site concept
This site occurs in an upland position on gently sloping plains or alluvial fans.
Soils are moderately deep to very deep. Surface horizons have textures of sandy loam to fine sandy loam. Subsurface horizons have textures ranging from clay to sandy loam. There may be thin strata of finer and/or coarser textures. The pH ranges from neutral to moderately alkaline (pH 6.6 to 8.4).Table 1. Dominant plant species
Tree Not specified
Shrub (1) Atriplex canescens
(2) Krascheninnikovia lanataHerbaceous (1) Bouteloua gracilis
(2) Bouteloua eriopodaLegacy ID
R035XA117AZ
Physiographic features
This ecological site occurs in an upland position on gently sloping plains or alluvial fans. It neither benefits significantly from run-in nor experiences excessive runoff of moisture.
Table 2. Representative physiographic features
Landforms (1) Alluvial fan
(2) Plain
Flooding frequency Rare Elevation 4800 – 6300 ft Slope 0 – 15 % Aspect Aspect is not a significant factor Climatic features
50-60% of moisture falls as rain from July through September and is the most effective moisture for plant growth. The remaining moisture comes as snow during the winter.
Mean temperatures for the hottest month (July) is 72 degrees F; for the coldest month (January) is 32 degrees F. Extreme temperatures of 105 degrees F and -26 degrees F have been recorded. Long periods with little or no effective moisture are relatively common.
Cool season plants begin growth in early spring and mature in the early summer. Warm season plants take advantage of summer rains and grow from July through September.Table 3 Representative climatic features
Frost-free period (average) 170 days Freeze-free period (average) 150 days Precipitation total (average) 10 in BarLineFigure 2. Monthly precipitation range
BarLineFigure 3. Monthly average minimum and maximum temperature
Figure 4. Annual precipitation pattern
Figure 5 Annual average temperature pattern
">Influencing water features
This is an upland site, and is not associated with water features or wetlands. During heavy rain events, this site may receive run-on moisture from landforms above and contribute runoff to landforms below.
Soil features
These soils are moderately deep to deep with no plant root restricting layers. Surface horizons have textures of sandy loam to fine sandy loam about 4 to 10 inches thick. Subsurface horizons have textures ranging from clay to sandy loam. There may be thin strata of finer and/or coarser textures. The pH ranges from neutral to moderately alkaline (pH 6.6 to 8.4). Water erosion hazard is moderate and the wind erosion hazard is severe.
Typical taxonomic units include:
Coconino County Central (AZ631)Soil Map Units -7-Clovis loamy sand;21-Poley gravelly sandy loam;30-Poley sandy loam;27-Palma sandy loam;25-Palma;21-Keeseha gravelly sandy loam; Navajo County central (AZ633) Soil Map Units -11-Cerrillos,12-Cerrillos,44-Cerrillos;12-Ubank;
Apache County central (AZ635) Soil Map Units - CLB-Clovis, CmB-Clovis, CmC-Clovis, CnB-Clovis, CnC-Clovis, CnE-Clovis, CTB-Clovis; CTB-Palma,PAB-Palma,PSB-Palma;FRB-Fruitland;
Yavapai County western (AZ637) Soil Map Units -PaB-Palma .
Little Colorado River(AZ707) Soil Map Units- 30-Councelor
Navajo Mountain(AZ711) Soil Map Units- 5-Begay, 24-Councelor
Chinle (AZ713)Soil Map Units- 39-Councelor
Fort Defiance Area (AZ715)- Soil Map Units -
11-Begay,12-Begay;15-Betonnie,80-Betonnie;11-Milok family; 12-Penistaja;137-Zia;16-Bighams.Table 4. Representative soil features
Parent material (1) Alluvium – gneiss
Surface texture (1) Sandy loam
(2) Fine sandy loam
Family particle size (1) Clayey
Drainage class Moderately well drained to well drained Permeability class Slow to rapid Soil depth 40 – 60 in Surface fragment cover <=3" 0 – 10 % Surface fragment cover >3" Not specified Available water capacity
(0-40in)4.6 – 9.4 in Calcium carbonate equivalent
(0-40in)5 – 35 % Electrical conductivity
(0-40in)0 – 2 mmhos/cm Sodium adsorption ratio
(0-40in)0 – 5 Soil reaction (1:1 water)
(0-40in)6.6 – 8.4 Subsurface fragment volume <=3"
(Depth not specified)0 – 20 % Subsurface fragment volume >3"
(Depth not specified)Not specified Ecological dynamics
Reference plant community for a site in North America is the plant community that existed at the time of European immigration and settlement. It is the plant community that was best adapted to the unique combination of environmental factors associated with the site at that time. The reference community was in dynamic equilibrium with its environment and was able to avoid displacement by the suite of disturbances and disturbance patterns (magnitude and frequency) that naturally occurred within the area occupied by the site. Natural disturbances, such as drought, fire, grazing of native fauna, and insects, were inherent in the development and maintenance of the plant community. The effects of these disturbances are part of the range of characteristics of the site that contribute to the dynamic equilibrium. Fluctuations in the plant community’s structure and function caused by the effects of these natural disturbances establish the boundaries of dynamic equilibrium. They are accounted for as part of the range of characteristics for the ecological site. The reference community is not a precise assemblage of species for which the proportions are the same from place to place or from year to year. Variability is apparent in productivity and occurrence of individual species.
The reference community for this ecological site has been estimated by sampling relict or relatively undisturbed sites and/or reviewing historic records.
A plant community that is subjected to abnormal disturbances and physical site deterioration or that is protected from natural influences, such as fire and grazing, for long periods seldom typifies the reference community. Any physical site deterioration caused by the abnormal disturbance may result in the crossing of a threshold or irreversible boundary to another state, or equilibrium, for the ecological site. There may be multiple thresholds and states possible for an ecological site, determined by the type and or severity of abnormal disturbance. The known states and transition pathways for this ecological site are described in the accompanying state and transition model.
The “Plant Community Plant Species Composition” table provides a list of species and each species or group of species’ annual production in pounds per acre (air-dry weight) expected in a normal rainfall year. Low and high production yields represent the modal range of variability for that species or group of species across the extent of the ecological site.
The “Annual Production by Plant Type” table provides the median air-dry production and the fluctuations to be expected during favorable, normal, and unfavorable years.
The present plant community on an ecological site can be compared to the various common vegetation states that can exist on the site. The degree of similarity is expressed through a similarity index. To determine the similarity index, compare the production of each species to that shown in the plant community description. For each species, count no more than the maximum amount shown for the species, and for each group, count no more than the maximum shown for the group. Divide the resulting total by the total representative value shown in the “Annual Production by Plant Type” table for the reference plant community. Variations in production due to above or below normal rainfall, incomplete growing season or utilization must be corrected before comparing it to the site description. The “Worksheet for Determining Similarity Index” is useful in making these corrections. The accompanying growth curve can be used as a guide for estimating percent of growth completed.
The State and Transition model shows the most common occurring plant communities likely to be encountered on this ecological site. This model may not show every possible plant community, but only those that are most prevalent and observed through field inventory. As more data is collected and research is available, these plant communities may be revised, removed, and even added to reflect the ecological dynamics of this site.State and transition model
Custom diagramStandard diagram
Figure 6. State and Transition Model - R035XA117AZ
More interactive model formats are also available. View Interactive Models
More interactive model formats are also available. View Interactive Models
Click on state and transition labels to scroll to the respective textEcosystem states
States 1 and 5 (additional transitions)
State 1 submodel, plant communities
State 2 submodel, plant communities
State 3 submodel, plant communities
State 4 submodel, plant communities
State 5 submodel, plant communities
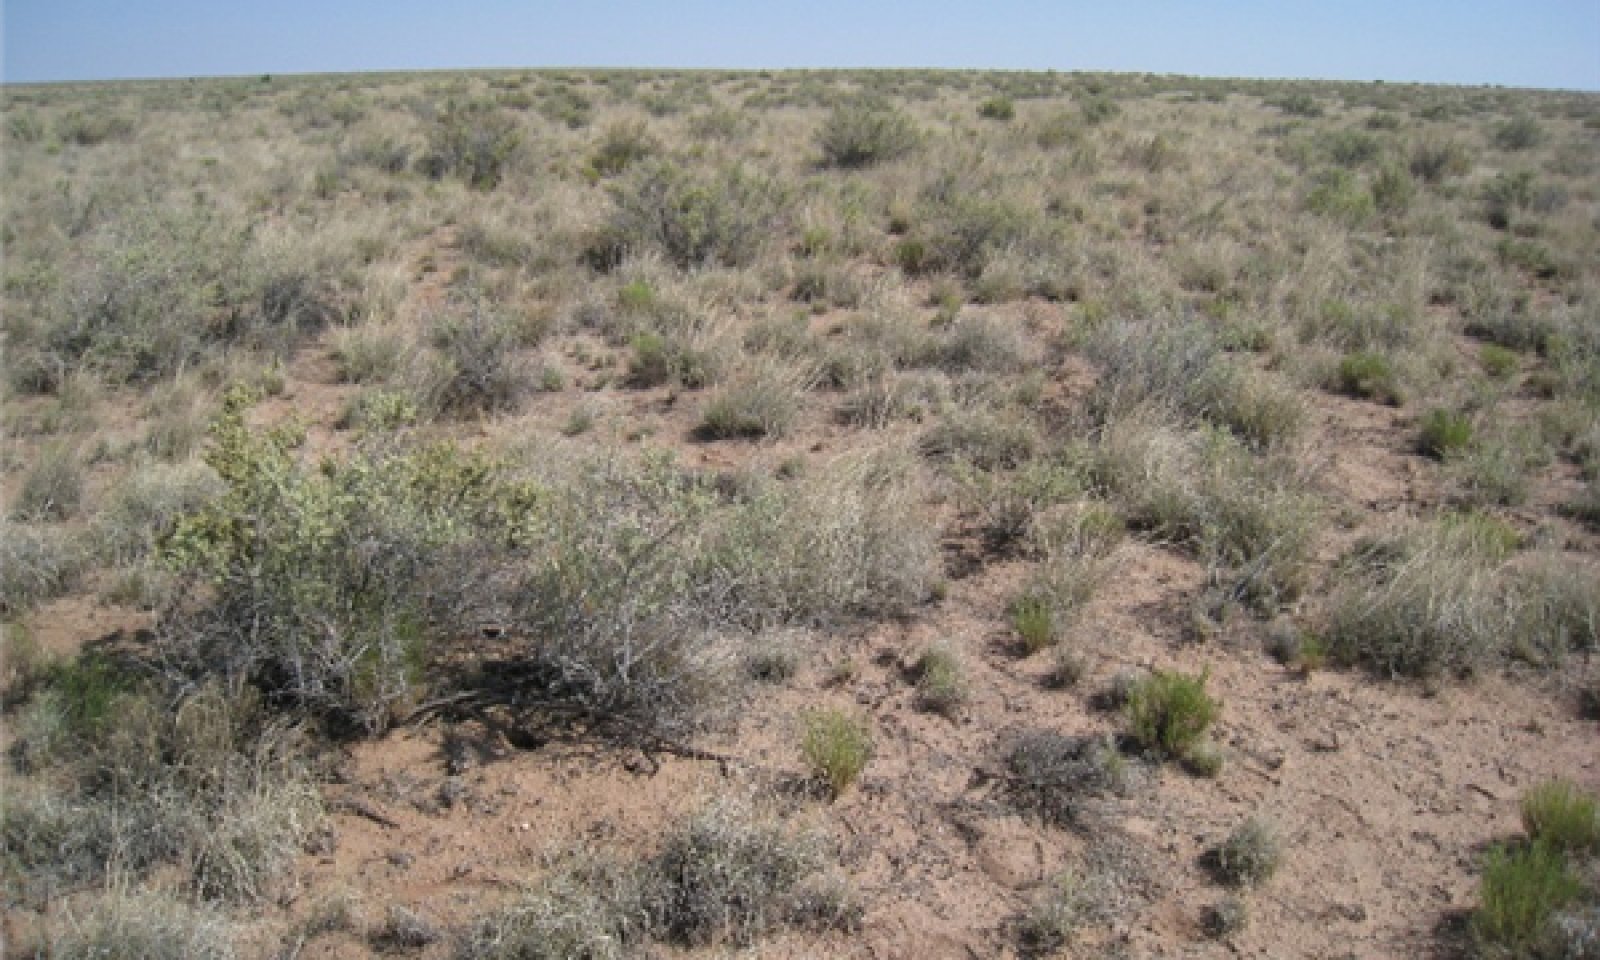
State 1
Reference StateThis state represents the most ecologically stable conditions in terms of resistance to erosion. Moreover, this state has the highest potential for productivity and plant diversity.
Community 1.1
Grassland with Mixed Shrub (Reference Plant Community)
Figure 7. Grassland with Mixed Shrub - HCPC

Figure 8. Grassland with Mixed Shrub Community
The reference state plant community is composed primarily of warm season mid-grasses and short grasses with a small percentage of cool season grasses and half-shrubs. Dominant grasses include blue grama, black grama, sand dropseed and galleta. Dominant shrubs include fourwing saltbush and Greene's rabbitbrush. Natural climatic variation result in changes in the amount of and ratio of both individual plants and warm season versus cool season plants, especially grasses.
Figure 9. Annual production by plant type (representative values) or group (midpoint values)
Table 5. Annual production by plant type
Plant type Low
(lb/acre)Representative value
(lb/acre)High
(lb/acre)Grass/Grasslike 245 560 805 Shrub/Vine 50 120 175 Forb 25 60 85 Tree 5 20 30 Total 325 760 1095 Table 6. Soil surface cover
Tree basal cover 0% Shrub/vine/liana basal cover 0-10% Grass/grasslike basal cover 20-30% Forb basal cover 0-10% Non-vascular plants 0-0% Biological crusts 0-20% Litter 30-40% Surface fragments >0.25" and <=3" 0-0% Surface fragments >3" 0% Bedrock 0% Water 0% Bare ground 40-50% Table 7. Canopy structure (% cover)
Height Above Ground (ft) Tree Shrub/Vine Grass/
GrasslikeForb <0.5 – 0-5% 15-25% 1-5% >0.5 <= 1 – 0-5% 10-20% 1-5% >1 <= 2 – 0-5% 0-10% 0-1% >2 <= 4.5 – 0-5% 0-5% 0-1% >4.5 <= 13 – – – – >13 <= 40 – – – – >40 <= 80 – – – – >80 <= 120 – – – – >120 – – – – Figure 10. Plant community growth curve (percent production by month). AZ3511 , 35.1 10-14" p.z. all sites. Growth begins in the spring and continues through the summer, most growth occurs during the summer rainy season. .
Jan Feb Mar Apr May Jun Jul Aug Sep Oct Nov Dec J F M A M J J A S O N D 0 0 1 5 11 18 25 24 13 3 0 0 Figure 11. Plant community growth curve (percent production by month). AZ5102 , 35.1 10-14" p.z. blue grama. Growth occurs mostly in summer and early fall during the rainy season..
Jan Feb Mar Apr May Jun Jul Aug Sep Oct Nov Dec J F M A M J J A S O N D 0 0 0 5 5 15 30 30 15 0 0 0 Figure 12. Plant community growth curve (percent production by month). AZ5213 , 35.1 10-14" p.z. winterfat. Growth begins in the spring and continues through the summer. Seed stalk extension and seed set occurs in summer..
Jan Feb Mar Apr May Jun Jul Aug Sep Oct Nov Dec J F M A M J J A S O N D 0 0 5 15 25 20 10 15 10 0 0 0 Community 1.2
Perennial Grassland with Low Shrubs
Figure 13. Grassland with Low Shrubs (CHGR6, GUSA2)
This plant community is characterized as a perennial grassland with scattered shrubs. Grasses that are dominant on the site are blue grama, galleta, Indian ricegrass, dropseeds and occasional black grama and needle and thread. The shrub component is mostly low growing small shrubs such as snake weed, Greene's rabbitbrush, mormon tea, fourwing saltbush and occasional winterfat and Bigelow sage.
Pathway 1.1a
Community 1.1 to 1.2
Grassland with Mixed Shrub (Reference Plant Community)
Perennial Grassland with Low ShrubsDrought, insect herbivory, unmanaged grazing. Unmanaged grazing can be described here as: Season-long grazing providing little rest and recovery for preferred grazed plants during critical growing periods, coupled with high utilization.
Pathway 1.2a
Community 1.1 to 1.2
Grassland with Mixed Shrub (Reference Plant Community)
Perennial Grassland with Low ShrubsDrought, insect/wildlife herbivory, unmanaged grazing
State 2
Shrub Dominated StateThe general aspect of this site is shrubland with an increase of snakeweed, rabbitbrush, mormon tea and a decrease of fourwing saltbush, winterfat and Bigelow sage. Grasses are dominated by blue grama, galleta and dropseeds with a decline of black grama and cool season grasses. This site has an increase of run-off and bare ground.
Community 2.1
Mixed Shrubland
Figure 14. Mixed shrubland with perennial grasses
This plant community resembles 1.1, but includes a small percentage of non-native annual grasses and forbs, such as cheatgrass, filaree and Russian thistle and an increase in shrubs. It generally reacts to climatic fluctuations and grazing much like the reference state.
Shrubs that increase on this site are Greene's rabbitbrush, snakeweed and Cutler's mormon tea. Other shrubs are present but in lesser amounts including fourwing saltbush, winterfat and Bigelow sage. Grasses are similar to reference state, except for a decline of black grama and cool season grasses with an increase in blue grama and galleta. Native and Non-native annual grasses and forbs can range in composition due to climatic fluctuations and grazing intensity. At higher elevations this plant community may have occasional scattered junipers.State 3
Juniper StateThe general aspect of this site is an overstory of junipers with half shrubs and succulents. The understory is mostly blue grama, galleta with scattered forbs. This site has increased runoff and water flow patterns. Juniper canopies range from 10-20%, depending on grazing intensity, climate fluctuations and fire exclusion.
Community 3.1
Mixed Understory with Juniper Overstory
Figure 15. Mixed understory with Junipers

Figure 16. Mixed understory shrub dominate with Juniper Overstory
This site is characterized by an increase of juniper canopy greater than 10% with an understory of shrubs mainly comprised of half shrubs, Mormon tea and Yucca. Grasses consist primarily of blue grama with smaller percentages of galleta and dropseeds. There is an increase in annual forbs. A lack of fire, unmanaged grazing and above normal winter precipitation result in an increase of juniper and cool season annual forbs. As juniper canopies increase, bare ground and runoff rates increase and infiltration rates are reduced resulting in the loss of herbaceous cover.
State 4
Shrubs with Annuals StateThe general aspect of the site is a low shrubland with annuals. Snakeweed and rabbitbrush are the dominant overstory species with low perennial herbaceous cover. Composition of annuals in this state can range from 20-50% depending on climate variation and diturbance frequency.
Community 4.1
Half Shrubs with Annuals
Figure 17. Shrub - annual plant community
This plant community is characterized by a dominance of snakeweed, rabbitbrush and other shrubs with a mix of annual forbs. Dominant shrubs are rabbitbrush, snakeweed and Bigelow sage with scattered succulents and Mormon tea. Herbaceous cover is dominanted by a mix of annual grasses and forbs. Common annuals include cheatgrass, false buffalograss, sixweeks fescue, Russian thistle and other annuals. Forb composition can range from 15 to 30% with a decline in perennial grass composition.
State 5
Seeded Grass StateThe general aspect of this site is a grassland. These sites are areas where the juniper overstory has been removed or reduced and the site is seeded with perennial grasses.
Community 5.1
Treated and Seeded with Native Grasses
Figure 18. Treated area dominated by grasses with shrubs

Figure 19. Treated area dominanted by perennial grasses
This plant community is characterized by a dominance of native grasses. The composition of the grasses, shrubs and forbs is varied and will depend on the species seeded and/or the seed sources available within the treated areas.
Transition T1A
State 1 to 2Drought; season-long grazing providing little rest and recovery for preferred grazed plants during critical growing periods, coupled with high utilization.
Transition T1B
State 1 to 3Unmanaged grazing, seed source for juniper establishment, lack of fire, climatic conditions favorable for tree regeneration. Unmanaged grazing can be described here as: Season-long grazing providing little rest and recovery for preferred grazed plants during critical growing periods, coupled with high utilization.
Restoration pathway R2A
State 2 to 1Woody species control, managed grazing
Conservation practices
Brush Management Prescribed Burning Prescribed Grazing Transition T2A
State 2 to 3Unmanaged grazing, seed source for juniper establishment, lack of fire. Unmanaged grazing can be described here as: Season-long grazing providing little rest and recovery for preferred grazed plants during critical growing periods, coupled with high utilization.
Transition T2B
State 2 to 4Invasion of non-native annuals, drought, unmanaged grazing. Unmanaged grazing can be described here as: Season-long grazing providing little rest and recovery for preferred grazed plants during critical growing periods, coupled with high utilization.
Restoration pathway R3A
State 3 to 2Tree canopy is reduced thru mechanical methods or burning; managed grazing, favorable climate
Conservation practices
Brush Management Prescribed Burning Prescribed Grazing Transition T3A
State 3 to 4Drought, fire, unmanaged grazing, invasion of non-native annuals. Unmanaged grazing can be described here as: Season-long grazing providing little rest and recovery for preferred grazed plants during critical growing periods, coupled with high utilization.
Restoration pathway R3B
State 3 to 5Woody species control, prescribed fire, range reseeding, managed grazing, favorable climatic conditions.
Conservation practices
Brush Management Prescribed Burning Range Planting Prescribed Grazing Restoration pathway R4A
State 4 to 1Woody species management, noxious/invasive weed treatment, range seeding, managed grazing, along with favorable climatic conditions.
Conservation practices
Brush Management Grazing Land Mechanical Treatment Range Planting Prescribed Grazing Herbaceous Weed Control Restoration pathway R4B
State 4 to 2Woody species management, noxious/invasive weed treatment, range seeding, managed grazing, along with favorable climatic conditions.
Conservation practices
Brush Management Grazing Land Mechanical Treatment Range Planting Prescribed Grazing Herbaceous Weed Control Transition T5A
State 5 to 1Favorable climate (moisture), managed grazing
Additional community tables
Table 8. Community 1.1 plant community composition
Group Common name Symbol Scientific name Annual production () Foliar cover (%) Grass/Grasslike1 Dominant grasses 320–580 blue grama BOGR2 Bouteloua gracilis 120–240 – black grama BOER4 Bouteloua eriopoda 120–200 – James' galleta PLJA Pleuraphis jamesii 20–80 – alkali sacaton SPAI Sporobolus airoides 20–80 – 2 Cool season grasses 40–155 Indian ricegrass ACHY Achnatherum hymenoides 20–80 – needle and thread HECOC8 Hesperostipa comata ssp. comata 20–80 – squirreltail ELELE Elymus elymoides ssp. elymoides 5–20 – 3 Other grasses 40–75 spike dropseed SPCO4 Sporobolus contractus 0–25 – sand dropseed SPCR Sporobolus cryptandrus 0–25 – mesa dropseed SPFL2 Sporobolus flexuosus 0–25 – mat muhly MURI Muhlenbergia richardsonis 0–15 – ring muhly MUTO2 Muhlenbergia torreyi 0–15 – Grass, perennial 2GP Grass, perennial 0–10 – sand milkweed ASAR Asclepias arenaria 0–8 – Rocky Mountain zinnia ZIGR Zinnia grandiflora 0–8 – Grass, annual 2GA Grass, annual 0–5 – Forb4 Forbs 20–90 Forb, annual 2FA Forb, annual 0–20 – Forb, perennial 2FP Forb, perennial 10–20 – Rocky Mountain zinnia ZIGR Zinnia grandiflora 0–10 – threadleaf ragwort SEFL3 Senecio flaccidus 0–10 – western aster SYAS3 Symphyotrichum ascendens 0–10 – globemallow SPHAE Sphaeralcea 0–5 – milkvetch ASTRA Astragalus 0–5 – rose heath CHER2 Chaetopappa ericoides 0–5 – Esteve's pincushion CHST Chaenactis stevioides 0–5 – cryptantha CRYPT Cryptantha 0–5 – shortstem lupine LUBR2 Lupinus brevicaulis 0–5 – plains blackfoot MELE2 Melampodium leucanthum 0–2 – woolly plantain PLPA2 Plantago patagonica 0–2 – little hogweed POOL Portulaca oleracea 0–2 – springparsley CYMOP2 Cymopterus 0–2 – tansymustard DESCU Descurainia 0–2 – touristplant DIWI2 Dimorphocarpa wislizeni 0–2 – flatspine stickseed LAOC3 Lappula occidentalis 0–2 – Wright's bird's beak COWR2 Cordylanthus wrightii 0–2 – annual Townsend daisy TOAN Townsendia annua 0–2 – yellow salsify TRDU Tragopogon dubius 0–2 – Shrub/Vine5 Dominant shrubs 40–130 fourwing saltbush ATCA2 Atriplex canescens 20–80 – jointfir EPHED Ephedra 10–35 – winterfat KRLA2 Krascheninnikovia lanata 10–35 – Bigelow sage ARBI3 Artemisia bigelovii 10–30 – 6 Other shrubs 15–50 rabbitbrush CHRYS9 Chrysothamnus 0–15 – rubber rabbitbrush ERNAB2 Ericameria nauseosa ssp. nauseosa var. bigelovii 0–15 – snakeweed GUTIE Gutierrezia 0–15 – plains pricklypear OPPO Opuntia polyacantha 0–7 – narrowleaf yucca YUAN2 Yucca angustissima 0–7 – Whipple cholla CYWH Cylindropuntia whipplei 0–7 – slenderleaf buckwheat ERLE10 Eriogonum leptophyllum 0–7 – sand sagebrush ARFI2 Artemisia filifolia 0–7 – prairie sagewort ARFR4 Artemisia frigida 0–7 – Tree7 Trees 0–30 juniper JUNIP Juniperus 0–20 – twoneedle pinyon PIED Pinus edulis 0–20 – Table 9. Community 1.2 plant community composition
Group Common name Symbol Scientific name Annual production () Foliar cover (%) Table 10. Community 2.1 plant community composition
Group Common name Symbol Scientific name Annual production () Foliar cover (%) Table 11. Community 3.1 plant community composition
Group Common name Symbol Scientific name Annual production () Foliar cover (%) Table 12. Community 4.1 plant community composition
Group Common name Symbol Scientific name Annual production () Foliar cover (%) Table 13. Community 5.1 plant community composition
Group Common name Symbol Scientific name Annual production () Foliar cover (%) Interpretations
Animal community
Site is favorable for grazing throughout most of the year except when snow cover restricts availability of forage. With continuous grazing use during winter and spring, the relatively scarce cool season mid grasses are replaced by rabbitbrush, snakeweed and lower value forbs and grasses. Planned grazing systems adapt well to use on this site.
The potential plant community produced by this site provides food for those species of wildlife that utilize grass as a major portion of their diet. When vegetative retrogression occurs, shrubby species increase and some wildlife species may benefit.
Recreational uses
This site occurs on gently sloping plains or alluvial fans with grasslands interspersed with shrubs.
Winters are cold and summers are quite warm. Spring and fall are the dry seasons and are typically cool and windy.
Recreational activities most likely to occur are hunting, cross-country riding, photography and wildlife observation.
Supporting information
Other references
Updates and revisions for this ESD were conducted as part of a 2007-2012 Interagency Technical Assistance Agreement between the Bureau of Indian Affairs–Navajo Region and the NRCS-Arizona.
Contributors
Steve Barker
Dean Schlichting
K. Gishi
Ken Gishi
Larry D. EllicottApproval
Kendra Moseley, 5/02/2024
Rangeland health reference sheet
Interpreting Indicators of Rangeland Health is a qualitative assessment protocol used to determine ecosystem condition based on benchmark characteristics described in the Reference Sheet. A suite of 17 (or more) indicators are typically considered in an assessment. The ecological site(s) representative of an assessment location must be known prior to applying the protocol and must be verified based on soils and climate. Current plant community cannot be used to identify the ecological site.
Author(s)/participant(s) Ken Gishi, Dean Schlichting, Dan Carroll and Max Taylor Contact for lead author State Rangeland Management Specialist, NRCS-Arizona State Office, Phoenix, AZ Date 07/28/2008 Approved by Approval date Composition (Indicators 10 and 12) based on Annual Production Indicators
-
Number and extent of rills:
None present on this site. Some minor rills on slopes >5% may form due to moderate permeability and moderate runoff characteristics of the soils. -
Presence of water flow patterns:
Some water flow patterns may occur on soils that have sandy clay loam or clay loam subsurface textures, if these textures are close to the surface. These soils have moderate permeability and moderate runoff. Water flow patterns on these soils are commonly less than 4 feet long, but may be longer on steeper slopes, generally occupying < 10% of the ground cover. -
Number and height of erosional pedestals or terracettes:
Pedestals may be common, but short in height (1/2”). Terracettes are uncommon. Both may be more developed and especially common during drought, due to high wind erosion hazard of the soils. The moderate permeability and moderate runoff conditions could lead to a few pedestals and terracettes being formed by water erosion. -
Bare ground from Ecological Site Description or other studies (rock, litter, lichen, moss, plant canopy are not bare ground):
Bare ground averages 35 – 45% in normal years. Some sites may have biological crusts ranging 0 – 5%. Drought may lead to an increase in bare ground. -
Number of gullies and erosion associated with gullies:
None -
Extent of wind scoured, blowouts and/or depositional areas:
None. High wind erosion hazard occurs on soils with a surface texture of sandy loam. -
Amount of litter movement (describe size and distance expected to travel):
Most herbaceous and fine woody litter will be transported by wind and in water flow pathways, while a small percentage stays in place. Coarse woody litter and duff will accumulate under shrub and tree canopies. -
Soil surface (top few mm) resistance to erosion (stability values are averages - most sites will show a range of values):
Soil aggregate stability ranges from 4 to 5 under canopy and 2 to 3 in the plant interspaces. A few soils have gravelly surfaces, but most soils do not have any rock fragments. When well vegetated, these soils have a moderate to high resistance to water erosion, but only a low resistance to wind erosion. -
Soil surface structure and SOM content (include type of structure and A-horizon color and thickness):
Surface structure is mostly granular (weak to moderate, fine to medium), but some soil surfaces are platy (weak to moderate, medium to thick). Surface thickness mostly range from 3 - 6 inches, but can range between 2 - 10 inches. Color is variable depending on parent material. -
Effect of community phase composition (relative proportion of different functional groups) and spatial distribution on infiltration and runoff:
This site is dominated by perennial grasses with 20 to 40% cover, then by evergreen shrubs 15 to 20% cover, 1 to 5% cover in forbs, and 1 to 2% cover in trees in some locations. Both canopy and basal cover values of grasses and some shrubs decrease during prolonged drought. Due to soil textures, slope and vegetative composition, this site is moderately effective at capturing and storing precipitation. -
Presence and thickness of compaction layer (usually none; describe soil profile features which may be mistaken for compaction on this site):
None. These soils are not easily compacted. Many of the soils have a weak granular structure. -
Functional/Structural Groups (list in order of descending dominance by above-ground annual-production or live foliar cover using symbols: >>, >, = to indicate much greater than, greater than, and equal to):
Dominant:
warm season colonizing grasses(20-30%)> shrubsSub-dominant:
shrubs (15-20%)> cool season bunchgrasses (5-15%)> warm season bunch grasses (5-10%)Other:
forbs (1-5%)> trees (< 2%)Additional:
-
Amount of plant mortality and decadence (include which functional groups are expected to show mortality or decadence):
In a normal year up to 10% of grasses and shrubs die off. During and after drought years there can be from 10 to 20% die off of shrubs and grasses. Severe winter droughts affect shrubs, trees and cool season grasses the most. Severe summer droughts affect the warm season grasses the most. -
Average percent litter cover (%) and depth ( in):
Average percent litter cover 25-40% and depth 1/8 inches. Within plant interspaces litter ranges from 10 to 20 % cover with depths up to 1/8 inch, while under shrub and tree canopies it ranges from 50 to 75% cover with depths from 1/8 to 1/2 inches thick. -
Expected annual annual-production (this is TOTAL above-ground annual-production, not just forage annual-production):
Average annual production on this site is expected to be 700 to 800 lbs/ac. in a year of average annual precipitation. -
Potential invasive (including noxious) species (native and non-native). List species which BOTH characterize degraded states and have the potential to become a dominant or co-dominant species on the ecological site if their future establishment and growth is not actively controlled by management interventions. Species that become dominant for only one to several years (e.g., short-term response to drought or wildfire) are not invasive plants. Note that unlike other indicators, we are describing what is NOT expected in the reference state for the ecological site:
Broom snakeweed (GUSA2), Rabbitbrush (Chrysothamnus spp.), false buffalograss (MOSQ)and sixweeks fescue (VUOC) are native to the site, but they have the potential to increase and dominate the site after unmanaged grazing. Utah and oneseed juniper (JUOS & JUMO) and Colorado Pinyon (PIED) are native to the site, but have the potential to increase and dominate the site after disturbance and/or fire exclusion. Cheatgrass (BRTE) is an exotic grass that has the potential to invade and dominate the site, with or without disturbance. Lambsquarters (CHAL7) and Russian thistle (SATR12) are annual exotic forbs that have the potential to invade and dominate the site after disturbance, especially if the site is near farm fields or disturbed lands. -
Perennial plant reproductive capability:
All plants native to this site are adapted to the climate and are capable of producing seeds, stolons and rhizomes except during the most severe droughts.
Print Options
Sections
Font
AAAAOther
PrintThe Ecosystem Dynamics Interpretive Tool is an information system framework developed by the USDA-ARS Jornada Experimental Range, USDA Natural Resources Conservation Service, and New Mexico State University.
Accessibility statement