Natural Resources
Conservation Service
Ecological site R034AA013UT
Semi-Wet Fresh Meadow
Last updated: 2/19/2025
Accessed: 06/27/2026
-
Search


Major Land Resource Area or ecological site by name and/or ID.
PreviousSectionsNextGeneral information
Provisional. A provisional ecological site description has undergone quality control and quality assurance review. It contains a working state and transition model and enough information to identify the ecological site.
MLRA notes
Major Land Resource Area (MLRA): 034A–Cool Central Desertic Basins and Plateaus
Major Land Resource Area (MLRA) 34A, Cool Central Desertic Basins and Plateaus, consists of approximately 21 million acres in Wyoming, Colorado and Utah, it consists of 11 Land Resource Units (LRU). These units are divisions of the MLRA based on geology, landscape, common soils, water resources and plant community potentials. The elevation spans from approximately 5600 feet (1700 m) along the Green River in UT and CO to approximately 9500 feet (2900 m) near Jeffrey City, WY. Annual precipitation ranges from 7 to 16 inches (177 to 406 mm), with the driest areas in the Green River and Great Divide Basins and the wettest areas in northern Carbon County, southeast Fremont County and Albany County. There is a seasonal weather pattern that trends west to east, with more winter precipitation in the west and more spring and summer in the east, illustrated by diminishing amounts of big sagebrush in the eastern part of the MLRA.
LRU notes
The Bear River Valley LRU is located on the far western side of MLRA 34A between the Bear River Divide and the Monte Cristo Range, from Woodruff, Utah at the southern end to Cokeville, Wyoming at the northern end. The total area of the LRU is approximately 340,000 acres. It shares a boundary with MLRA 47, 43B and 46 (proposed).
This LRU differs from the others in its geology, which is comprised mostly of alluvium and colluvium from the Stump Formation. Its weather patterns are such that the soil moisture is xeric, there is a slight peak in winter precipitation in this LRU, with typical yearly precipitation between 9 to 15 inches (230 to 380 mm). The soil temperature regime of this LRU is frigid with mean annual soil temperatures ranging from 44 to 48 degrees Fahrenheit (6.7 to 8.8°C). The elevation range is from 5700 to 7000 feet (1730 to 2130 m). The soils in the Bear River Valley are dominated by young aged very deep soils developed from sandstone and shale parent material re-worked with recent alluvium. Soils are dominated by Alfisols with young argillic horizons and by Fluvents in more recent alluvium.
The Bear River runs through this LRU, allowing for ample amounts of irrigation water used in the lowland areas to produce hay. Smaller tributaries originating from the neighboring mountains.Ecological site concept
The Semi-wet Fresh Meadow ecological site is primarily fed by groundwater from springs. The ecological site has very narrow valley bottoms and a small contributing watershed area. The upland areas adjacent to this site are typically big sagebrush (Artemisia tridentata). The streams in this ecological site serve only to convey water away from the spring area. The stream is perennial when near the source (springs), and may become intermittent as move further downstream of the spring. Streams that are perennial where significant springs supply the system, may gradually become intermittent when spring influence ceases. This ecological site in a typical precipitation year does not experience high flows in the spring in association with snowmelt because of the small watershed. The valley and, more specifically, the wet area (green-line) is typically very narrow and confined. Slope is generally between one and two percent. There is one plant community component in the reference condition. The valley is typically narrow and confined.
Associated sites
R034AA011UT Riparian Complex Perennial Gravelly VIII/E4 (Northwest Territory Sedge)
R034AA239UT Semi-desert Silt (Basin big sagebrush/ Bluebunch wheatgrass)
Similar sites
R034AA011UT Riparian Complex Perennial Gravelly VIII/E4 (Northwest Territory Sedge)
Table 1. Dominant plant species
Tree Not specified
Shrub Not specified
Herbaceous (1) Carex nebrascensis
(2) Juncus arcticus ssp. littoralisPhysiographic features
This site is in the Bear River Basin in the Middle Rocky Mountain Province of the Rocky Mountain System. It typically occurs between 6500 and 6700 feet with valley slopes less than 5 percent. The water table can be found at the surface to over 60 inches below the surface depending on the distance from the stream channel and fluvial surface.
Table 2. Representative physiographic features
Landforms (1) Drainageway
Flooding duration Brief (2 to 7 days) to long (7 to 30 days) Flooding frequency Frequent to occasional Ponding frequency None Elevation 6400 – 6700 ft Slope 1 – 5 % Water table depth 20 – 40 in Aspect Aspect is not a significant factor Climatic features
The average annual precipitation is 10 to 15 inches. Peak precipitation occurs as snow from October through April. This site has cold winters and short summers. Occasional convective thunderstorms produce small amounts of rain from June through September. The average annual temperature is 25 to 55 degrees Fahrenheit. The freeze-free period ranges from 95 to 115 days.
Table 3 Representative climatic features
Frost-free period (average) 80 days Freeze-free period (average) 120 days Precipitation total (average) 10 in BarLineFigure 1. Monthly precipitation range
BarLineFigure 2. Monthly average minimum and maximum temperature
">Influencing water features
Slope wetlands are typically found where there is a discharge of groundwater to the surface. Main water sources are groundwater return flow and interflow from surrounding uplands, and precipitation. Water dynamics are dominated by down-slope unidirectional water flow. Slope wetlands lose water primarily by saturation subsurface and surface flows and by evaporation. These wetlands may develop channels, but the channels only convey water away from the wetland. This site may degrade and have a more defined channel.
Soil features
This site occurs in narrow drainageways. The soils on this site are loamy to clay loam and are influenced by a high water table. Soils on this site are poorly to moderately drained depending on distance from water source and distance from bottom of drainageway. The water table fluctuates between 20 and 40 inches. Soil temperature and moisture regime is frigid and xeric, trending ustic.
Table 4. Representative soil features
Parent material (1) Alluvium
Surface texture (1) Loam
(2) Clay loam
Drainage class Poorly drained to moderately well drained Surface fragment cover <=3" Not specified Surface fragment cover >3" Not specified Subsurface fragment volume <=3"
(Depth not specified)Not specified Subsurface fragment volume >3"
(Depth not specified)Not specified Ecological dynamics
This site is characterized by narrow drainageways that support species tolerant of high water tables. The water source in this site is predominantly ground water. This site may have a small channel in the bottom of the narrow valley, but this channel only serves to move water away from the site and is not typically influenced by fluvial processes. This site is typically found in low order watershed reaches and is typically upstream sites from lotic riparian sites. The plant community components in this site are influenced by depth to groundwater and soils. There is only one plant community components within this site but the species change proportion as depth to ground water increases as the site transitions out to the uplands. Obligate wetland plants are found in the bottom of the drainageway with the highest water table, such as Nebraska sedge or other obligate wetland sedges. Baltic rush is found throughout the site, but typically in higher proportion moving away from the wettest part. Willows and other mesic shrubs may occur on this site in area with unique aeration, but they are not typical of this site.
The hydrology of the site can change with spring development or grazing. A small narrow channel may be present in this site. Under continuous season long grazing over many years, this small channel can widen as the sedges and rushes are eaten or trampled. Some downcutting may occur and the water table deepens and the site becomes narrower than in the reference state. The lowering of the water table also effect the plant species, increasing species more tolerant of dry conditions. Non-native species can be present in this site, particularly Kentucky bluegrass. A second plant community will develop when the water table has dropped on the previously wetter surface.State and transition model
Custom diagramStandard diagram
Figure 3. STM for R034AA013UT
More interactive model formats are also available. View Interactive Models
More interactive model formats are also available. View Interactive Models
Click on state and transition labels to scroll to the respective textEcosystem states
T1A - Non-native species introduced into the system T2A - Channel incision occurs and water table lowered. State 1 submodel, plant communities
State 2 submodel, plant communities
State 3 submodel, plant communities
State 1
ReferenceObligate wetland species dominate the Reference State. The water table is typically within 20 to 40 inches of the ground surface allowing wet species to dominate. This site may or may not have a small channel in the bottom of the drainageway. The channel, when present, serves to move water down valley and typically does not experience high flows during peak runoff.
Community 1.1
Obligate wetland species
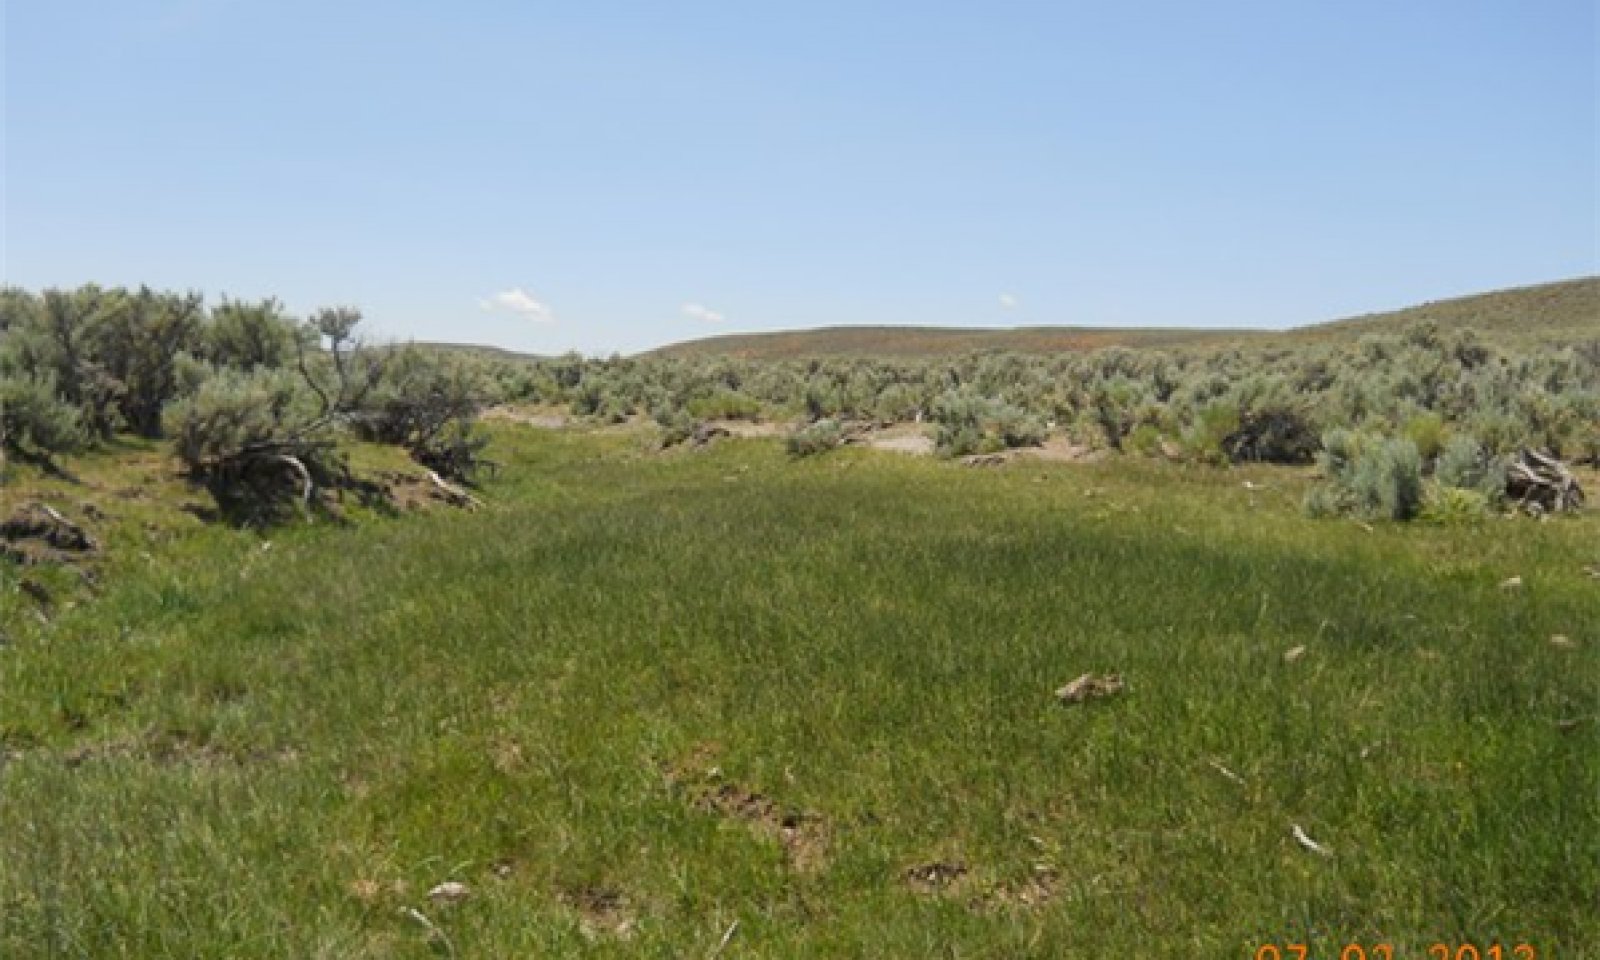
Figure 4. Semi-wet Fresh meadow with no channel

Figure 5. Semi-wet Fresh Meadow

Figure 6. Semi-wet fresh meadow with small channel
The water table is high throughout the growing season in the Obligate wetland species Community Phase. Wetland obligate species dominate, with the dominant species being Nebraska sedge and Baltic rush.
Figure 7. Annual production by plant type (representative values) or group (midpoint values)
Table 5. Annual production by plant type
Plant type Low
(lb/acre)Representative value
(lb/acre)High
(lb/acre)Grass/Grasslike 800 1500 2000 Forb 0 50 150 Total 800 1550 2150 Table 6. Soil surface cover
Tree basal cover 0% Shrub/vine/liana basal cover 0% Grass/grasslike basal cover 0% Forb basal cover 0% Non-vascular plants 0-30% Biological crusts 0% Litter 0-10% Surface fragments >0.25" and <=3" 0% Surface fragments >3" 0% Bedrock 0% Water 0-10% Bare ground 0-70% Table 7. Canopy structure (% cover)
Height Above Ground (ft) Tree Shrub/Vine Grass/
GrasslikeForb <0.5 – – 0-5% 0-5% >0.5 <= 1 – – 25-40% 0-5% >1 <= 2 – – 25-40% – >2 <= 4.5 – – – – >4.5 <= 13 – – – – >13 <= 40 – – – – >40 <= 80 – – – – >80 <= 120 – – – – >120 – – – – State 2
Current PotentialThe Current Potential State is similar to the Reference State with the addition of non-native species, such as Kentucky bluegrass.
Community 2.1
Obligate wetland species/non-native speciesCommunity Phase 2.1 is similar to Community Phase 1.1 with the addition of non-native species, such as Kentucky bluegrass. The introduction of Kentucky bluegrass and other similar shallow rooted grasses changes the resilience of the system. Kentucky bluegrass will not hold the soil on the site as well as deep rooted sedges. Community Phase is at risk for the incisement of the drainageway, which will channelize the water through the bottom of the drainageway and dry out the adjacent wetlands.
Figure 8. Annual production by plant type (representative values) or group (midpoint values)
Table 8. Annual production by plant type
Plant type Low
(lb/acre)Representative value
(lb/acre)High
(lb/acre)Grass/Grasslike 800 1500 2000 Forb 0 50 150 Total 800 1550 2150 Table 9. Soil surface cover
Tree basal cover 0% Shrub/vine/liana basal cover 0% Grass/grasslike basal cover 0% Forb basal cover 0% Non-vascular plants 0% Biological crusts 0-30% Litter 10-30% Surface fragments >0.25" and <=3" 0% Surface fragments >3" 0% Bedrock 0% Water 0-10% Bare ground 50-90% Table 10. Canopy structure (% cover)
Height Above Ground (ft) Tree Shrub/Vine Grass/
GrasslikeForb <0.5 – – 0-5% 0-5% >0.5 <= 1 – – 25-40% 0-5% >1 <= 2 – – 25-40% – >2 <= 4.5 – – – – >4.5 <= 13 – – – – >13 <= 40 – – – – >40 <= 80 – – – – >80 <= 120 – – – – >120 – – – – State 3
DegradedThe Degraded State represents where there is a mix of native and non-native species that dominate the site. It is also typical for the site to have a channel in the bottom of the drainageway that may or may not have been present in reference condition. The channel is typically wider than in reference condition and at a lower elevation. The incision of the channel through the drainageway effectively dries the surrounding meadows. The Degraded State is typically caused by the shift in native vegetation to non-native vegetation and through improper grazing management.
Community 3.1
Non-native species/facultative wet species
Figure 9. Degraded meadow

Figure 10. Hummocks within the small drainageway
Mesic forbs and grasses typically dominate Community Phase 3.1. There is some Nebraska sedge remaining close to the channel edge. This phase has been observed in areas where the grazing pressure has been released and the vegetation, such as sedges, colonizes across the channel, increasing production and stabilizing the site.
Transition T1A
State 1 to 2Non-native species introduced into the system
Transition T2A
State 2 to 3Channel incision occurs and water table lowered.
Additional community tables
Table 11. Community 1.1 plant community composition
Group Common name Symbol Scientific name Annual production () Foliar cover (%) Grass/Grasslike1 Rhizomatous graminoids 500–2000 Nebraska sedge CANE2 Carex nebrascensis 500–2000 25–80 Grass-like, perennial 2GLP Grass-like, perennial 5–100 1–10 Grass, perennial 2GP Grass, perennial 0–50 0–5 spikerush ELEOC Eleocharis 0–50 0–5 scratchgrass MUAS Muhlenbergia asperifolia 0–5 0–5 2 Non-rhizomatous perennial graminoids 0–150 Grass, perennial 2GP Grass, perennial 0–100 0–10 Grass-like (not a true grass) 2GL Grass-like (not a true grass) 0–50 0–5 3 Annual graminoids 0–100 Grass, annual 2GA Grass, annual 0–50 0–5 Grass-like, annual 2GLA Grass-like, annual 0–50 0–5 Forb4 Perennial forb 0–100 Forb, perennial 2FP Forb, perennial 0–50 0–10 goldenrod SOLID Solidago 0–50 0–5 common yarrow ACMI2 Achillea millefolium 0–5 0–2 5 Annual forb 0–50 Forb, annual 2FA Forb, annual 0–50 0–10 Table 12. Community 2.1 plant community composition
Group Common name Symbol Scientific name Annual production () Foliar cover (%) Grass/Grasslike1 Rhizomatous graminoids 500–2000 Nebraska sedge CANE2 Carex nebrascensis 500–1800 25–75 creeping bentgrass AGST2 Agrostis stolonifera 1–150 1–15 Grass-like, perennial 2GLP Grass-like, perennial 5–100 1–10 Kentucky bluegrass POPR Poa pratensis 5–60 1–10 spikerush ELEOC Eleocharis 0–50 0–5 Grass, perennial 2GP Grass, perennial 0–50 0–5 scratchgrass MUAS Muhlenbergia asperifolia 0–5 0–5 2 Non-rhizomatous graminoids 0–150 Grass, perennial 2GP Grass, perennial 0–100 0–10 Grass-like (not a true grass) 2GL Grass-like (not a true grass) 0–50 0–5 meadow foxtail ALPR3 Alopecurus pratensis 0–25 0–5 3 Annual graminoids 0–100 Grass, annual 2GA Grass, annual 0–50 0–5 Grass-like, annual 2GLA Grass-like, annual 0–50 0–5 Forb4 Perennial forb 0–100 bull thistle CIVU Cirsium vulgare 0–100 0–5 Forb, perennial 2FP Forb, perennial 0–50 0–10 goldenrod SOLID Solidago 0–50 0–5 common dandelion TAOF Taraxacum officinale 0–10 0–5 common yarrow ACMI2 Achillea millefolium 0–5 0–2 5 Annual forb 0–50 Forb, annual 2FA Forb, annual 0–50 0–10 Table 13. Community 3.1 plant community composition
Group Common name Symbol Scientific name Annual production () Foliar cover (%) Interpretations
Hydrological functions
This site is found high in the watershed in 34A, where there is little influence from heavy snow pack and subsequent spring runoff. This site also has spring influence providing ground water at the site through the growing season.
Supporting information
Inventory data references
Data gathered by qualified range professionals within NRCS and cooperating partners.
Other references
Kleinfelder, D., S. Swanson, G. Norris, and W. Clary. 1992. Unconfined compressive strength of some streambank soils with herbaceous roots. Soil Sci. Am. J. 56: 1920-1925.
Manning, M.E., S.R. Swanson, T, Svejcar, and J. Trent. 1989. Rooting characteristics of four intermountain meadow community types. Journal of Range Management 42(4): 309-312.
Rosgen, D.L., 1996. Applied River Morphology. Wildland Hydrology Books, Pagosa Springs, Colorado, and Ft. Collins, CO.
Ryan, G. 1975. Aquatic habitat inventory of streams on National Resource Land. Western Interstate Commission for Higher Education, Boulder, Co. 65p.
Smith, D.G. 1976. Effect of vegetation on lateral migration of anastomosed channels of a glacier meltwater river. Geological Society of American Bulletin 87: 857-860.
Steed, J.E. and L.E. DeWald. 2003. Transplanting sedges (Carex spp.) in southwestern riparian meadows. Restoration Ecology 11(2): 247-256.
Thorne, C.R. 1990. Effects of vegetation on riverbank erosion and stability. In: Thornes, J.B. (ed.). Vegetation and Erosion. John Wiley and Sons Ltd. pp 125-144.
USDA, NRCS. 2008. (Electronic) Field Office Technical Guide. Available online at: http://efotg.nrcs.usda.gov/efotg_locator.aspx.
USDA, Natural Resource Conservation Service. 2004. National Forestry Handbook. Available online at: http://soils.usda.gov/technical/nfhandbook/.
USDA, NRCS. 2007. The PLANTS Database. National Plant Data Center, Baton Rouge, LA 70874-4490 USA. Available online at: http://plants.usda.gov.
USDA, NRCS. 2003. National Range and Pasture Handbook. Available online at: http://www.glti.nrcs.usda.gov/technical/publications/nrph.html.
USDA, NRCS Soil Survey Manuals for appropriate counties within MLRA 34A.
USDA, NRCS, 2007. Southerland, W. B., Technical Supplement 3E, National Engineering Handbook 654, Rosgen Stream Classification Technique – Supplemental Materials.
USDA, USFS, 2010. Fire Effects Information System Database. Available online at: http://www.fs.fed.us/database/feis/.
USDI, USGS, 2010. National Water Information System. Available online at: http://waterdata.usgs.gov/nwis/.Contributors
Sarah Quistberg
Approval
Kirt Walstad, 2/19/2025
Rangeland health reference sheet
Interpreting Indicators of Rangeland Health is a qualitative assessment protocol used to determine ecosystem condition based on benchmark characteristics described in the Reference Sheet. A suite of 17 (or more) indicators are typically considered in an assessment. The ecological site(s) representative of an assessment location must be known prior to applying the protocol and must be verified based on soils and climate. Current plant community cannot be used to identify the ecological site.
Author(s)/participant(s) Contact for lead author Date 02/18/2025 Approved by Approval date Composition (Indicators 10 and 12) based on Annual Production Indicators
-
Number and extent of rills:
-
Presence of water flow patterns:
-
Number and height of erosional pedestals or terracettes:
-
Bare ground from Ecological Site Description or other studies (rock, litter, lichen, moss, plant canopy are not bare ground):
-
Number of gullies and erosion associated with gullies:
-
Extent of wind scoured, blowouts and/or depositional areas:
-
Amount of litter movement (describe size and distance expected to travel):
-
Soil surface (top few mm) resistance to erosion (stability values are averages - most sites will show a range of values):
-
Soil surface structure and SOM content (include type of structure and A-horizon color and thickness):
-
Effect of community phase composition (relative proportion of different functional groups) and spatial distribution on infiltration and runoff:
-
Presence and thickness of compaction layer (usually none; describe soil profile features which may be mistaken for compaction on this site):
-
Functional/Structural Groups (list in order of descending dominance by above-ground annual-production or live foliar cover using symbols: >>, >, = to indicate much greater than, greater than, and equal to):
Dominant:
Sub-dominant:
Other:
Additional:
-
Amount of plant mortality and decadence (include which functional groups are expected to show mortality or decadence):
-
Average percent litter cover (%) and depth ( in):
-
Expected annual annual-production (this is TOTAL above-ground annual-production, not just forage annual-production):
-
Potential invasive (including noxious) species (native and non-native). List species which BOTH characterize degraded states and have the potential to become a dominant or co-dominant species on the ecological site if their future establishment and growth is not actively controlled by management interventions. Species that become dominant for only one to several years (e.g., short-term response to drought or wildfire) are not invasive plants. Note that unlike other indicators, we are describing what is NOT expected in the reference state for the ecological site:
-
Perennial plant reproductive capability:
Print Options
Sections
Font
AAAAOther
PrintThe Ecosystem Dynamics Interpretive Tool is an information system framework developed by the USDA-ARS Jornada Experimental Range, USDA Natural Resources Conservation Service, and New Mexico State University.
Accessibility statement