
Natural Resources
Conservation Service
Ecological site DX034A02X154
Shale
Pinedale Plateau
(Sh PP)
Last updated: 2/19/2025
Accessed: 10/16/2026
-
Search


Major Land Resource Area or ecological site by name and/or ID.
PreviousSectionsNextGeneral information
Provisional. A provisional ecological site description has undergone quality control and quality assurance review. It contains a working state and transition model and enough information to identify the ecological site.
MLRA notes
Major Land Resource Area (MLRA): 034A–Cool Central Desertic Basins and Plateaus
Major Land Resource Area (MLRA) 34A, Cool Central Desertic Basins and Plateaus, consists of approximately 21 million acres in Wyoming, Colorado and Utah, it consists of 10 Land Resource Units (LRU). These units are divisions of the MLRA based on geology, landscape, common soils, water resources and plant community potentials. The elevation ranges from approximately 5600 feet (1700 m) along the Green River in UT and CO to approximately 9500 feet (2900 m) near Jeffrey City, WY. Annual precipitation ranges from 7 to 16 inches (177 to 406 mm), with the driest areas in the Green River and Great Divide Basins and the wettest areas in northern Carbon County, Southeast Fremont County and Albany County. There is a seasonal weather pattern that trends west to east, with more winter precipitation in the west and more spring/summer in the east, illustrated by diminishing amounts of Big Sagebrush in the eastern part of the MLRA.
LRU notes
The Pinedale Plateau LRU is in the upper Green River Drainage from Pinedale, Wyoming at the north working southward to Farson, Wyoming and easterly to South Pass, Wyoming. It is situated between the Wyoming Range and Wind River Range largely in Sublette County with some areas in Lincoln County, northern Sweetwater County, and a small portion of Fremont County. The total area of this LRU is approximately 1,210,000 acres. It shares a boundary with MLRA 46-Northern Rocky Mountain Foothills (proposed for the foothills of western Wyoming).
This LRU is dominated by the New Fork Tongue of the Wasatch formation, a large artesian aquifer that is estimated to hold large amounts of water with relatively quick recharge (Martin 1996). It is also home to the Lance Formation, a cretaceous strata that is part of the Mesaverde Group, which holds large amounts of hydrocarbons, giving way to one of the largest on shore natural gas fields (Jonah Field) (Bowker et al 2000). The soils in the Pinedale Plateau are dominated by older Alfisols with thick argillic and calcic horizons and younger deep alluvial soils along drainage ways and in river bottoms. Salts are not a major influence in the Pinedale Plateau compared to the adjacent Green River Basin LRU but do occur, including sodium, calcium carbonate, and other soluble salts. Soils are tied closely to their parent geology but are more developed and older so typically do not have bedrock contact within six feet.
This LRU has an aridic ustic soil moisture regime and frigid (bordering on cryic) soil temperature regime. The precipitation pattern is bimodal with a slight spikes in the spring and fall. Winter temperatures are cold allowing snow to accumulate and stay until spring. This lends perfectly to cool season grasses and forbs to flourish, also allowing big sagebrush to establish and dominate the landscape. The mean annual soil temperatures are between 36 to 40 degrees Fahrenheit (2.2 to 4.4 degrees Celsius) and average precipitation is between 9 and 12 inches (230 to 305 mm) annually. Elevations of this LRU range between 6500 and 7500 feet (1980 to 2280 m).Classification relationships
Relationship to Other Established Classification Systems
National Vegetation Classification System (NVC):
3 Desert & Semi-Desert Class
3.B Cool Semi-Desert Scrub & Grassland Subclass
3.B.1 Cool Semi-Desert Scrub & Grassland Formation
3.B.1.Ne Western North American Cool Semi-Desert Scrub & Grassland Division
M093 Great Basin Saltbush Scrub Macrogroup
G301 Intermountain Dwarf Saltbush - Sagebrush Scrub Group
A1110 Gardner's Saltbush Low Scrub Alliance
CEGL001444 Atriplex gardneri / Achnatherum hymenoides Dwarf-shrubland
Ecoregions (EPA):
Level I: 10 North American Deserts
Level II: 10.1 Cold Deserts
Level III: 10.1.4 Wyoming BasinEcological site concept
This site not does receive any additional water.
Soils:
o are saline or saline-sodic
o are very shallow (less than 10 inches deep) to shale bedrock
o are not violently effervescent in the surface mineral layer (within top 10 inches; 25 cm)
o have surface textures that usually range from clay loam to clay in surface mineral layer (4 inches; 10 cm)
o have slopes less than 15 percent
o have clay content in the subsurface greater than 35% and a natric horizon is present.
Climate:
aridic ustic moisture regime (ustic bordering on aridic)
frigid (bordering on cryic) temperature regimeAssociated sites
DX034A02X122 Loamy Pinedale Plateau (Ly PP)
Soils are deeper (moderately deep to deep) with lower salt content (EC and SAR) and soil surface textures have less clay. Loamy sites have higher plant production potential.
DX034A02X104 Clayey Pinedale Plateau (Cy PP)
Moderately deep to deep soil with lower salt content (EC and SAR) with different species composition and higher plant production potential.
DX034A02X144 Saline Upland Pinedale Plateau (SU PP)
Moderately deep to deep soil with similar salt content (EC and SAR) and higher plant production potential.
Similar sites
DX034A02X104 Clayey Pinedale Plateau (Cy PP)
Moderately deep to deep soil with lower salt content (EC and SAR) with different species composition and higher plant production potential.
R034AY254WY Shale Foothills and Basins West (Sh)
Previous version of this site correlated in this LRU, applied to a larger geographic area.
DX034A02X144 Saline Upland Pinedale Plateau (SU PP)
Moderately deep to deep soil with similar salt content (EC and SAR) and higher plant production potential.
R034AY154WY Shale Green River and Great Divide Basins (Sh)
Similar site with drier climate and lower plant production potential found in the adjacent Green River Basin LRU.
Table 1. Dominant plant species
Tree Not specified
Shrub (1) Atriplex gardneri
Herbaceous (1) Achnatherum hymenoides
(2) Elymus elymoidesLegacy ID
R034AC154WY
Physiographic features
This site occurs in intermontane basin landscapes on hillslope, ridge, and landforms (see following definitions). The slopes range from 30 to 55 percent, but could occur on sites less than 30 percent. This site occurs on all aspects.
Landscape Definitions:
intermontane basin–-A generic term for wide structural depressions between mountain ranges that are partly filled with alluvium and called "valleys" in the vernacular.
Landform Definitions:
hillslope -- A generic term for the steeper part of a hill between its summit and the drainage line, valley flat, or depression floor at the base of the hill.
ridge -- A long, narrow elevation of the land surface, usually sharp crested with steep sides and forming an extended upland between valleys. The term is used in areas of both hill and mountain relief.
knoll -- A small, low, rounded hill rising above adjacent landforms.Table 2. Representative physiographic features
Landforms (1) Intermontane basin > Hillslope
(2) Ridge
(3) Knoll
Flooding frequency None Ponding frequency None Elevation 6500 – 7500 ft Slope 30 – 55 % Aspect Aspect is not a significant factor Climatic features
Annual precipitation ranges from 9 to 12 inches per year. Wide fluctuations may occur in yearly precipitation and result in more below average years than those with above average precipitation. Temperatures show a wide range between summer and winter and between daily maximums and minimums. This is predominantly due to the high elevation and dry air, which permits rapid incoming and outgoing radiation. Cold air outbreaks in winter move rapidly from northwest to southeast and account for extreme minimum temperatures. Much of the precipitation accumulation (45 percent) comes in the winter in the form of snow (October to April). The wettest month is May (1.69 inches). The dominant plants (sagebrush and cool season grasses) are well adapted to these conditions. Daytime winds are generally stronger than nighttime and occasional strong storms may bring brief periods of high winds with gusts to more than 50 miles per hour. The growing season is short (less than 60 day) and cool. Critical growth period: primary growth typically occurs between May and June.
Growth of native cool-season plants begins in April and continues to approximately early August. Some green-up of cool-season plants usually occurs in September with adequate fall moisture.
All data is based on the 30-year average from 1981-2010.Table 3 Representative climatic features
Frost-free period (characteristic range) 30-70 days Freeze-free period (characteristic range) 50-80 days Precipitation total (characteristic range) 10-10 in Frost-free period (actual range) 20-70 days Freeze-free period (actual range) 50-90 days Precipitation total (actual range) 10-10 in Frost-free period (average) 40 days Freeze-free period (average) 60 days Precipitation total (average) 10 in Characteristic rangeActual rangeBarLineFigure 1. Monthly precipitation range
Characteristic rangeActual rangeBarLineFigure 2. Monthly minimum temperature range
Characteristic rangeActual rangeBarLineFigure 3. Monthly maximum temperature range
BarLineFigure 4. Monthly average minimum and maximum temperature
Figure 5. Annual precipitation pattern
Figure 6 Annual average temperature pattern
Climate stations used
-
(1) CORA [USC00482054], Cora, WY
-
(2) PINEDALE [USC00487260], Pinedale, WY
-
(3) BOULDER REARING STN [USC00480951], Boulder, WY
">Influencing water features
There are no influencing water features.
Wetland description
N/A
Soil features
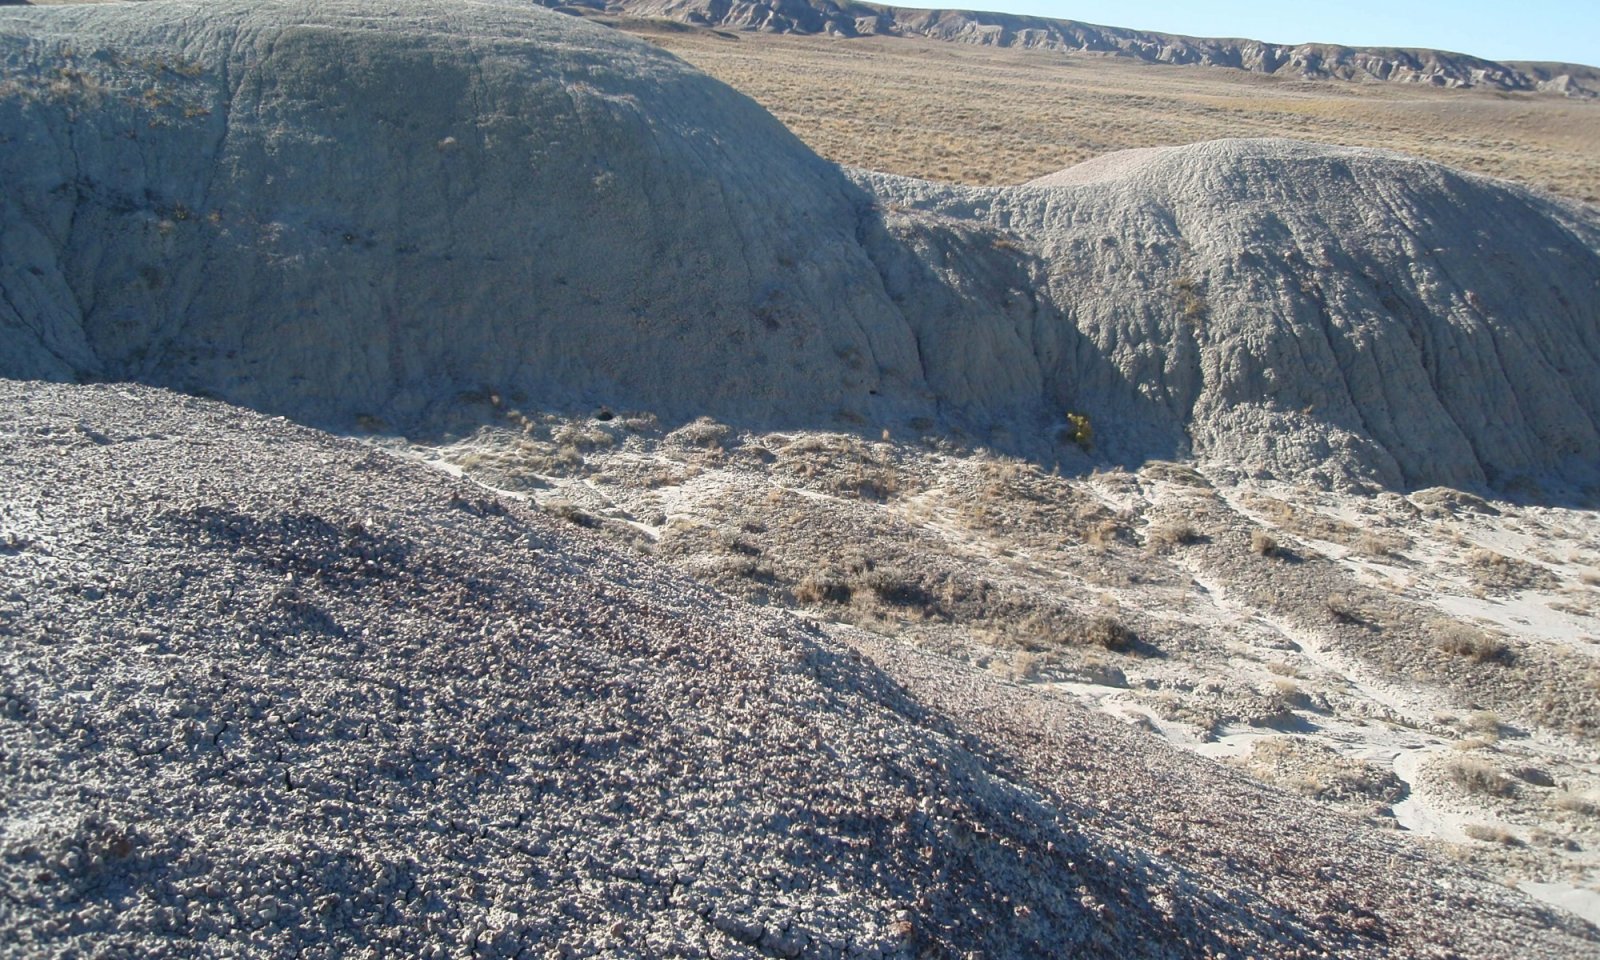
The soils of this site are very shallow to shallow (less than 20 inches deep) to paralithic shale bedrock with occasional outcropping shale bedrock at the soil surface. Soils are well drained with high amounts of clay and salt concentration in the subsoil, resulting in halophytic vegetation. Some soil cracking (not severe) may occur during the dry summer months, especially where the plant cover has been reduced. Water-holding capacity is low due to depth of soil, and intake is restricted by slow permeability which reduces the effectiveness of precipitation.
The soil moisture regime is aridic ustic (ustic bordering on aridic) and the soil temperature regime is frigid bordering on cryic.
Major Soil Series correlated to this site include: Volborg
Representative soil taxonomy:
Clayey, smectitic, acid, frigid, shallow Aridic UstorthentsTable 4. Representative soil features
Parent material (1) Residuum – shale
Surface texture (1) Clay loam
(2) Silty clay loam
Family particle size (1) Clayey
Drainage class Well drained Permeability class Slow Depth to restrictive layer 4 – 20 in Soil depth 4 – 20 in Surface fragment cover <=3" 0 – 5 % Surface fragment cover >3" 0 – 2 % Available water capacity
(0-20in)1 – 3.5 in Calcium carbonate equivalent
(0-10in)1 – 5 % Electrical conductivity
(0-10in)0 – 4 mmhos/cm Sodium adsorption ratio
(0-10in)5 – 12 Soil reaction (1:1 water)
(0-10in)8 – 8.6 Subsurface fragment volume <=3"
(0-10in)0 – 10 % Subsurface fragment volume >3"
(0-10in)0 – 5 % Ecological dynamics
A State-and-Transition Model (STM) diagram is depicted in this section. Narrative descriptions of each state, transition, plant community phase, and pathway are found after the model in this document. This diagram is based on available experimental research, field observations, professional consensus, logical extrapolations, and interpretations. While based on the best available information, the STM will change over time as knowledge of ecological processes increases. Although there is considerable qualitative experience supporting the pathways and transitions within the State-and-Transition Model, no quantitative information exists that specifically identifies threshold parameters between reference states and degraded states in this ecological site. For information on STMs, see the following citations: Bestelmeyer et.al. 2003, Bestelmeyer et.al. 2004, Bestelmeyer and Brown 2005, Briske et.al. 2008, and Stringham et,al. 2003.
Plant community composition within the same ecological site has a natural range of variability across the LRU due to the naturally occurring variability in weather, soils, and aspect. The biological processes on this site are complex; therefore, representative values are presented in a land management context. The species lists are representative and are not botanical descriptions of all species occurring, or potentially occurring, on this site. They are not intended to cover every situation or the full range of conditions, species, and responses for the site.
Both percent species composition by weight and percent cover are used in this ESD. Most observers find it easier to visualize or estimate percent cover for woody species (trees and shrubs). Foliar cover is used to define plant community phases and states in the State-and-Transition Model. Cover drives the transitions between communities and states because of the influence of shade and interception of rainfall. Species composition by dry weight remains an important descriptor of the herbaceous community and of site productivity as a whole and includes both herbaceous and woody species. Calculating Similarity Index requires data on species composition by dry weight.
Not all managers will choose the Reference Plant Community as the management goal. Other plant communities may be desired to meet land management objectives. This is valid as long as the rangeland health attributes assessment departures are none to slight or slight to moderate from the Reference State as described in the Range Health Reference sheet.
A resource concern risk assessment and dominant resource concerns are provided for each Land Use, State, and Plant Community Phase based on NRCS resource concern and planning criteria used to determine resource treatment levels during the conservation planning process. A resource concern is a resource condition that does not meet the minimum accepted levels established by planning criteria as shown in Section III of the NRCS Field Office Technical Guide (https://efotg.sc.egov.usda.gov/#/).
• Low risk means a low probability for the category of resource concerns and additional assessment is typically not necessary.
• Medium risk means that the category of resource concerns could occur, and additional assessment is recommended if the identified resource is a client concern and/or objective.
• High risk means that a resource concern in that category is likely to occur.
The resource categories are: S (soil), W (water), A (air), P (plant), A (animal), E (energy), and H (human). The dominant resource concerns further refine the resource category to a specific resource concern within that category.State and transition model
More interactive model formats are also available. View Interactive Models
Click on state and transition labels to scroll to the respective textEcosystem states
SWAPAEHSWAPAEHT1A - Extreme soil disturbance or catastrophic drought State 1 submodel, plant communities
State 2 submodel, plant communities
State 1
ReferenceThe Reference State consists of one plant community, the Gardner's Saltbush/Rhizomatous Wheatgrass community. The dominant shrub species is Gardner's Saltbush and dominant grass is thickspike wheatgrass with bunchgrasses such as Indian ricegrass and bottlebrush squirreltail subdominant.
Characteristics and indicators. This site is characterized by sparse vegetation cover, low production, and shallow to shale bedrock soils. Recognition of bedrock can be difficult as this is often shale weathering in place and can look like soil particles. Reference conditions will persist in the absence of soil disturbing activity such as: high intensity hoof action, anthropogenic activity, or rodent activity. Because of high runoff resulting in low effective precipitation on the site, it is vulnerable to bunchgrass die-off events during extreme drought conditions.
Resilience management. This site has moderate resilience due to its aridic ustic (ustic bordering on aridic) soil moisture regime and frigid bordering on cryic temperature regime (Chambers et.al. 2014). Precipitation is typically low, and runoff potential high due to heavy soil surface textures resulting in slow permeability. The site is very slow to recover after disturbance, and is susceptible to delays in recovery during extreme climatic events such as drought. The site has moderately high resistance to invasion by annual grasses because of climate limitations (dry and cold) and heavy soil surface textures.
Dominant plant species
-
Gardner's saltbush (Atriplex gardneri), shrub
-
thickspike wheatgrass (Elymus lanceolatus ssp. lanceolatus), grass
Dominant resource concerns
-
Sheet and rill erosion
-
Terrestrial habitat for wildlife and invertebrates
-
Inadequate livestock water quantity, quality, and distribution
Community 1.1
Gardner's Saltbush/Rhizomatous WheatgrassThis plant community is adapted to the Cool Central Desertic Basins and Plateaus climatic conditions. The diversity in plant species allows for some drought resistance. This is a sustainable plant community, but is difficult to re-establish after extreme disturbance.
The major grasses include rhizomatous wheatgrass, Indian ricegrass, and bottlebrush squirreltail. Other grasses may include alkali sacaton and Sandberg bluegrass. Gardner’s saltbush, greenmolly summercypress, and winterfat are the predominant woody plants.Dominant plant species
-
Gardner's saltbush (Atriplex gardneri), shrub
-
thickspike wheatgrass (Elymus lanceolatus ssp. lanceolatus), grass
Figure 7. Annual production by plant type (representative values) or group (midpoint values)
Table 5. Annual production by plant type
Plant type Low
(lb/acre)Representative value
(lb/acre)High
(lb/acre)Grass/Grasslike 75 125 175 Shrub/Vine 60 100 140 Forb 15 25 35 Total 150 250 350 Table 6. Soil surface cover
Tree basal cover 0% Shrub/vine/liana basal cover 0-0% Grass/grasslike basal cover 0-0% Forb basal cover 0-0% Non-vascular plants 0% Biological crusts 0-0% Litter 10-30% Surface fragments >0.25" and <=3" 0-10% Surface fragments >3" 0-0% Bedrock 0-10% Water 0% Bare ground 30-60% Figure 8. Plant community growth curve (percent production by month). WY34A02Xa , MLRA34A-Pinedale Plateau-all. Forage Production (herbaceous only) Developed by using the Rangeland Analysis Platform (RAP).
Jan Feb Mar Apr May Jun Jul Aug Sep Oct Nov Dec J F M A M J J A S O N D 1 5 15 24 25 18 9 3 State 2
Eroded
The Eroded State is a result of soil-disturbing activities outside of the normal disturbance regime expected for this site. Examples are high intensity hoof action, anthropogenic activity, rodent activity, or accelerated sheet and rill erosion caused by catastrophic drought followed by high precipitation events.
Characteristics and indicators. There is a shift towards mat-forming and annual forbs, and sheet and rill erosion is apparent. Bare ground will increase to levels exceeding 60 percent, and perennial plant cover and composition will decrease.
Resilience management. Site resilience is lower than the Reference State. Once accelerated soil erosion occurs, the site has limited potential to recover after disturbance. Annual weedy forbs such as halogeton are more likely to invade after ground disturbing activities.
Dominant plant species
-
stemless mock goldenweed (Stenotus acaulis), other herbaceous
Dominant resource concerns
-
Sheet and rill erosion
-
Sediment transported to surface water
-
Plant productivity and health
-
Plant structure and composition
-
Plant pest pressure
-
Terrestrial habitat for wildlife and invertebrates
-
Feed and forage imbalance
-
Inadequate livestock water quantity, quality, and distribution
Community 2.1
Mat Forb/Bare GroundThis plant community is composed of almost entirely mat-forming forbs with bare ground in excess of 60 percent.
The site is not well protected from erosion and Site Stability is Moderate or greater departure from the Reference State. Hydrologic Function is impaired with increased runoff. Biotic integrity is affected by the change in functional/structural group dominance.
It is not often practical or economically feasible to restore this plant community at the present time.
Total annual production ranges from 25 to 225 pounds per acre with a Representative Value (RV) of 125 pounds per acre.Dominant plant species
-
stemless mock goldenweed (Stenotus acaulis), other herbaceous
Transition T1A
State 1 to 2Soil-disturbance outside of the normal disturbance regime expected for this site. Examples include high intensity hoof action, anthropogenic activity (e.g. mechanical disturbance), or rodent activity. Catastrophic drought may be a trigger for this transition.
Constraints to recovery.Soil erosion and subsequent hydrologic changes, persistent drought conditions, and herbivory pressure are constraints to recovery to the Reference State.
Context dependence.Warmer and drier climate trends contribute to uncertainty of restoration efforts. Steeper slopes will have more soil erosion and less likelihood of restoration once degraded. Soil surface chemistry changes (increases in salinity) with exposure of bedrock further reduce chances of restoration.
Key drivers
-
Precipitation (decadal scale)
-
Temperature (decadal scale)
-
Climate
-
Mechanical soil disturbance
Key ecosystem services affected
-
Erosion control
-
Nutrient cycling
-
Primary production
-
Wildlife forage
-
Water regulation
-
Wildlife habitat
-
Storm protection
-
Plant biodiversity
Additional community tables
Table 7. Community 1.1 plant community composition
Group Common name Symbol Scientific name Annual production () Foliar cover (%) Grass/Grasslike1 Perennial Mid-Size Cool Season Bunchgrasses 15–38 Indian ricegrass ACHY Achnatherum hymenoides 13–38 5–10 squirreltail ELEL5 Elymus elymoides 0–25 0–5 2 Rhizomatous Wheatgrasses 35–75 thickspike wheatgrass ELLAL Elymus lanceolatus ssp. lanceolatus 13–75 5–20 western wheatgrass PASM Pascopyrum smithii 0–50 0–20 3 Miscellaneous Grasses/Grasslikes 5–13 Sandberg bluegrass POSE Poa secunda 3–13 1–5 Nuttall's alkaligrass PUNU2 Puccinellia nuttalliana 0–13 0–5 alkali sacaton SPAI Sporobolus airoides 0–13 0–5 Grass, perennial 2GP Grass, perennial 0–13 0–5 Forb4 Perennial Forbs 10–23 buckwheat ERIOG Eriogonum 3–13 1–5 spiny phlox PHHO Phlox hoodii 3–13 1–5 scarlet globemallow SPCO Sphaeralcea coccinea 0–8 0–3 princesplume STANL Stanleya 0–8 0–3 stemless mock goldenweed STAC Stenotus acaulis 0–8 0–3 thrift mock goldenweed STAR10 Stenotus armerioides 0–8 0–3 milkvetch ASTRA Astragalus 0–8 0–3 hoary tansyaster MACA2 Machaeranthera canescens 0–8 0–3 locoweed OXYTR Oxytropis 0–8 0–3 beardtongue PENST Penstemon 0–8 0–3 fleabane ERIGE2 Erigeron 0–8 0–3 evening primrose OENOT Oenothera 0–3 0–1 Douglas' dustymaiden CHDO Chaenactis douglasii 0–3 0–1 pale bastard toadflax COUMP Comandra umbellata ssp. pallida 0–3 0–1 ballhead ipomopsis IPCO5 Ipomopsis congesta 0–3 0–1 desertparsley LOMAT Lomatium 0–3 0–1 onion ALLIU Allium 0–3 0–1 rockcress ARABI2 Arabis 0–3 0–1 sandwort ARENA Arenaria 0–3 0–1 Forb, perennial 2FP Forb, perennial 0–3 0–1 twinpod PHYSA2 Physaria 0–3 0–1 5 Annual Forbs 0–3 cryptantha CRYPT Cryptantha 0–3 0–1 flatspine stickseed LAOC3 Lappula occidentalis 0–3 0–1 Forb, annual 2FA Forb, annual 0–3 0–1 Shrub/Vine6 Miscellaneous Shrubs 45–100 Gardner's saltbush ATGA Atriplex gardneri 25–88 10–20 winterfat KRLA2 Krascheninnikovia lanata 3–25 1–5 green molly BAAM4 Bassia americana 0–13 0–5 greasewood SAVE4 Sarcobatus vermiculatus 0–8 0–3 spineless horsebrush TECA2 Tetradymia canescens 0–3 0–1 Nuttall's horsebrush TENU2 Tetradymia nuttallii 0–3 0–1 shortspine horsebrush TESP2 Tetradymia spinosa 0–3 0–1 Subshrub (<.5m) 2SUBS Subshrub (<.5m) 0–3 0–1 bud sagebrush PIDE4 Picrothamnus desertorum 0–3 0–1 Table 8. Community 2.1 plant community composition
Group Common name Symbol Scientific name Annual production () Foliar cover (%) Interpretations
Animal community
The following table lists initial suggested stocking rates for cattle under continuous season-long grazing under normal growing conditions with a harvest efficiency (HE) of 25 percent. These are conservative estimates that should be used only as guidelines in the initial stages of the conservation planning process. Often, the current plant composition does not entirely match any particular plant community described in this ecological site description. A field visit is required to document actual plant composition and production. More precise carrying capacity estimates, considering forage preference and accessibility (slope, distance to water, etc.), should be calculated using this information, particularly when grazers other than cattle are involved. Under more intensive grazing management, improved harvest efficiencies (up to 35 percent) can result in an increased carrying capacity, but recovery time for upland sites is much longer. If distribution problems occur, stocking rates should be reduced or facilitating conservation practices (i.e., cross-fencing, water development) implemented to maintain plant health and vigor.
Stocking rates are expressed in Animal Unit Months (AUMs) which is defined as the amount of forage consumed by a 1,000 pound cow with a less than 4 month old calf at her side.
Plant Community - Production (lb./ac Low-RV-High) - AUMS/ac - ac/AUM
1.1 Gardner's saltbush/Rhizomatous wheatgrass 150-250-350 0.02 50
2.1 Mat Forb/Bare Ground 25-125-225 0 0
* Continuous, season-long grazing by cattle under average growing conditions
Calculation for stocking rates are as follows: Using Representative (RV) values for production, take forage palatable to grazing cattle and multiply by 0.25 Harvest Efficiency (HE) and divide by 912.5 pounds per AUM air-dry weight (ADW) to arrive at the initial suggested stocking rate in AUMs per acre.
Grazing by domestic livestock is one of the major income-producing industries in the area. Rangeland in this area may provide year-long forage for cattle, sheep, or horses. During the dormant period, the forage for livestock must be supplemented with protein because the quality does not meet minimum livestock requirements.
Distance to water, shrub density, and slope can affect grazing capacity within a management unit. Accessibility adjustments should be made for the planning area as necessary. For example, 30 percent of a management unit may have 25 percent slopes and distances of greater than one mile from water, resulting in a 50 percent reduction in grazing access; therefore, the adjustment is calculated for 30 percent of the unit (i.e. 50 percent reduction on 30 percent of the management unit). Fencing, slope length, management, access, terrain, kind and class of livestock, and breeds are all factors that can increase or decrease the percent of grazing access within a management unit. Adjustments should be made that incorporate these factors when calculating the carrying capacity of a management unit.
Wildlife:
Reference State:
1.1 Gardner’s Saltbush/Rhizomatous Wheatgrass: This community is variable in its value to wildlife. Value is low for species dependent on a greater mixture of shrubs, mid-size cool season bunchgrasses and perennial forbs, however, Gardner’s saltbush and winterfat are preferred browse species for mule deer and pronghorn which can be found foraging on these sites. The area also provides limited foraging opportunities for shrub steppe generalists, but lacks structure to provide adequate cover.
Eroded State:
2.1 Mat Forb/Bareground: This community phase is highly variable in its value to wildlife. It typically is less diverse, has lower forage value and has limited to no structure that wildlife need for cover. This state is vulnerable to repeated disturbance which can result in a complete loss of value for wildlife. In addition, sites in this state are more susceptible to invasion of non-native species, further degrading the value for wildlife.Hydrological functions
Water and usually salinity/alkalinity are the principal factors limiting forage production on this site. This site is dominated by soils in hydrologic group D. Infiltration ranges from slow to very slow. Runoff potential for this site varies from high to very high depending on ground cover. Areas where ground cover is less than 50 percent have the greatest potential to have reduced infiltration and higher runoff (refer to Part 630, NRCS National Engineering Handbook for detailed hydrology information).
Rills and gullies may be present. Water flow patterns may be present but should be barely distinguishable. Pedestals are only slightly present in association with bunchgrasses such as Indian ricegrass. Litter typically falls in place, and signs of movement are not common. Chemical and physical crusts are sometimes present. Cryptogamic crusts are present, but only cover one to two percent of the soil surface.Recreational uses
This site provides opportunities such as prairie dog hunting and Off-Road-Vehicle (ORV) recreational use.
Wood products
None
Supporting information
Inventory data references
Information presented here has been derived from historic and recent clipping data and other inventory data. Field observations from range trained personnel were also used. Inventory Data Resources include: 1 Bureau of Land Management Assessment, Inventory, and Monitoring (BLM-AIM) point (2018) 2 Soil Survey-ESI points (2009)
References
-
. 2021 (Date accessed). USDA PLANTS Database. http://plants.usda.gov.
-
1980. USNVC [United States National Vegetation Classification]. 2019. United States National Vegetation Classification Database, V2.03. Federal Geographic Data Committee, Vegetation Subcommittee, Washington DC.. USNVC: http://usnvc.org/.
-
Aikens, E.O., M.J. Kauffman, J.A. Merkle, Dwinnell, G.A. Fralick, and K.L. Monteith. 2017. The greenscape shapes surfing of resource waves in a large migratory herbivor.. Ecology Letters 20:741–750.
-
Bestelmeyer, B., J.R. Brown, K.M. Havstad, B. Alexander, G. Chavez, and J.E. Herrick. 2003. Development and Use of State and Transition Models for Rangelands. Jornal of Range Management 56:114–126.
-
Bestelmeyer, B., J.R. Brown, J.E. Herrick, D.A. Trujillo, and K.M. Havstad. 2004. Land Management in the American Southwest: a state-and-transition approach to ecosystem
complexity. Environmental Management 34:38–51. -
Bestelmeyer, B. and J. Brown. 2005. State-and-Transition Models 101: A Fresh look at vegetation change.
-
Bestelmeyer, B.T., K. Moseley, P.L. Shaver, H. Sanchez, D.D. Briske, and M.E. Fernandez-Gimenez. 2010. Practical guidance for developing state-and-transition models. Rangelands 32:23–30.
-
Bowker, K.A. 2000. Jonah Field: A Shallow Sweetspot in the Basin-Centered Gas Accumulation of the Northern Green River Basin, Wyoming..
-
Briske, D.D., B.T. Bestelmeyer, T.K. Stringham, and P.L. Shaver. 2008. Recommendations for Development of Resilience-Based State-and-Transition Models. Rangeland Ecology & Management 61:359–367.
-
Chambers, J.C., J.L. Beck, T.J. Christiansen, K.J. Clause, J.B. Dinkins, K.E. Doherty, K.A. Griffin, D.W. Havlina, K.F. Henke, L.L. Kurth, J.D. Maestas, M. Manning, K.E. Mayer, B.A. Mealor, C. McCarthy, M.A. Perea, and D.A. Pyke. 2016. Using resilience and resistance concepts to manage threats to sagebrush ecosystems, Gunnison sage-grouse, and Greater sage-grouse in their eastern range: A strategic multi-scale approach.. Gen. Tech. Rep. RMRS-GTR-356.. U.S. Department of Agriculture, Forest Service, Rocky Mountain Research Station, Fort Collins, CO. 1–143.
-
Martin, J.L. 1996. Geohydrology of Tertiary Rocks in the Green River Structural Basin in Wyoming, Utah, and Colorado.. Water-Resources Investigations Report 92-4164. US Geological Survey.
-
Miller, J.F., R.H. Frederick, and R.J. Tracey. 1973. “Precipitation-Frequency Atlas of the United States” NOAA Atlas 2, Volume 2 (Wyoming). National Weather Service, Silver Spring, Maryland.
-
Schoeneberger, P.J. and D.A. Wysocki. 2017. Geomorphic Description
System, Version 5.0.. -
Stringham, T.K., W.C. Kreuger, and P.L. Shaver. 2003. State and Transition Modeling: an ecological process approach. Journal of Range Management 56:106–113.
-
U. S. Environmental Protection Agency. 2010. Level III and IV ecoregions of the continental United States. U.S. EPA, National Health and Environmental Effects Research Laboratory, Corvallis, Oregon, U.S..
Other references
Site concept, plant community data, and interpretations are based on ecological site descriptions (ESDs) from MLRA 34A-Foothills and Basins West (10-14W).
This ESD replaces R034AY254WY Shale MLRA 34A-Foothills and Basins West (Sh 10-14W), but only within geographic extent of the Pinedale Plateau LRU.
Further data collection and ecological site refinement are ongoing until the ESD has reached "Approved" status.Contributors
Karen J. Clause
Bryan ChristensenApproval
Kirt Walstad, 2/19/2025
Acknowledgments
Sublette County Conservation District Wyoming Game and Fish Department
Rangeland health reference sheet
Interpreting Indicators of Rangeland Health is a qualitative assessment protocol used to determine ecosystem condition based on benchmark characteristics described in the Reference Sheet. A suite of 17 (or more) indicators are typically considered in an assessment. The ecological site(s) representative of an assessment location must be known prior to applying the protocol and must be verified based on soils and climate. Current plant community cannot be used to identify the ecological site.
Author(s)/participant(s) Contact for lead author Date 02/18/2025 Approved by Approval date Composition (Indicators 10 and 12) based on Annual Production Indicators
-
Number and extent of rills:
-
Presence of water flow patterns:
-
Number and height of erosional pedestals or terracettes:
-
Bare ground from Ecological Site Description or other studies (rock, litter, lichen, moss, plant canopy are not bare ground):
-
Number of gullies and erosion associated with gullies:
-
Extent of wind scoured, blowouts and/or depositional areas:
-
Amount of litter movement (describe size and distance expected to travel):
-
Soil surface (top few mm) resistance to erosion (stability values are averages - most sites will show a range of values):
-
Soil surface structure and SOM content (include type of structure and A-horizon color and thickness):
-
Effect of community phase composition (relative proportion of different functional groups) and spatial distribution on infiltration and runoff:
-
Presence and thickness of compaction layer (usually none; describe soil profile features which may be mistaken for compaction on this site):
-
Functional/Structural Groups (list in order of descending dominance by above-ground annual-production or live foliar cover using symbols: >>, >, = to indicate much greater than, greater than, and equal to):
Dominant:
Sub-dominant:
Other:
Additional:
-
Amount of plant mortality and decadence (include which functional groups are expected to show mortality or decadence):
-
Average percent litter cover (%) and depth ( in):
-
Expected annual annual-production (this is TOTAL above-ground annual-production, not just forage annual-production):
-
Potential invasive (including noxious) species (native and non-native). List species which BOTH characterize degraded states and have the potential to become a dominant or co-dominant species on the ecological site if their future establishment and growth is not actively controlled by management interventions. Species that become dominant for only one to several years (e.g., short-term response to drought or wildfire) are not invasive plants. Note that unlike other indicators, we are describing what is NOT expected in the reference state for the ecological site:
-
Perennial plant reproductive capability:
Print Options
Sections
Font
AAAAOther
PrintThe Ecosystem Dynamics Interpretive Tool is an information system framework developed by the USDA-ARS Jornada Experimental Range, USDA Natural Resources Conservation Service, and New Mexico State University.
Accessibility statement


