
Natural Resources
Conservation Service
Ecological site R030XY156CA
Sodic Loam
3-5" p.z.
Last updated: 2/24/2025
Accessed: 08/20/2026
-
Search


Major Land Resource Area or ecological site by name and/or ID.
PreviousSectionsNextGeneral information
Provisional. A provisional ecological site description has undergone quality control and quality assurance review. It contains a working state and transition model and enough information to identify the ecological site.
Classification relationships
California Natural Diversity Database, May 2002. List of California terrestrial natural communities recognized by the California Natural Diversity Database – Desert Bush Seepweed shrub.
Sawyer, J.O. and T. Keeler-Wolf. 1995. Manual of California Vegetation – Bush Seepweed Series.Ecological site concept
This site occurs on nearly alluvial flats adjacent to dry lakebeds. The soils associated with this site are well drained and very deep. These soils are saline and sodic.
Please refer to group concept R030XB114NV to view the provisional STM.Associated sites
R030XY047NV ALLUVIAL PLAIN
Occurs on adjacent hummocks.
R030XY158CA Sodic Bottom 3-5" p.z.
Occurs on adjacent hummocks.
Table 1. Dominant plant species
Tree Not specified
Shrub (1) Atriplex confertifolia
(2) Suaeda moquiniiHerbaceous Not specified
Physiographic features
This site occurs on nearly alluvial flats adjacent to dry lakebeds.
Table 2. Representative physiographic features
Landforms (1) Alluvial flat
Flooding duration Very brief (4 to 48 hours) Flooding frequency Very rare Ponding duration Very brief (4 to 48 hours) Ponding frequency Rare Elevation 2580 – 2800 ft Slope 0 – 2 % Ponding depth 1 – 4 in Aspect Aspect is not a significant factor Climatic features
The primary air masses affecting California are cold maritime polar air from the Gulf of Alaska and warmer, moist maritime subtropical air from lower latitudes. Occasionally there are invasions of cold continental polar air from northern Canada or the Rocky Mountains. Precipitation in the area results primarily from the passage of cyclones with associated fronts during fall, winter and spring; from closed cyclones in late winter and spring; and from the flow of moist tropical air from the southeast to the southwest quadrant in the summer.
Barstow Fire Station, occurs at a lower elevation and has a long-term record from 1980 to 2002. Twentynine Palms Station, occurs at a lower elevation and has a long-term record from 1948 to 2002. This climate summary is based on data from both locations. Warm, moist winters (35 to 70 degrees F) and hot, dry summers (60 to 105 degrees F) characterize the climate on this site. Mean annual air temperature is 65 to 70 degrees F. The average annual precipitation is 3 to 5 inches, with most falling as rain from December through March. Approximately 20 to 45% of the annual precipitation occurs from July to September as a result of intense, convection storms.
Table 3 Representative climatic features
Frost-free period (average) 340 days Freeze-free period (average) Precipitation total (average) 10 in BarLineFigure 1. Monthly precipitation range
BarLineFigure 2. Monthly average minimum and maximum temperature
">Influencing water features
There are no influencing water features associated with this site.
Soil features
The soils associated with this site are well drained and very deep. These soils are saline and sodic. Available water capacity is low to moderate and permeability is moderate to rapid. Effective rooting depth is 60 inches or more. Water tables are greater than 60 inches.
6984702 Calcic Haplosalids-Sodic Haplocalcids complex, 2.8%. Sodic Haplocalcids. Johnson Valley OHV Area Soil Survey
6984730 Calcic Haplosalids-Sodic Haplocalcids-Typic Haplosalids complex, 0-2%. Sodic Haplocalcids. Johnson Valley OHV Area Soil Survey
Table 4. Representative soil features
Surface texture (1) Fine sandy loam
(2) Sandy loam
Family particle size (1) Loamy
Drainage class Well drained Permeability class Moderately slow to rapid Soil depth 60 – 0 in Surface fragment cover <=3" 1 – 10 % Surface fragment cover >3" 0 – 2 % Available water capacity
(0-40in)2.67 – 3.95 in Calcium carbonate equivalent
(0-40in)0 – 10 % Electrical conductivity
(0-40in)4 – 36 mmhos/cm Sodium adsorption ratio
(0-40in)2 – 44 Soil reaction (1:1 water)
(0-40in)7.6 – 8.6 Subsurface fragment volume <=3"
(Depth not specified)1 – 10 % Ecological dynamics
Please refer to group concept R030XB114NV to view the provisional STM.
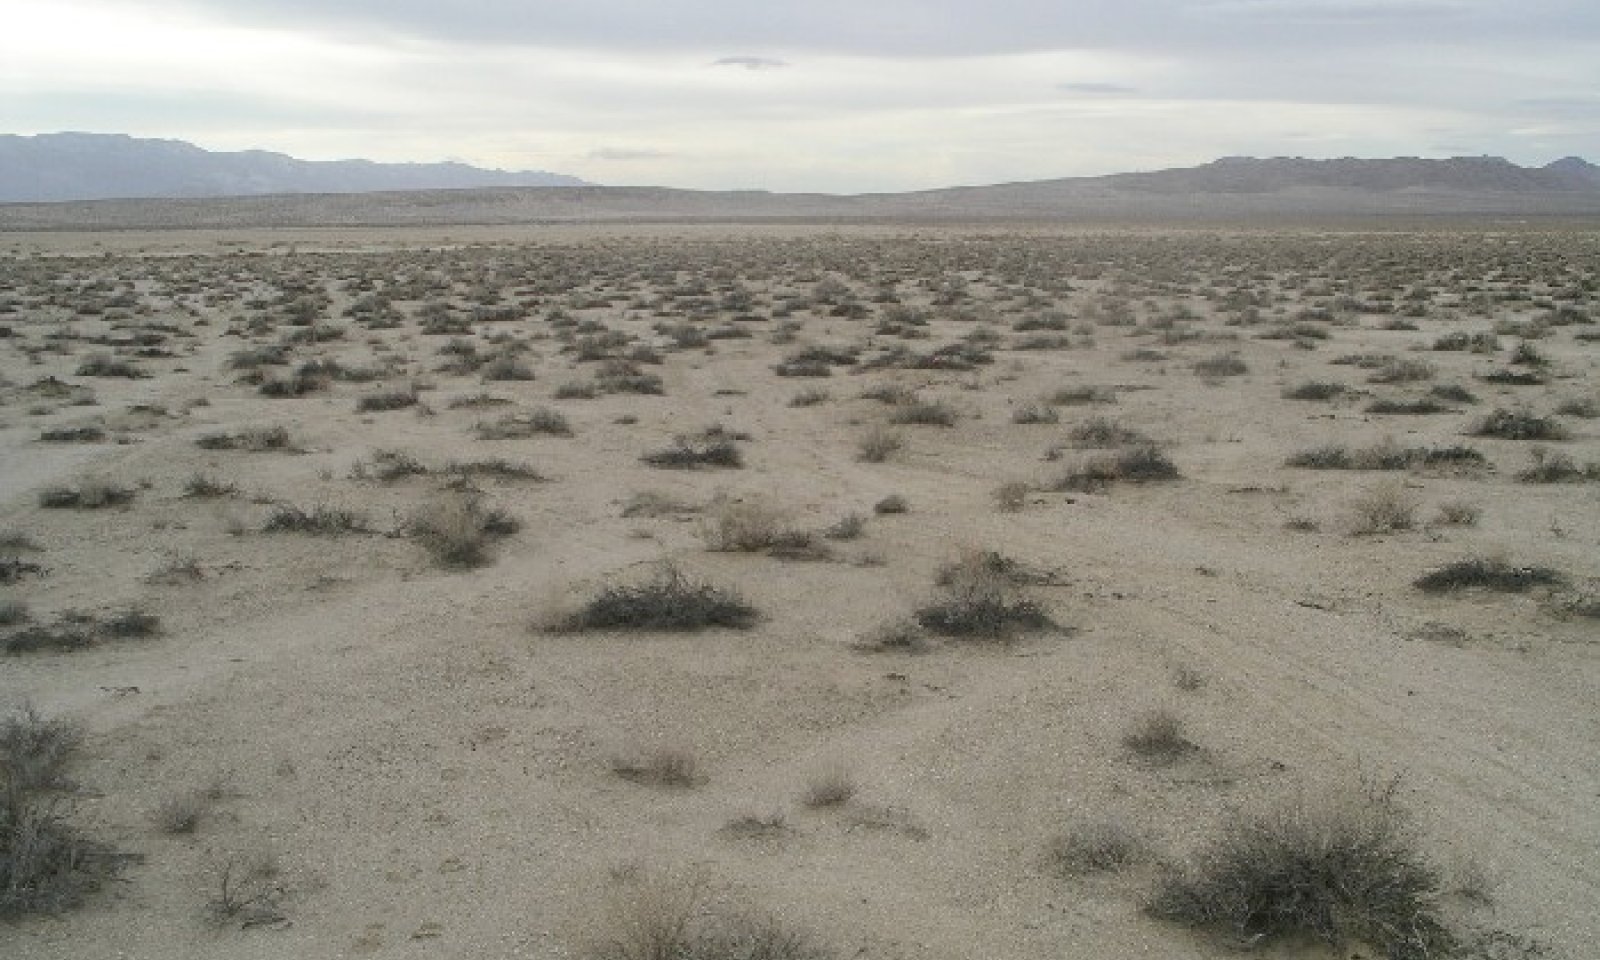
The interpretive plant community for this site is the historic climax plant community. This community is dominated by Mojave seablite (Suaeda moquinii) and shadscale (Atriplex confertifolia). Perennial forbs and grasses are scarce. Annuals are seasonally present. The historic site potential is characterized by widely spaced, succulent shrubs less than a meter tall. Potential vegetative composition is approximately 5% grasses, 5% forbs, and 90% shrubs. This site is stable in this condition.
Species indigenous to this site are recommended for any revegetation efforts. Shadscale and fourwing saltbush has been widely used for rehabilitating disturbed sites. Seeding success is generally sporadic. Seedlings, which tend to be more drought tolerant and less susceptible to predation, may be transplanted. Seedlings are generally transplanted during the early spring.
This site is characterized by low productivity with little plant diversity. Disturbance would allow for the introduction of non-native annuals such as cheatgrass (Bromus tectorum) and Russian thistle (Salsola tragus).State and transition model
More interactive model formats are also available. View Interactive Models
Click on state and transition labels to scroll to the respective textEcosystem states
State 1 submodel, plant communities
State 1
Mojave seablite - ShadscaleCommunity 1.1
Mojave seablite - Shadscale
Figure 3. Sodic Loam
The interpretive plant community for this site is the historic climax plant community. This community is dominated by Mojave seablite (Suaeda moquinii) and shadscale (Atriplex confertifolia). Perennial forbs and grasses are scarce. Annuals are seasonally present. The historic site potential is characterized by widely spaced, succulent shrubs less than a meter tall. Potential vegetative composition is approximately 5% grasses, 5% forbs, and 90% shrubs. This site is stable in this condition.
This list of plants and their relative proportions are based on near normal years. Fluctuations in species composition and relative production may change from year to year dependent upon abnormal precipitation or other climatic factors. The historic climax plant community has been determined by study of rangeland relict areas or other protected areas and historical accounts.Figure 4. Annual production by plant type (representative values) or group (midpoint values)
Table 5. Annual production by plant type
Plant type Low
(lb/acre)Representative value
(lb/acre)High
(lb/acre)Shrub/Vine 93 139 184 Forb 6 9 13 Grass/Grasslike 1 2 3 Total 100 150 200 Table 6. Ground cover
Tree foliar cover 0% Shrub/vine/liana foliar cover 0-0% Grass/grasslike foliar cover 0% Forb foliar cover 0-0% Non-vascular plants 0% Biological crusts 0% Litter 0% Surface fragments >0.25" and <=3" 0% Surface fragments >3" 0% Bedrock 0% Water 0% Bare ground 0% Table 7. Soil surface cover
Tree basal cover 0% Shrub/vine/liana basal cover 0% Grass/grasslike basal cover 0% Forb basal cover 0% Non-vascular plants 0% Biological crusts 0-10% Litter 0-10% Surface fragments >0.25" and <=3" 10-10% Surface fragments >3" 0% Bedrock 0% Water 0% Bare ground 80-90% Table 8. Canopy structure (% cover)
Height Above Ground (ft) Tree Shrub/Vine Grass/
GrasslikeForb <0.5 – – – – >0.5 <= 1 – – – 1-5% >1 <= 2 – – 1-2% – >2 <= 4.5 – 2-10% – – >4.5 <= 13 – – – – >13 <= 40 – – – – >40 <= 80 – – – – >80 <= 120 – – – – >120 – – – – Figure 5. Plant community growth curve (percent production by month). CA3003 , Shadscale. Growth starts in early spring. Flowering and seed set occur by July. Seeds stay on the shrub for several months. Dormancy occurs during the hot summer months..
Jan Feb Mar Apr May Jun Jul Aug Sep Oct Nov Dec J F M A M J J A S O N D 0 5 20 35 20 10 5 5 0 0 0 0 Figure 6. Plant community growth curve (percent production by month). CA3008 , Fourwing saltbush. Growth begins in spring to early summer. Flowering occurs from May through September, and fruit ripens from October to December. Seed dispersal occurs from October through April. Seed may remain on the plants from one to two years..
Jan Feb Mar Apr May Jun Jul Aug Sep Oct Nov Dec J F M A M J J A S O N D 0 0 5 25 35 15 10 5 5 0 0 0 Figure 7. Plant community growth curve (percent production by month). CA3010 , Mojave Seablite. Growth begins in early spring; flowering occurs from July to September..
Jan Feb Mar Apr May Jun Jul Aug Sep Oct Nov Dec J F M A M J J A S O N D 0 0 5 15 20 30 15 10 5 0 0 0 Additional community tables
Table 9. Community 1.1 plant community composition
Group Common name Symbol Scientific name Annual production () Foliar cover (%) Grass/Grasslike1 Perennial Grass 1–3 Grass, perennial 2GP Grass, perennial 1–15 – Forb3 Perennial Forbs 2–4 desert princesplume STPI Stanleya pinnata 2–4 – 4 Annual Forbs 4–9 pincushion flower CHFR Chaenactis fremontii 3–6 – devil's spineflower CHRI Chorizanthe rigida 1–3 – Shrub/Vine5 Other Shrubs 92–179 shadscale saltbush ATCO Atriplex confertifolia 50–100 – Mojave seablite SUMO Suaeda moquinii 30–57 – fourwing saltbush ATCA2 Atriplex canescens 12–22 – 6 Other Shrubs 1–5 burrobush AMDU2 Ambrosia dumosa 1–3 – cattle saltbush ATPO Atriplex polycarpa 0–1 – desert pepperweed LEFR2 Lepidium fremontii 0–1 – Interpretations
Animal community
This site has low species diversity. Small mammals, coyotes and black-tailed jackrabbits may occur. Common lizards include western whiptails. Common birds include horned larks and common ravens. The twigs and foliage of the saltbush provide forage for black-tailed jackrabbits and small mammals. The seeds are consumed by small mammals and birds. The shrubs also provide cover.
Plant use by selected wildlife species includes:
Mojave seablite is used by Black-tailed jackrabbits, non-game birds and small mammals, but the degree of utilization is unknown.
Shadscale and fourwing saltbush are desirable species providing food and cover to Black-tailed jackrabbits, non-game birds and small mammals.Recreational uses
High off-road vehicle usage due to proximity to dry lake beds. Dry lake beds act as staging areas and camp sites for off-roading enthusiasts.
Supporting information
Inventory data references
Data Source:NV-ECS Number of Records:1 Sample Period:8/02 State:CA County:San Bernardino Data Source:Line Transects Number of Records:2 Sample Period:7/02-8/02 State:CA County:San Bernardino
Type locality
Location 1: San Bernardino County, CA UTM zone N UTM northing 3807166 UTM easting 546276 Latitude 34° 24′ 15″ Longitude 116° 29′ 47″ General legal description Means Lake, Johnson Valley, California. Elevation 2650 feet. Other references
Hickman, J.C. (ed).1993. The Jepson Manual: Higher plants of California. University of California Press, Berkeley, CA.
U.S. Department of Agriculture, NRCS. National Range and Pasture Handbook, September 1997.
U.S. Department of Agriculture, Forest Service, Rocky Mountain Research Station, Fire Sciences Laboratory. 2002. Fire Effects Information System [Online] Available: http://www.fs.fed.us/database/feis/plants)
Western Regional Climate Center, Desert Research Institute, Reno, Nevada (http://www.wrcc.dri.edu/index.html)
Locator map image generated using TopoZone.com © 1999-2004 Maps a la carte, Inc. - All rights reserved.
Contributors
Patti Novak-Echenique, Heath M. McAllister
Approval
Sarah Quistberg, 2/24/2025
Rangeland health reference sheet
Interpreting Indicators of Rangeland Health is a qualitative assessment protocol used to determine ecosystem condition based on benchmark characteristics described in the Reference Sheet. A suite of 17 (or more) indicators are typically considered in an assessment. The ecological site(s) representative of an assessment location must be known prior to applying the protocol and must be verified based on soils and climate. Current plant community cannot be used to identify the ecological site.
Author(s)/participant(s) Contact for lead author Date 08/20/2026 Approved by Approval date Composition (Indicators 10 and 12) based on Annual Production Indicators
-
Number and extent of rills:
-
Presence of water flow patterns:
-
Number and height of erosional pedestals or terracettes:
-
Bare ground from Ecological Site Description or other studies (rock, litter, lichen, moss, plant canopy are not bare ground):
-
Number of gullies and erosion associated with gullies:
-
Extent of wind scoured, blowouts and/or depositional areas:
-
Amount of litter movement (describe size and distance expected to travel):
-
Soil surface (top few mm) resistance to erosion (stability values are averages - most sites will show a range of values):
-
Soil surface structure and SOM content (include type of structure and A-horizon color and thickness):
-
Effect of community phase composition (relative proportion of different functional groups) and spatial distribution on infiltration and runoff:
-
Presence and thickness of compaction layer (usually none; describe soil profile features which may be mistaken for compaction on this site):
-
Functional/Structural Groups (list in order of descending dominance by above-ground annual-production or live foliar cover using symbols: >>, >, = to indicate much greater than, greater than, and equal to):
Dominant:
Sub-dominant:
Other:
Additional:
-
Amount of plant mortality and decadence (include which functional groups are expected to show mortality or decadence):
-
Average percent litter cover (%) and depth ( in):
-
Expected annual annual-production (this is TOTAL above-ground annual-production, not just forage annual-production):
-
Potential invasive (including noxious) species (native and non-native). List species which BOTH characterize degraded states and have the potential to become a dominant or co-dominant species on the ecological site if their future establishment and growth is not actively controlled by management interventions. Species that become dominant for only one to several years (e.g., short-term response to drought or wildfire) are not invasive plants. Note that unlike other indicators, we are describing what is NOT expected in the reference state for the ecological site:
-
Perennial plant reproductive capability:
Print Options
Sections
Font
AAAAOther
PrintThe Ecosystem Dynamics Interpretive Tool is an information system framework developed by the USDA-ARS Jornada Experimental Range, USDA Natural Resources Conservation Service, and New Mexico State University.
Accessibility statement


