
Natural Resources
Conservation Service
-
Search


Major Land Resource Area or ecological site by name and/or ID.
PreviousSectionsNextGeneral information
Draft. A draft ecological site description is either incomplete or has not undergone quality control and quality assurance review.
Associated sites
R029XY185CA Shallow Granitic Hills 7-9" p.z.
Shallow Granitic Hills 7-9" p.z. R029XY185CA is typically found on soils derived from granite. Annual production is generally higher.
R030XA051CA Steep Granitic Hills 5-7 p.z.
Steep Granitic Hills 5-7" p.z. R030XA051CA is found on steep slopes (30-60%) and is dominated by fourwing saltbush (Atriplex canescens), Mexican bladdersage (Salazaria mexicana), and California buckwheat (Eriogonum fasciculatum).
Similar sites
R029XY185CA Shallow Granitic Hills 7-9" p.z.
Shallow Granitic Hills 7-9" p.z. R029XY185CA is typically found on soils derived from granite. Annual production is generally higher.
Table 1. Dominant plant species
Tree Not specified
Shrub (1) Coleogyne ramosissima
(2) Eriogonum fasciculatumHerbaceous Not specified
Physiographic features
This ecological site occurs on eroded shoulders and backslopes of fan remnants, hills, mountains, and rock pediments. Slopes range from 8 to 75 percent, but are typical on slopes of 8 to 30 percent.
Table 2. Representative physiographic features
Landforms (1) Mountain
(2) Fan remnant
(3) Hill
Flooding frequency None Ponding frequency None Elevation 2460 – 4350 ft Slope 8 – 75 % Water table depth 60 – 0 in Aspect Aspect is not a significant factor Climatic features
The Mojave Desert experiences clear, dry conditions for a majority of the year. Winter temperatures are mild, summer temperatures are hot, and seasonal and diurnal temperature fluctuations are large. Monthly minimum temperature averages range from 30 to 80 degrees F (-1 to 27 degrees C). Monthly maximum temperature averages range from 60 to 110 degrees F (16 to 43 degrees C) (CSU 2002).
Average annual rainfall is between 2 and 8 inches (50 to 205 millimeters) (USDA 2006). Snowfall is more common at elevations above 4000 feet (1220 meters), but it may not occur every year (WRCC 2002). The Mojave Desert receives precipitation from two sources. Precipitation falls primarily in the winter as a result of storms originating in the northern Pacific Ocean. The Sierra Nevada and Transverse Ranges create a rain shadow effect, causing little precipitation to reach the Mojave Desert. Sporadic rainfall occurs during the summer as a result of convection storms formed when moisture from the Gulf of Mexico or Gulf of California moves into the region. Summer rainfall is more common and has a greater influence on soil moisture in the eastern Mojave Desert.
Windy conditions are also common in the Mojave Desert, particularly in the west and central Mojave Desert. Spring is typically the windiest season, with winds averaging 10-15 miles per hour (WRCC 2002). Winds in excess of 25 miles per hour and gusts in excess of 50 miles per hour are not uncommon (CSU 2002).
Although half of the Jawbone-Butterbredt ACEC Soil Survey is in the Mojave Desert (MLRA 30), the western and northwestern areas of the survey transition into the Southern Nevada Basin and Range (MLRA 29). As the Mojave Desert transitions into the Southern Nevada Basin and Range, the temperature range generally becomes cooler (WRCC 2002). Precipitation as rain and as snow also increases (USDA 2006). This survey area has a wide range of precipitation due to its location. Where the Mojave Desert influences are stronger, average annual precipitation ranges from 5 to 7 inches (127 to 178 millimeters). Where the Southern Nevada Basin and Range influences are stronger, average annual precipitation commonly ranges from 7 to 9 inches (178 to 229 millimeters), and may range up to 12 inches (305 millimeters) annually (WRCC 2002). At elevations above 4000 feet (1370 meters), average annual snowfall may reach 20 inches (WRCC 2002).
The data from the following climate stations were used to describe the climate in the Jawbone-Butterbredt ACEC Soil Survey (station number in parentheses):
Cantil, CA (041488)
Inyokern, CA (044278)
Mojave, CA (045756)
Tehachapi, CA (048826)
"Maximum monthly precipitation" represents average monthly precipitation.
Table 3 Representative climatic features
Frost-free period (average) 300 days Freeze-free period (average) 320 days Precipitation total (average) 10 in BarLineFigure 1. Monthly precipitation range
BarLineFigure 2. Monthly average minimum and maximum temperature
">Influencing water features
Soil features
This ecological site is found on soils mainly formed from colluvium and residuum derived from metamorphic rock and basalt. It may also be found on soils derived from granitic alluvium. However, the extent of this ecolgical site on these soils is minimal in acreage. Soil textures are sandy loams and sandy clay loams. Soils depths range from shallow to bedrock (Pasopeak) to very deep (Goldpeak).
Shallow soils have an argillic horizon above a lithic contact. They are well drained, have slow permeability, and have very high runoff. Available water capacity is very low.
Very deep soils are shallow to an argillic horizon. They are well drained, have rapid permeability, and have low to medium runoff. Available water capacity is low to moderate.
The soils classify as follows:
Pasopeak -- Loamy-skeletal, mixed, superactive, thermic Lithic Haplargids
Goldpeak -- Coarse-loamy, mixed, superactive, thermic Typic Haplargids
Soil survey area - Map unit symbol - Component
CA682 - 3430 - Pasopeak (major)
CA682 - 3430 - Typic Haplargids
CA682 - 6001 - Typic Torriorthents
CA682 - 6002 - Typic Haplargids
CA682 - 6003 - Goldpeak, moist
CA682 - 6601 - Typic TorriorthentsTable 4. Representative soil features
Surface texture (1) Sandy loam
(2) Gravelly loamy sand
Family particle size (1) Loamy
Drainage class Well drained Permeability class Slow to rapid Soil depth 17 – 80 in Surface fragment cover <=3" 45 – 85 % Surface fragment cover >3" 0 – 8 % Available water capacity
(0-40in)0.6 – 2.4 in Calcium carbonate equivalent
(0-40in)0 – 1 % Electrical conductivity
(0-40in)0 – 4 mmhos/cm Sodium adsorption ratio
(0-40in)0 – 1 Soil reaction (1:1 water)
(0-40in)6.6 – 7.8 Subsurface fragment volume <=3"
(Depth not specified)15 – 80 % Subsurface fragment volume >3"
(Depth not specified)0 – 2 % Ecological dynamics
The dominant shrubs on this ecological site are blackbrush (Coleogyne ramosissima) and California buckwheat (Eriogonum fasciculatum). The major grass is Sandberg bluegrass (Poa secunda). Blackbrush is shallow-rooting, slow-growing species commonly found on shallow or stable soils (Anderson 2001). The stable soils on which it is found often have an argillic horizon at shallow depth, which may aid blackbrush survival by supplying more water to blackbrush’s shallow roots. California buckwheat and Sandberg bluegrass are widespread species that tolerate a range of environmental conditions (Hickman 1993, Howard 1997).
The dominance of blackbrush suggests that disturbances to this area are not common and/or are not intense. This ecosite is not affected by flooding or ponding. Wildfire has historically been a rare occurrence in the desert, but its effects may be severe. Widely spaced shrubs and discontinuous fuels prevented fires from spreading easily, but the presence of invasive species makes a more continuous, easily ignitable fuel bed (Clarke 2006). This ecological site currently has few such species, but it is in close proximity to areas containing invasive species. Because invasive species travel easily via animal movement or recreational activities, this ecological site may be easily invaded.
Blackbrush communities are likely to be significantly altered by fire or other widespread disturbance. The ability of blackbrush to recolonize a disturbed site is severely limited by infrequent seedling establishment and an inability of existing plants to resprout following a disturbance. California buckwheat, Sandberg bluegrass, and several other species present in lesser amount would increase following a disturbance. These other species include spiny hopsage (Grayia spinosa), Cooper’s goldenbush (Ericameria cooperi), and burrobrush (Hymenoclea salsola). Ample seed production, easy seed dispersal, and rapid growth help these species establish on disturbed areas. Sandberg bluegrass also has the ability to resprout following a disturbance. Reduced competition from late seral species for light, water, and nutrients facilitates plant growth.
State and transition model
More interactive model formats are also available. View Interactive Models
Click on state and transition labels to scroll to the respective textEcosystem states
State 1 submodel, plant communities
State 1
Blackbrush - Sandberg bluegrassCommunity 1.1
Blackbrush - Sandberg bluegrass
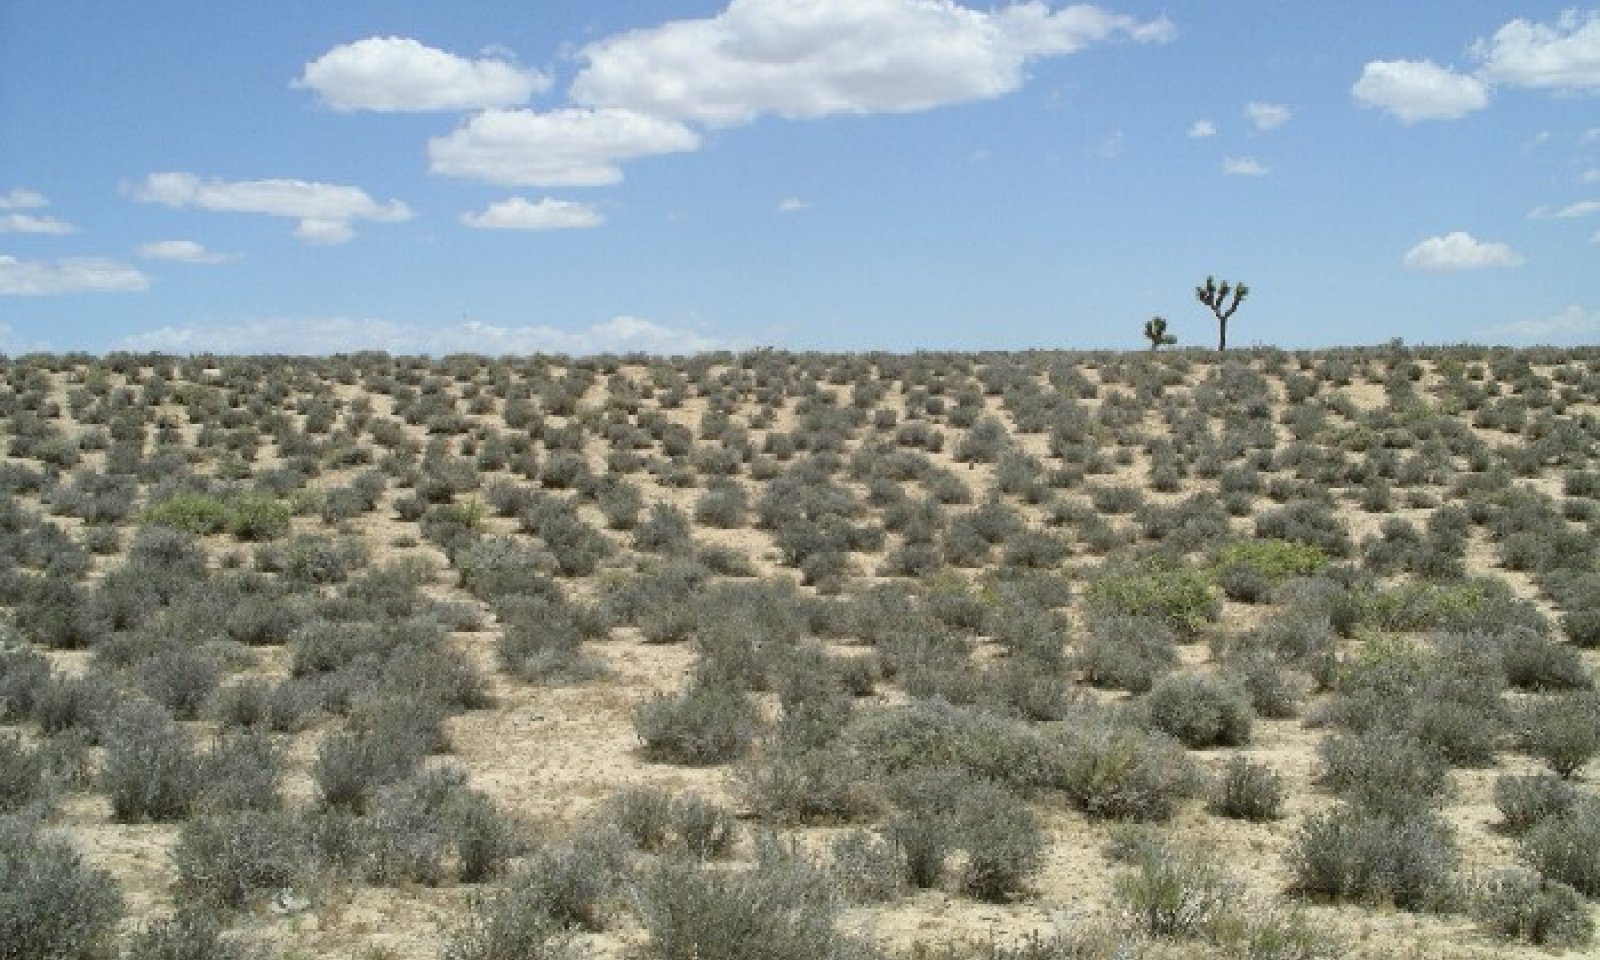
Figure 3. Shallow Granitic Slope 7-9" p.z.
The interpretive plant community is the reference plant community prior to European colonization.
This ecological site is dominated by blackbrush (Coleogyne ramosissima). California buckwheat (Eriogonum fasciculatum) and Sandberg bluegrass (Poa secunda) are the other major species. Species present in small amounts include spiny hopsage (Grayia spinosa), Cooper’s goldenbush (Ericameria cooperi), and burrobrush (Hymenoclea salsola). This community is approximately 70% shrubs, 20% grasses, and 10% forbs.
Figure 4. Annual production by plant type (representative values) or group (midpoint values)
Table 5. Annual production by plant type
Plant type Low
(lb/acre)Representative value
(lb/acre)High
(lb/acre)Shrub/Vine 108 219 292 Grass/Grasslike 28 54 72 Forb 14 27 36 Total 150 300 400 Table 6. Ground cover
Tree foliar cover 0% Shrub/vine/liana foliar cover 20-30% Grass/grasslike foliar cover 0-10% Forb foliar cover 0-0% Non-vascular plants 0% Biological crusts 0% Litter 0% Surface fragments >0.25" and <=3" 0% Surface fragments >3" 0% Bedrock 0% Water 0% Bare ground 0% Table 7. Soil surface cover
Tree basal cover 0% Shrub/vine/liana basal cover 10-20% Grass/grasslike basal cover 0-0% Forb basal cover 0-0% Non-vascular plants 0% Biological crusts 0% Litter 30-40% Surface fragments >0.25" and <=3" 0% Surface fragments >3" 0% Bedrock 0% Water 0% Bare ground 0% Table 8. Canopy structure (% cover)
Height Above Ground (ft) Tree Shrub/Vine Grass/
GrasslikeForb <0.5 – – – 2-3% >0.5 <= 1 – – – – >1 <= 2 – 7-10% 3-5% – >2 <= 4.5 – 15-20% – – >4.5 <= 13 – – – – >13 <= 40 – – – – >40 <= 80 – – – – >80 <= 120 – – – – >120 – – – – Additional community tables
Table 9. Community 1.1 plant community composition
Group Common name Symbol Scientific name Annual production () Foliar cover (%) Shrub/Vine1 Native Shrubs 108–292 blackbrush CORA Coleogyne ramosissima 90–240 – Eastern Mojave buckwheat ERFA2 Eriogonum fasciculatum 8–20 – burrobrush HYSA Hymenoclea salsola 4–12 – spiny hopsage GRSP Grayia spinosa 3–8 – Nevada jointfir EPNE Ephedra nevadensis 1–4 – water jacket LYAN Lycium andersonii 1–4 – peach thorn LYCO2 Lycium cooperi 1–4 – Grass/Grasslike2 Perennial Grass 28–72 Sandberg bluegrass POSE Poa secunda 28–72 – Forb3 Native Forbs 14–36 lacy phacelia PHTA Phacelia tanacetifolia 6–16 – bristly fiddleneck AMTE3 Amsinckia tessellata 6–16 – woollystar ERIAS Eriastrum 2–4 – Interpretations
Animal community
This ecological site provides habitat for small mammals and rodents. Shallow soils may be more restrictive as burrowing habitat than very deep soils.
This ecological site is generally poorly suited for livestock grazing. The dominant shrub is a poor browse species (Sampson and Jesperson 1963). Sandberg bluegrass is a more valuable forage species, but it grows in relatively small amounts on this ecosite.
Supporting information
Inventory data references
1 SCS Range 417 Production and Composition Record
Type locality
Location 1: Kern County, CA UTM zone N UTM northing 3919992 UTM easting 402734 Latitude 35° 25′ 6″ Longitude 118° 4′ 16″ General legal description This site is located in the Jawbone-Butterbredt ACEC off SC99, 1 miles west of the junction with SC171. Other references
Anderson, M.D. 2001. Coleogyne ramosissima. In: Fire Effects Information System, [Online]. U.S. Department of Agriculture, Forest Service, Rocky Mountain Research Station, Fire Sciences Laboratory (Producer). Available: http://www.fs.fed.us/database/feis [2006, September 6].
California State University (CSU) Desert Studies Center. 2002. Desert Climate. CSU Desert Studies Center, Soda Springs, CA. Online. http://biology.fullerton.edu/facilities/dsc/zz_climate.html. Accessed 28 November 2006.
Clarke, C. 2006. The year we lost the deserts. Earth Island Journal. 20(4): 24-56.
Hickman, James C. (Ed.). 1993. The Jepson manual: higher plants of California. University of California Press, Berkeley, CA. 1400 pp.
Howard, Janet L. 1997. Poa secunda. In: Fire Effects Information System, [Online]. U.S. Department of Agriculture, Forest Service, Rocky Mountain Research Station, Fire Sciences Laboratory (Producer). Available: http://www.fs.fed.us/database/feis/ [2007, January 18].
United States Department of Agriculture (USDA), Natural Resources Conservation Service. 2006. Land Resource Regions and Major Land Resource Areas of the United States, the Caribbean, and the Pacific Basin. U.S. Department of Agriculture Handbook 296.
Western Regional Climate Center (WRCC). 2002. Western U.S. Climate Historical Summaries [Online]. Desert Research Institute, Reno, NV. Online. http://www.wrcc.dri.edu/Climsum.html. Accessed 28 November 2006.
Locator map image generated using TopoZone.com © 1999-2004 Maps a la carte, Inc. - All rights reserved.
Contributors
Heath M. McAllister
Rangeland health reference sheet
Interpreting Indicators of Rangeland Health is a qualitative assessment protocol used to determine ecosystem condition based on benchmark characteristics described in the Reference Sheet. A suite of 17 (or more) indicators are typically considered in an assessment. The ecological site(s) representative of an assessment location must be known prior to applying the protocol and must be verified based on soils and climate. Current plant community cannot be used to identify the ecological site.
Author(s)/participant(s) Contact for lead author Date Approved by Approval date Composition (Indicators 10 and 12) based on Annual Production Indicators
-
Number and extent of rills:
-
Presence of water flow patterns:
-
Number and height of erosional pedestals or terracettes:
-
Bare ground from Ecological Site Description or other studies (rock, litter, lichen, moss, plant canopy are not bare ground):
-
Number of gullies and erosion associated with gullies:
-
Extent of wind scoured, blowouts and/or depositional areas:
-
Amount of litter movement (describe size and distance expected to travel):
-
Soil surface (top few mm) resistance to erosion (stability values are averages - most sites will show a range of values):
-
Soil surface structure and SOM content (include type of structure and A-horizon color and thickness):
-
Effect of community phase composition (relative proportion of different functional groups) and spatial distribution on infiltration and runoff:
-
Presence and thickness of compaction layer (usually none; describe soil profile features which may be mistaken for compaction on this site):
-
Functional/Structural Groups (list in order of descending dominance by above-ground annual-production or live foliar cover using symbols: >>, >, = to indicate much greater than, greater than, and equal to):
Dominant:
Sub-dominant:
Other:
Additional:
-
Amount of plant mortality and decadence (include which functional groups are expected to show mortality or decadence):
-
Average percent litter cover (%) and depth ( in):
-
Expected annual annual-production (this is TOTAL above-ground annual-production, not just forage annual-production):
-
Potential invasive (including noxious) species (native and non-native). List species which BOTH characterize degraded states and have the potential to become a dominant or co-dominant species on the ecological site if their future establishment and growth is not actively controlled by management interventions. Species that become dominant for only one to several years (e.g., short-term response to drought or wildfire) are not invasive plants. Note that unlike other indicators, we are describing what is NOT expected in the reference state for the ecological site:
-
Perennial plant reproductive capability:
Print Options
Sections
Font
AAAAOther
PrintThe Ecosystem Dynamics Interpretive Tool is an information system framework developed by the USDA-ARS Jornada Experimental Range, USDA Natural Resources Conservation Service, and New Mexico State University.
Accessibility statement


