
Natural Resources
Conservation Service
-
Search


Major Land Resource Area or ecological site by name and/or ID.
PreviousSectionsNextGeneral information
Provisional. A provisional ecological site description has undergone quality control and quality assurance review. It contains a working state and transition model and enough information to identify the ecological site.
MLRA notes
Major Land Resource Area (MLRA): 022A–Sierra Nevada and Tehachapi Mountains
This ESD was developed using older policy requirements which have been improved with the intent of improving ESD products overall. Users should approach these materials with some caution as the content herein, while likely useful for some purposes, was developed within parameters now recognized as needing varying levels of improvement. As always, a site-specific investigation is highly recommended when site-specific management alternatives are to be developed and/or management decisions are to be made.
Each ESD is an interpretation of the ecological relationships between biotic and abiotic aspects of the landscape. Users of this document should be aware of the limitations of this tool to the extent that specific local conditions may not be entirely captured within the ESD. In particular, management decisions should be supported by site-specific inventories, assessments and planning processes based on the best available information including and extending beyond the ESD.
An ESD is not a permanent determination of ecological dynamics. Rather, each ESD is an evolving body of work intrinsically tied to the soil surveys and data associated with soil map unit components of correlated soil-ecological site relationships. As new information becomes available, updates may be made or may be underway at any given time. Minor updates may be made without announcement when such changes do not modify the ecological site concept, the soils correlated or the state-and-transition model.
Associated sites
R022AY017NV SEMI-WET MEADOW
R022AY018NV DRY MEADOW
Table 1. Dominant plant species
Tree Not specified
Shrub (1) Artemisia arbuscula
Herbaceous (1) Poa
(2) CarexPhysiographic features
This site occurs on toeslopes in intermontane basins. Slopes range from 4 to 15 percent, but slope gradients of 2 to 8 are most typical. Elevations are 7000 to over 9000 feet.
Table 2. Representative physiographic features
Landforms (1) Intermontane basin
Elevation 7000 – 9000 ft Slope 4 – 15 % Climatic features
The climate on this site is subhumid-continental, characterized by cold, moist winters, and cool dry summers. Average annual precipitation is 16 inches to 24 inches. Mean annual air temperature is 40 to 44 degrees F. The average growing season is about 40 to 70 days. Climate data used to support this section were derived from PRISM and is not specifically tied to any dominant climate station.
Table 3 Representative climatic features
Frost-free period (average) 70 days Freeze-free period (average) 0 days Precipitation total (average) 20 in BarLineFigure 1. Monthly precipitation range
BarLineFigure 2. Monthly average minimum and maximum temperature
">Influencing water features
There are no influencing water features associated with this site.
Soil features
The soils associated with this site are very deep, well drained soils that formed in alluvium derived from altered tuff, tuff-breccia, and andesite. An argillic horizion occurs from 2 to 60 inches, and a mollic epipedon occurs from the soil surface to 60 inches. Vertical cracks are present in the upper 30 to 45 inches and are open from July to October of most years. The soils are usually moist in the moisture control section during fall, winter, and spring and usually dry from July through early October. Soil series associated with this site include: Bagval.
CA729 Toiyabe National Forest Area, California
310;Bagval-Wetbag complex, 0 to 8 percent slopes;Bagval
350;Leroman-Chenhigh-Celeridge association;Bagval
390;Heenlake-Loope-Chenhigh association;Bagval
Table 4. Representative soil features
Parent material (1) Alluvium – tuff breccia
Surface texture (1) Clay loam
(2) Extremely gravelly sandy loam
(3) Extremely gravelly sandy clay loam
Family particle size (1) Loamy
Drainage class Well drained Permeability class Very slow Soil depth 72 – 0 in Surface fragment cover <=3" 10 – 15 % Available water capacity
(0-40in)6.7 in Electrical conductivity
(0-40in)Not specified Sodium adsorption ratio
(0-40in)Not specified Soil reaction (1:1 water)
(0-40in)6.1 – 8.4 Subsurface fragment volume <=3"
(Depth not specified)8 % Subsurface fragment volume >3"
(Depth not specified)2 % Ecological dynamics
As ecological condition declines, big sagebrush, snowberry and other woody plants increase in prevalence as Letterman's needlegrass, mountain brome and other perennial grasses and forbs decline in the understory.
Fire Ecology:
Prior to 1897, mean fire return intervals for low sagebrush communities have been estimated to be from 35 to over 100 years. Fire most often occurs during wet years with high forage production. Low sagebrush is very susceptible to fire damage. Low sagebrush is usually killed by fire and does not re-sprout. The recovery in burned areas is usually via small, light, wind-dispersed seed for all low sagebrush subspecies. Partially injured low sagebrush may re-grow from living branches, but sprouting does not occur. Sedge is top-killed by fire, with rhizomes protected by insulating soil. The rhizomes of sedge species may be killed by high-severity fires that remove most of the soil organic layer. Reestablishment after fire occurs by seed establishment and/or rhizomatous spread.
State and transition model
More interactive model formats are also available. View Interactive Models
Click on state and transition labels to scroll to the respective textEcosystem states
State 1 submodel, plant communities
State 1
Reference StateCommunity 1.1
Reference Plant Community
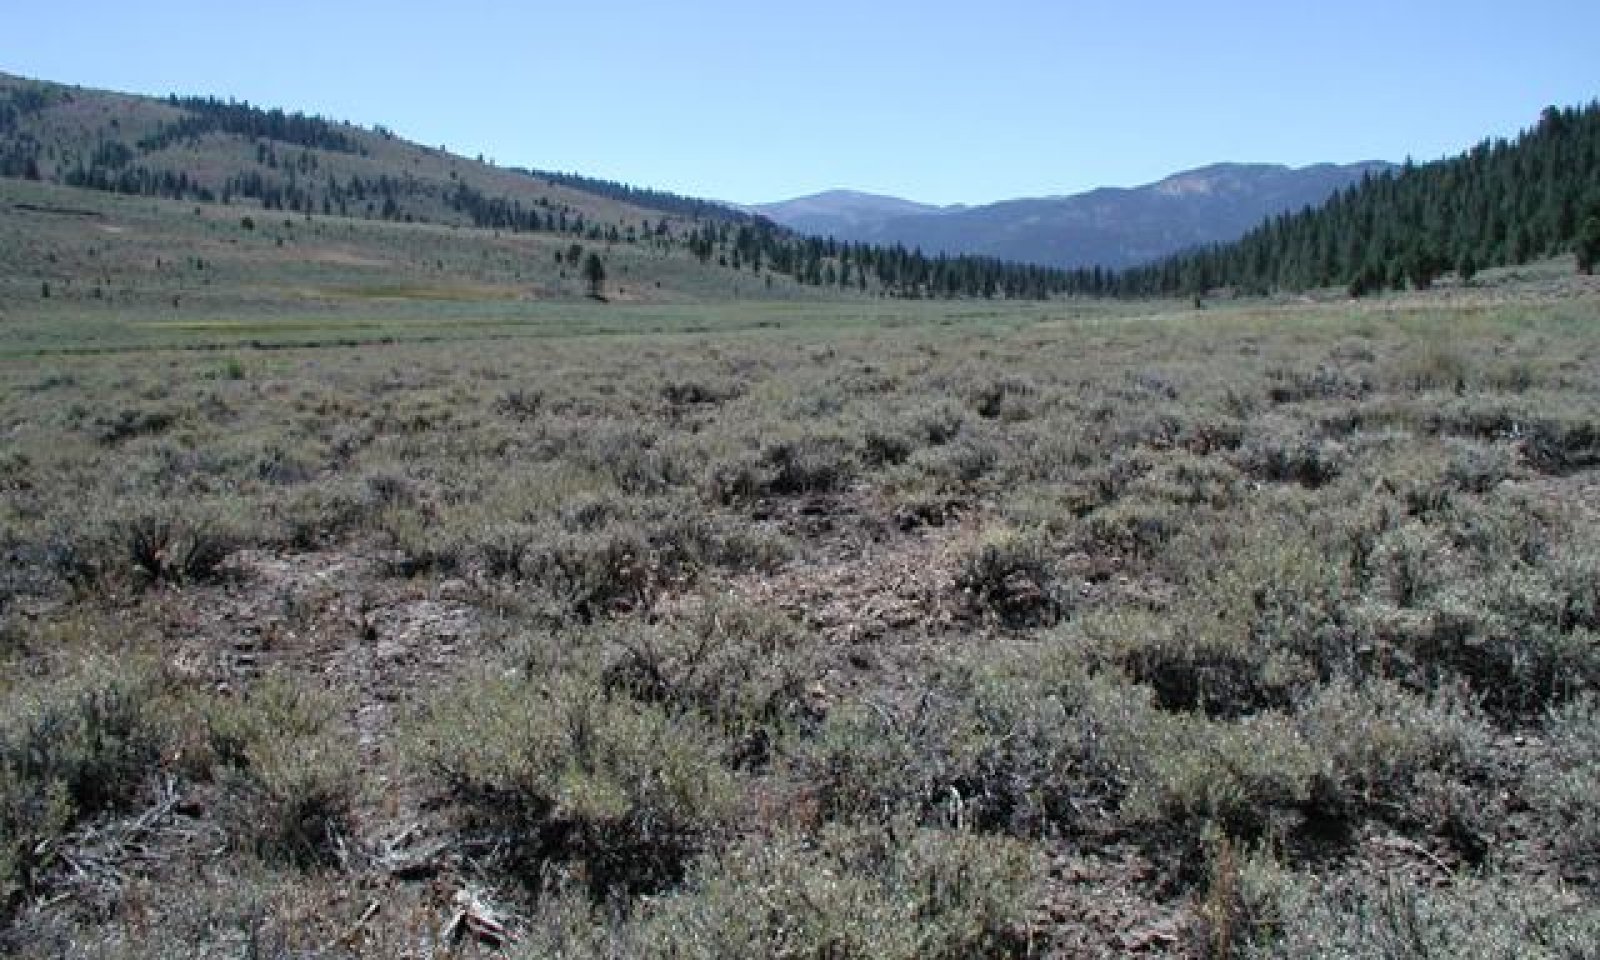
The reference plant community is characterized by an open canopy of soft-woody shrubs and a dense understory of perennial grasses. The representative plant community is dominated by bluegrasses, sedges and low sagebrush. Potential vegetative composition is about 55% grasses, 10% forbs, and 35% shrubs. Approximate ground cover(basal and crown) is 25 to 40 percent.
Figure 3. Annual production by plant type (representative values) or group (midpoint values)
Table 5. Annual production by plant type
Plant type Low
(lb/acre)Representative value
(lb/acre)High
(lb/acre)Grass/Grasslike 83 165 275 Shrub/Vine 52 105 175 Forb 15 30 50 Total 150 300 500 Additional community tables
Table 6. Community 1.1 plant community composition
Group Common name Symbol Scientific name Annual production () Foliar cover (%) Grass/Grasslike1 Primary Perennial Grasses/Grasslikes 105–165 bluegrass POA Poa 60–90 – sedge CAREX Carex 45–75 – 2 Secondary Perennial Grasses/Grasslikes 15–30 big squirreltail ELMU3 Elymus multisetus 2–9 – slender wheatgrass ELTR7 Elymus trachycaulus 2–9 – rush JUNCU Juncus 2–9 – basin wildrye LECI4 Leymus cinereus 2–9 – Forb3 Perennial Forbs 30–45 lupine LUPIN Lupinus 2–6 – phlox PHLOX Phlox 2–6 – Shrub/Vine4 Primary Shrubs 75–105 little sagebrush ARAR8 Artemisia arbuscula 75–105 – 5 Secondary Shrubs 6–24 yellow rabbitbrush CHVI8 Chrysothamnus viscidiflorus 3–6 – antelope bitterbrush PUTR2 Purshia tridentata 3–6 – mountain snowberry SYOR2 Symphoricarpos oreophilus 3–6 – Interpretations
Animal community
Livestock Interpretations:
This site is suited to livestock grazing. Grazing management should be keyed to bluegrass production. Domestic sheep and to a much lesser degree cattle consume low sagebrush, particularly during the spring, fall and winter. Bluegrass is a widespread forage grass. It is one of the earliest grasses in the spring and is sought by domestic livestock and several wildlife species. Sandberg bluegrass is a palatable species, but its production is closely tied to weather conditions. It produces little forage in drought years, making it a less dependable food source than other perennial bunchgrasses. Sedge provides good to fair forage for domestic grazing.
Stocking rates vary over time depending upon season of use, climate variations, site, and previous and current management goals. A safe starting stocking rate is an estimated stocking rate that is fine tuned by the client by adaptive management through the year and from year to year.
Wildlife Interpretations:
Low sagebrush is considered a valuable browse plant during the spring, fall and winter months. In some areas it is of little value in winter due to heavy snow. Mule deer utilize and sometimes prefer low sagebrush, particularly in winter and early spring. Bluegrass is an important forage species for several wildlife species. Sedges have a high to moderate resource value for elk and a medium value for mule deer. Elk consume beaked sedge later in the growing season.
Hydrological functions
Permeability is very slow.
Other information
Low sagebrush can be successfully transplanted or seeded in restoration.
Supporting information
Type locality
Location 1: Alpine County, CA Township/Range/Section T9N R21E S22 Latitude 38° 36′ 39″ Longitude 119° 28′ 60″ General legal description Humboldt-Toiyabe National Forest, approximately 1.22 miles from Bagley Valley. Other references
Fire Effect Information System (Online; http://www.fs.fed.us/database/feis/plants/).
USDA-NRCS Plants Database (Online; http://plants.usda.gov/).
Contributors
ALM/GKB
Rangeland health reference sheet
Interpreting Indicators of Rangeland Health is a qualitative assessment protocol used to determine ecosystem condition based on benchmark characteristics described in the Reference Sheet. A suite of 17 (or more) indicators are typically considered in an assessment. The ecological site(s) representative of an assessment location must be known prior to applying the protocol and must be verified based on soils and climate. Current plant community cannot be used to identify the ecological site.
Author(s)/participant(s) Contact for lead author Date Approved by Approval date Composition (Indicators 10 and 12) based on Annual Production Indicators
-
Number and extent of rills:
-
Presence of water flow patterns:
-
Number and height of erosional pedestals or terracettes:
-
Bare ground from Ecological Site Description or other studies (rock, litter, lichen, moss, plant canopy are not bare ground):
-
Number of gullies and erosion associated with gullies:
-
Extent of wind scoured, blowouts and/or depositional areas:
-
Amount of litter movement (describe size and distance expected to travel):
-
Soil surface (top few mm) resistance to erosion (stability values are averages - most sites will show a range of values):
-
Soil surface structure and SOM content (include type of structure and A-horizon color and thickness):
-
Effect of community phase composition (relative proportion of different functional groups) and spatial distribution on infiltration and runoff:
-
Presence and thickness of compaction layer (usually none; describe soil profile features which may be mistaken for compaction on this site):
-
Functional/Structural Groups (list in order of descending dominance by above-ground annual-production or live foliar cover using symbols: >>, >, = to indicate much greater than, greater than, and equal to):
Dominant:
Sub-dominant:
Other:
Additional:
-
Amount of plant mortality and decadence (include which functional groups are expected to show mortality or decadence):
-
Average percent litter cover (%) and depth ( in):
-
Expected annual annual-production (this is TOTAL above-ground annual-production, not just forage annual-production):
-
Potential invasive (including noxious) species (native and non-native). List species which BOTH characterize degraded states and have the potential to become a dominant or co-dominant species on the ecological site if their future establishment and growth is not actively controlled by management interventions. Species that become dominant for only one to several years (e.g., short-term response to drought or wildfire) are not invasive plants. Note that unlike other indicators, we are describing what is NOT expected in the reference state for the ecological site:
-
Perennial plant reproductive capability:
Print Options
Sections
Font
AAAAOther
PrintThe Ecosystem Dynamics Interpretive Tool is an information system framework developed by the USDA-ARS Jornada Experimental Range, USDA Natural Resources Conservation Service, and New Mexico State University.
Accessibility statement


