
Natural Resources
Conservation Service
-
Search


Major Land Resource Area or ecological site by name and/or ID.
PreviousSectionsNextGeneral information
Draft. A draft ecological site description is either incomplete or has not undergone quality control and quality assurance review.
Associated sites
R022AY010NV MOUNTAIN SHOULDERS 30+ P.Z.
R022AY011NV MOUNTAIN RIDGE 30+ P.Z.
R022AY021NV SOUTH SLOPE 30+ P.Z.
R022AY031NV LOAMY SLOPE 30+ P.Z.
Table 1. Dominant plant species
Tree Not specified
Shrub Not specified
Herbaceous (1) Wyethia amplexicaulis
Physiographic features
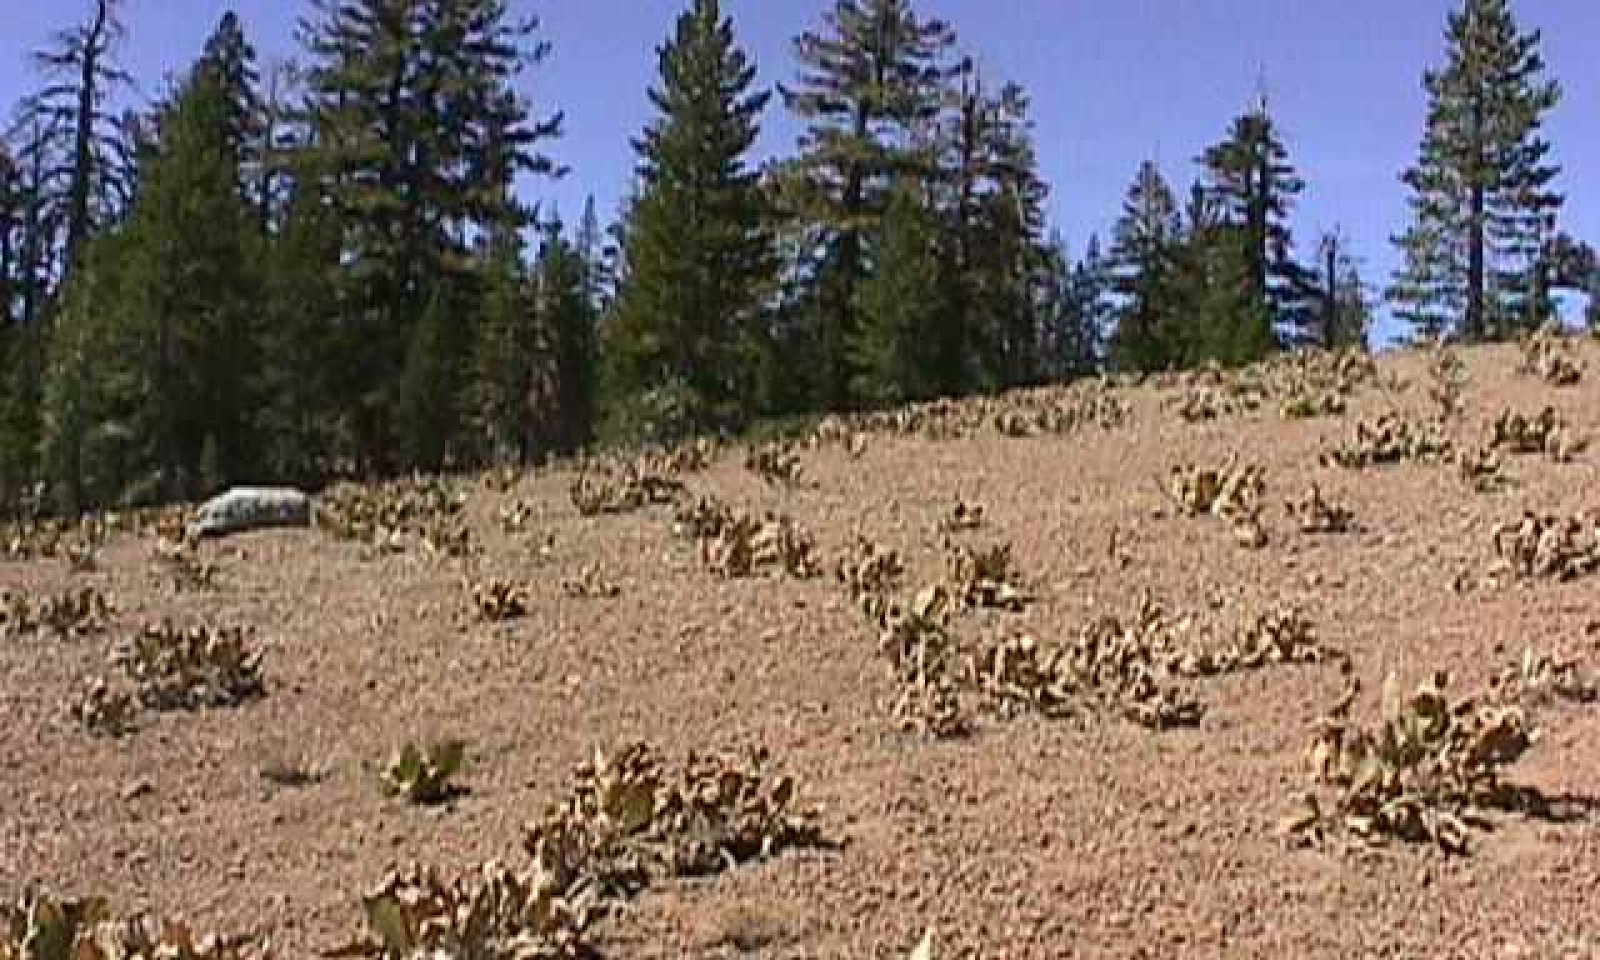
This site occurs on linear to convex mountain summits and sideslopes. Slopes range from 8 to 75 percent, but slope gradients of 8 to 30 percent are most typical. Elevations are 8000 to over 10000 feet.
Table 2. Representative physiographic features
Landforms (1) Mountain slope
(2) Mountain
Flooding frequency None Ponding frequency None Elevation 8000 – 10000 ft Slope 8 – 75 % Ponding depth 0 in Water table depth 0 in Aspect Aspect is not a significant factor Climatic features
The climate on this site is subhumid-continental, characterized by cold, moist winters, and cool dry summers. The average annual precipitation ranges from 20 to over 40 inches, mostly occurring as snow. The linear to convex slope shape associated with this site cause much of the precipitation to be removed from the site because of wind action, thus reducing the moisture available for plant growth. The mean annual air temperature ranges from 36 to 39 degrees F. The average frost free growing season is 30 to 70 days.
Table 3 Representative climatic features
Frost-free period (average) 60 days Freeze-free period (average) 0 days Precipitation total (average) 50 in BarLineFigure 1. Monthly precipitation range
BarLineFigure 2. Monthly average minimum and maximum temperature
">Influencing water features
There are no influencing water features associated with this site.
Soil features
The soils that support this ecological site are typically very shallow and are well drained. They formed in residuum and colluvium derived from volcanic rocks. Surface and subsurface layers are moderately coarse textured and have greater than 65 percent rock fragments. Hard volcanic bedrock occurs within a depth of 14 inches, which limits rooting depth and the available water holding capacity. The soil series associated with this site are Lithnip. The soil families associated with this site are Grandridge inclusion, Hawkridge inclusion, Lithnip inclusion, Conway inclusion and Typic Cryorthents.
Table 4. Representative soil features
Parent material (1) Residuum – volcanic breccia
Surface texture (1) Extremely gravelly sandy loam
Family particle size (1) Loamy
Drainage class Well drained Permeability class Moderately rapid Soil depth 4 – 10 in Surface fragment cover <=3" 4 – 70 % Surface fragment cover >3" 0 – 10 % Available water capacity
(0-40in)0.2 – 0.3 in Calcium carbonate equivalent
(0-40in)Not specified Electrical conductivity
(0-40in)Not specified Sodium adsorption ratio
(0-40in)Not specified Soil reaction (1:1 water)
(0-40in)6.1 – 7.3 Subsurface fragment volume <=3"
(Depth not specified)35 – 80 % Subsurface fragment volume >3"
(Depth not specified)0 – 20 % Ecological dynamics
The site productivity is quite variable depending on differences in soil depths, amount of associated, exposed bedrock, and surface rock fragments.
Fire Ecology:
Moderately severe or severe fires top-kill mules-ears. Mules-ears density generally increases after rangeland fires.
State and transition model
More interactive model formats are also available. View Interactive Models
Click on state and transition labels to scroll to the respective textEcosystem states
State 1 submodel, plant communities
State 1
Reference StateCommunity 1.1
Reference Plant Community
The reference plant community is characterized by an open canopy of perennial forbs. The representative plant community is dominated by mule-ears and a variety of other forbs. Mountain big sagebrush, low sagebrush, Letterman's needlegrass, western needlegrass and bottlebrush squirreltail are other species associated with this site. Potential vegetative composition is about 5% grasses, 90% forbs and 5% shrubs. Approximate ground cover (basal and crown) is 5 to 15 percent.
Figure 3. Annual production by plant type (representative values) or group (midpoint values)
Table 5. Annual production by plant type
Plant type Low
(lb/acre)Representative value
(lb/acre)High
(lb/acre)Forb 67 315 585 Grass/Grasslike 4 18 33 Shrub/Vine 4 17 32 Total 75 350 650 Additional community tables
Table 6. Community 1.1 plant community composition
Group Common name Symbol Scientific name Annual production () Foliar cover (%) Grass/Grasslike1 Secondary Perennnial Grasses 7–28 Letterman's needlegrass ACLE9 Achnatherum lettermanii 2–11 – western needlegrass ACOCO Achnatherum occidentale ssp. occidentale 2–11 – mountain brome BRMA4 Bromus marginatus 2–11 – squirreltail ELEL5 Elymus elymoides 2–11 – Forb2 Primary Perennial Forbs 175–210 mule-ears WYAM Wyethia amplexicaulis 175–210 – 3 Secondary Perennial Forbs 53–105 milkvetch ASTRA Astragalus 2–18 – sego lily CANU3 Calochortus nuttallii 2–18 – desertparsley LOMAT Lomatium 2–18 – lupine LUPIN Lupinus 2–18 – phlox PHLOX Phlox 2–18 – mock goldenweed STENO7 Stenotus 2–18 – Shrub/Vine4 Primary Shrubs 18–53 mountain monardella MOOD Monardella odoratissima 18–53 – 5 Secondary Shrubs 7–35 Utah serviceberry AMUT Amelanchier utahensis 4–11 – little sagebrush ARAR8 Artemisia arbuscula 4–11 – mountain big sagebrush ARTRV Artemisia tridentata ssp. vaseyana 4–11 – antelope bitterbrush PUTR2 Purshia tridentata 4–11 – currant RIBES Ribes 4–11 – mountain snowberry SYOR2 Symphoricarpos oreophilus 4–11 – Interpretations
Animal community
Livestock Interpretations:
This site is poorly suited to livestock grazing due to the steep slopes and low forage production. Sheep forage new mulesear leaves in the spring and early summer. Mature foliage is coarse and harsh, and plants dry out by mid-summer, so it is little used after early summer. Mule deer and all classes of livestock eat mulesear flower heads.
Stocking rates vary over time depending upon season of use, climate variations, site, and previous and current management goals. A safe starting stocking rate is an estimated stocking rate that is fine tuned by the client by adaptive management through the year and from year to year.
Wildlife Interpretations:
Mule deer prefer mules-ears early in the growing season. Mule deer and all classes of livestock eat the flower heads. Mules-ears often forms dense stands and may provide good cover for birds and small mammals.Hydrological functions
Runoff is very high. Permeability is moderately rapid.
Recreational uses
Hiking is the main recreation in this area.
Other products
Native Americans fermented the roots of mules-ears for 2 days in a pit heated with hot stones to make a sweet flavored food.
Other information
Mules-ears forms dense cover and its well-developed root system aids in preventing erosion. Mules-ears may be useful in revegetating mine spoils.
Supporting information
Type locality
Location 1: Alpine County, CA Latitude 38° 39′ 10″ Longitude 119° 55′ 42″ General legal description Toiyabe National Forest. Other references
Fire Effects Information System (Online; http://www.fs.fed.us/database/feis/plants/).
USDA-NRCS Plants Database (Online; http://plants.usda.gov/).Contributors
ALC/GKB
Rangeland health reference sheet
Interpreting Indicators of Rangeland Health is a qualitative assessment protocol used to determine ecosystem condition based on benchmark characteristics described in the Reference Sheet. A suite of 17 (or more) indicators are typically considered in an assessment. The ecological site(s) representative of an assessment location must be known prior to applying the protocol and must be verified based on soils and climate. Current plant community cannot be used to identify the ecological site.
Author(s)/participant(s) Contact for lead author Date Approved by Approval date Composition (Indicators 10 and 12) based on Annual Production Indicators
-
Number and extent of rills:
-
Presence of water flow patterns:
-
Number and height of erosional pedestals or terracettes:
-
Bare ground from Ecological Site Description or other studies (rock, litter, lichen, moss, plant canopy are not bare ground):
-
Number of gullies and erosion associated with gullies:
-
Extent of wind scoured, blowouts and/or depositional areas:
-
Amount of litter movement (describe size and distance expected to travel):
-
Soil surface (top few mm) resistance to erosion (stability values are averages - most sites will show a range of values):
-
Soil surface structure and SOM content (include type of structure and A-horizon color and thickness):
-
Effect of community phase composition (relative proportion of different functional groups) and spatial distribution on infiltration and runoff:
-
Presence and thickness of compaction layer (usually none; describe soil profile features which may be mistaken for compaction on this site):
-
Functional/Structural Groups (list in order of descending dominance by above-ground annual-production or live foliar cover using symbols: >>, >, = to indicate much greater than, greater than, and equal to):
Dominant:
Sub-dominant:
Other:
Additional:
-
Amount of plant mortality and decadence (include which functional groups are expected to show mortality or decadence):
-
Average percent litter cover (%) and depth ( in):
-
Expected annual annual-production (this is TOTAL above-ground annual-production, not just forage annual-production):
-
Potential invasive (including noxious) species (native and non-native). List species which BOTH characterize degraded states and have the potential to become a dominant or co-dominant species on the ecological site if their future establishment and growth is not actively controlled by management interventions. Species that become dominant for only one to several years (e.g., short-term response to drought or wildfire) are not invasive plants. Note that unlike other indicators, we are describing what is NOT expected in the reference state for the ecological site:
-
Perennial plant reproductive capability:
Print Options
Sections
Font
AAAAOther
PrintThe Ecosystem Dynamics Interpretive Tool is an information system framework developed by the USDA-ARS Jornada Experimental Range, USDA Natural Resources Conservation Service, and New Mexico State University.
Accessibility statement


