
Natural Resources
Conservation Service
Ecological site F019XI201CA
Pinus torreyana var. insularis/Nassella pulchra
21-31" p.z.
Accessed: 08/19/2026
-
Search


Major Land Resource Area or ecological site by name and/or ID.
PreviousSectionsNextGeneral information
Draft. A draft ecological site description is either incomplete or has not undergone quality control and quality assurance review.
Table 1. Dominant plant species
Tree (1) Pinus torreyana var. insularis
Shrub Not specified
Herbaceous (1) Nassella pulchra
Physiographic features
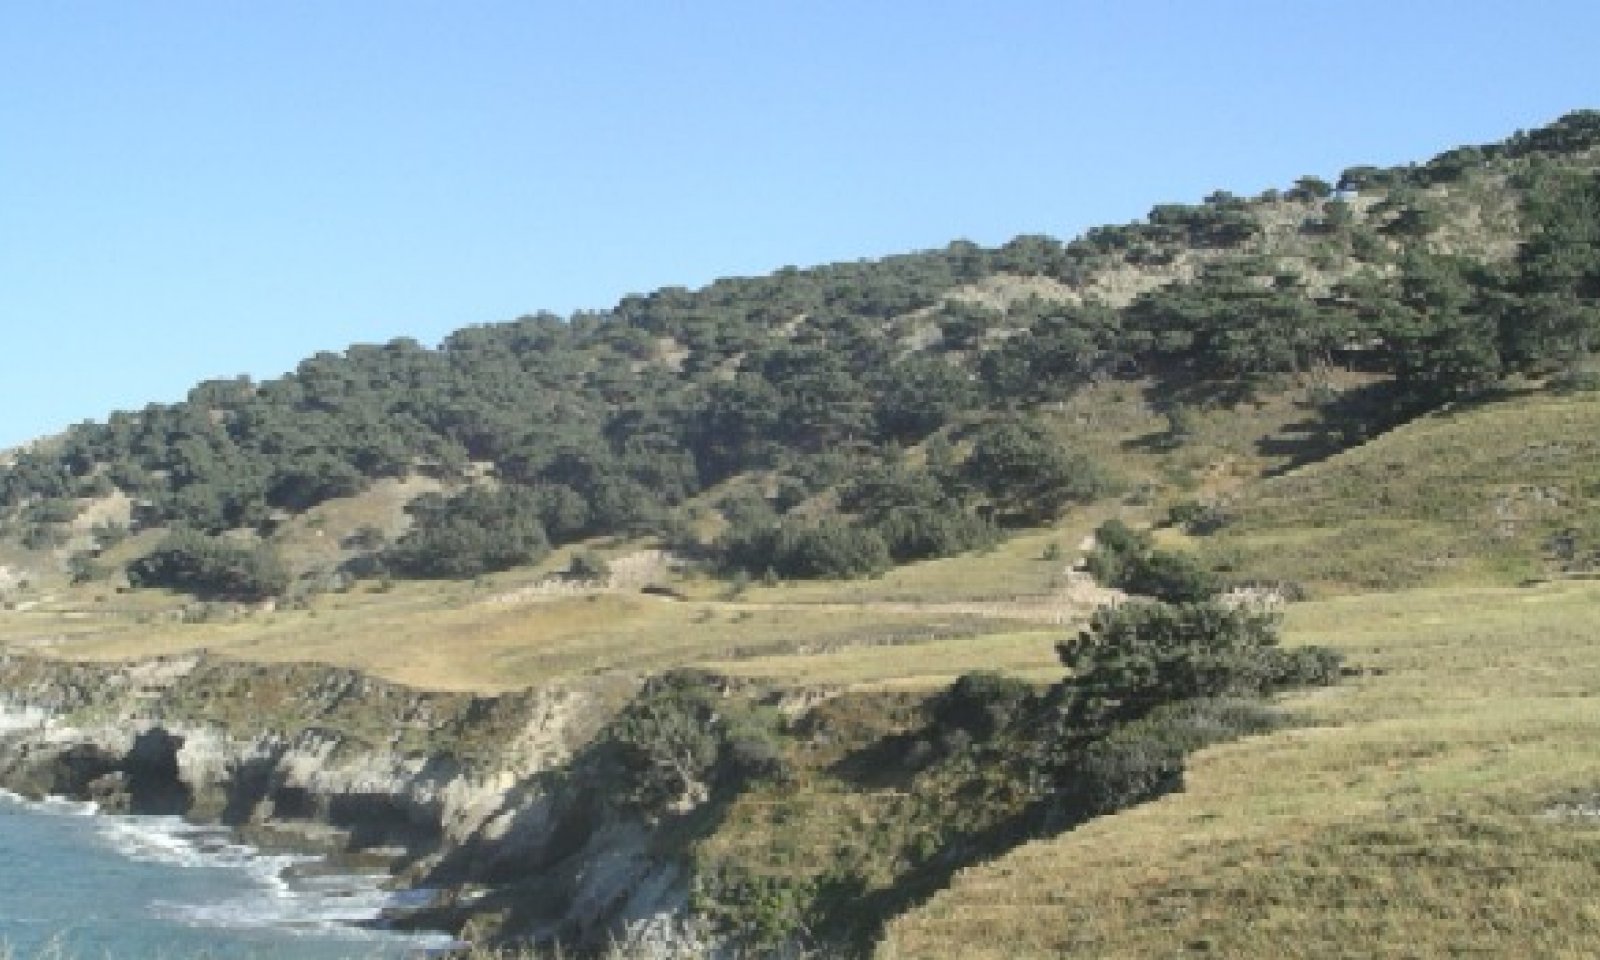
This ecological site is found only on Santa Rosa Island, on north-facing slopes ranging from 30 to 75 percent. Elevations range from just above 328 to 1476 feet.
Table 2. Representative physiographic features
Landforms (1) Hill
Elevation 328 – 1476 ft Slope 30 – 75 % Aspect N, NE, NW Climatic features
This ecological site is found only on Santa Rosa Island. The average annual precipitation is 26 inches with a range between 21 and 31 inches, mostly in the form of rain in the winter months (November through April). The average annual air temperature is approximately 61 to 66 degrees Fahrenheit, and the frost-free (>32F) season is 355 to 365 days.
Table 3 Representative climatic features
Frost-free period (average) 370 days Freeze-free period (average) 370 days Precipitation total (average) 30 in BarLineFigure 1. Monthly precipitation range
BarLineFigure 2. Monthly average minimum and maximum temperature
">Influencing water features
Soil features
Table 4. Representative soil features
Surface texture (1) Gravelly loamy sand
(2) Very gravelly loam
Family particle size (1) Sandy
Drainage class Well drained to somewhat excessively drained Permeability class Moderately slow to moderate Soil depth 4 – 39 in Available water capacity
(0-40in)0.4 – 1.2 in Electrical conductivity
(0-40in)Not specified Sodium adsorption ratio
(0-40in)Not specified Soil reaction (1:1 water)
(0-40in)4 – 7.3 Subsurface fragment volume <=3"
(Depth not specified)10 – 40 % Ecological dynamics
This ecological site is dominated by an overstory of Santa Rosa Island Torrey pines (Pinus torreyana var. insularis) and very little understory. California live oak (Quercus agrifolia), purple tussockgrass (Nassella pulchra), and roundfruit sedge (Carex globosa) can occur with in areas with a more open overstory.
Torrey pine stands only occur naturally in two places, the Torrey Pines State Reserve (TPSR) and on Santa Rosa Island. It is the smallest natural population of any known Pinus species and has very little genetic diversity. Both the mainland and island populations of Torrey pine (Pinus torreyana and P. torreyana var. insularis) occur along the tops of steep, erodible, coastal cliffs where summer fogs are frequent (Cole 2000).
Grazing has been the most significant disturbance in the Santa Rosa Island Torrey pine community. During the mid 1800s and the early 1900s the Channel Islands were heavily impacted by grazing from sheep, goats, cattle, horses, and pigs. Livestock may have been brought to Santa Rosa Island as early as 1805. The first cattle were brought to Santa Cruz Island in 1830 to support 100 exiled Mexican convicts. Ranching began in 1839 with the first private land owner, Andres Castillero. By 1853 the Santa Cruz Island Ranch had a good reputation for its well-bred, healthy Merino sheep. The sheep population steadily increased as they began to roam wild. Their population was estimated to be over 50,000 between 1870 and 1885, and up to 100,000 by 1890. In 1939, as a response to their detrimental effects to the island, 35,000 sheep were rounded up for sale to the mainland and efforts began to eliminate the sheep. An estimated 180,000 sheep were shot during the 1960s and 1970s. In 1987 The Nature Conservancy became the sole owner of the western 90 percent of Santa Cruz Island. They continued to eliminate the sheep, and also began removing cattle from the island. Pigs were reportedly introduced to the island in 1853, and by 1854 became feral shortly after. They are actively being removed however, as part of a large-scale island restoration project. And by 2011, the National Park Service has plans to ensure all large herbivores will be removed from the Channel Islands completely.
Browsing by cattle, elk and deer over the last 140 years has negatively impacted the Torrey pine saplings, as well as reduced the understory of this community to mostly isolated patches of California live oak (Quercus agrifolia) and annual grasses (Wells and Getis 1999). Most of the browsing occurred at the apical buds and terminal nodes, and consequently vertical growth was suppressed, while stimulating vigorous lateral growth instead. This created some trees that were 25 years old and only 1.45 m tall (Wells and Getis 1999). However, once the lateral growth became dense enough to hide the apical buds and terminal nodes from browsing herbivores, vertical growth was able to occur again, although the size and age of the trees may be highly varied due to this grazing pressure.
Prior to grazing in the Torrey pines, this community was frequently exposed to fires. Before 1850, fire scars were formed approximately every 20 to 30 years, however since 1850, no new fire scars have formed (Wells and Getis 1993). Since new saplings are still found in the torrey pine understory, it is likely that this community does not require fire disturbance for regeneration, however fires probably were best for stimulating the establishment torrey pine seedlings (Esser 1993).
There is not enough information to determine the ecological process of this community, or to describe the plant composition after disturbance.
State and transition model
More interactive model formats are also available. View Interactive Models
Click on state and transition labels to scroll to the respective textEcosystem states
State 1 submodel, plant communities
State 1
Torrey Pine WoodlandCommunity 1.1
Torrey Pine Woodland
Figure 3. Torrey Pine Woodland
This is the reference community for this ecological site. This plant community is dominated by Torrey pine (Pinus torreyana var. insularis). Canopy cover ranges from 40 to 70 percent. The forests tends to be dense in patches, with large open areas between. There is very little plant diverisity in areas with high tree cover. Under the canopy the cover of leaf litter is between 70 to 80%, and roundfruit sedge (Carex globosa), bluedicks (Dichelostemma capitatum), and young Torrey pines are present with low cover. The open areas have more diversity with plants such as California live oak (Quercus agrifolia), chamise (Adenostoma fasciculatum), and purple needlegrass (Nassella pulchra) present.
Table 5. Soil surface cover
Tree basal cover 0% Shrub/vine/liana basal cover 0% Grass/grasslike basal cover 0% Forb basal cover 0% Non-vascular plants 0% Biological crusts 0% Litter 80-100% Surface fragments >0.25" and <=3" 0-10% Surface fragments >3" 0-0% Bedrock 0% Water 0% Bare ground 0-30% Additional community tables
Table 6. Community 1.1 plant community composition
Group Common name Symbol Scientific name Annual production () Foliar cover (%) Interpretations
Animal community
The seeds of the Santa Rosa Island Torrey pine (Pinus torreyana var. insularis) are eaten by birds, rodents, and other mammals (Esser 1993).
Other products
Torrey pines are widely planted as an ornamental and have been evaluated as a commercial species in Kenya, Australia, and New Zealand (Esser 1993).
Other information
Torrey pines are planted on wildlands and disturbed sites near Point Loma, San Diego, where they provide wildlife habitats and protect existing coastal sage scrub shrubs (Esser 1993).
Supporting information
Inventory data references
The NRCS plot SRV-6 was used to describe this ecological site.
Type locality
Location 1: Santa Barbara County, CA UTM zone N UTM northing 3764331 UTM easting 775166 General legal description The site location is in the Santa Rosa Torrey pine forest. Other references
Biondi, F., D.R. Cayan, and W.H. Berger. 1997. Dendroclimatology of Torrey Pine (Pinus torreyana Parry ex Carr.). The American Midland Naturalist. Volume 138 (2): 237-251.
Cole, K.L. and G. Liu. 1994. Holocene Paleoecology of an Estuary on Santa Rosa Island, California. Quaternary Research. Volume 41: 326-335.
Cole, K.L. and E. Wahl. 2000. A Late Holocene Paleoecological Record from Torrey Pines State Reserve, California. Quaternary Research. Volume 53: 341-351.
Esser, L.L. 1993. Pinus torreyana. In: Fire Effects Information System, [Online] U.S. Department of Agriculture, Forest Service, Rocky Mountain Research Station, Fire Sciences Laboratory (Producer). Available: http://www.fs.fed.us/database;feis/ [2006, January 6].
Haller, J.R. 1986. Taxonomy and Relationships of the Mainland and Island Populations of Pinus torreyana (Pinaceae). Systematic Botany. Volume 11 (1): 39-50.
Wells, M.L. and A. Getis. 1999. The spatial characteristics of stand structure in Pinus torreyana. Plant Ecology. Volume 143: 153-170.
Rangeland health reference sheet
Interpreting Indicators of Rangeland Health is a qualitative assessment protocol used to determine ecosystem condition based on benchmark characteristics described in the Reference Sheet. A suite of 17 (or more) indicators are typically considered in an assessment. The ecological site(s) representative of an assessment location must be known prior to applying the protocol and must be verified based on soils and climate. Current plant community cannot be used to identify the ecological site.
Author(s)/participant(s) Contact for lead author Date Approved by Approval date Composition (Indicators 10 and 12) based on Annual Production Indicators
-
Number and extent of rills:
-
Presence of water flow patterns:
-
Number and height of erosional pedestals or terracettes:
-
Bare ground from Ecological Site Description or other studies (rock, litter, lichen, moss, plant canopy are not bare ground):
-
Number of gullies and erosion associated with gullies:
-
Extent of wind scoured, blowouts and/or depositional areas:
-
Amount of litter movement (describe size and distance expected to travel):
-
Soil surface (top few mm) resistance to erosion (stability values are averages - most sites will show a range of values):
-
Soil surface structure and SOM content (include type of structure and A-horizon color and thickness):
-
Effect of community phase composition (relative proportion of different functional groups) and spatial distribution on infiltration and runoff:
-
Presence and thickness of compaction layer (usually none; describe soil profile features which may be mistaken for compaction on this site):
-
Functional/Structural Groups (list in order of descending dominance by above-ground annual-production or live foliar cover using symbols: >>, >, = to indicate much greater than, greater than, and equal to):
Dominant:
Sub-dominant:
Other:
Additional:
-
Amount of plant mortality and decadence (include which functional groups are expected to show mortality or decadence):
-
Average percent litter cover (%) and depth ( in):
-
Expected annual annual-production (this is TOTAL above-ground annual-production, not just forage annual-production):
-
Potential invasive (including noxious) species (native and non-native). List species which BOTH characterize degraded states and have the potential to become a dominant or co-dominant species on the ecological site if their future establishment and growth is not actively controlled by management interventions. Species that become dominant for only one to several years (e.g., short-term response to drought or wildfire) are not invasive plants. Note that unlike other indicators, we are describing what is NOT expected in the reference state for the ecological site:
-
Perennial plant reproductive capability:
Print Options
Sections
Font
AAAAOther
PrintThe Ecosystem Dynamics Interpretive Tool is an information system framework developed by the USDA-ARS Jornada Experimental Range, USDA Natural Resources Conservation Service, and New Mexico State University.
Accessibility statement


