Natural Resources
Conservation Service
Ecological site F018XI207CA
Deep Volcanic Plateaus and Hills
Last updated: 4/24/2024
Accessed: 09/01/2026
-
Search
Major Land Resource Area or ecological site by name and/or ID.
PreviousSectionsNextGeneral information
Provisional. A provisional ecological site description has undergone quality control and quality assurance review. It contains a working state and transition model and enough information to identify the ecological site.
MLRA notes
Major Land Resource Area (MLRA): 018X–Sierra Nevada Foothills
Major Land Resource Area (MLRA) 18, Sierra Nevada Foothills is located entirely in California and runs north to south adjacent to and down-slope of the west side of the Sierra Nevada Mountains (MLRA 22A). MLRA 18 includes rolling to steep dissected hills and low mountains, with several very steep river valleys. Climate is distinctively Mediterranean (xeric soil moisture regime) with hot, dry summers, and relatively cool, wet winters. Most of the precipitation comes as rain; average annual precipitation ranges from 15 to 55 inches in most of the area (precipitation generally increases with elevation and from south to north). Soil temperature regime is thermic; mean annual air temperature generally ranges between 52 and 64 degrees F. Geology is rather complex in this region; there were several volcanic flow and ashfall events, as well as tectonic uplift, during the past 25 million years that contributed to the current landscape.
LRU notes
This LRU (designated XI) is located on moderate to steep hills in the Sierra Nevada Foothills east of Sacramento, Stockton, and Modesto, CA. Various geologies occur in this region: metavolcanics, granodiorite, slate, marble, argillite, schist and quartzite, as well as ultramafic bands to a limited and localized extent. It includes mesa formations from volcanic flows, where vernal pool habitats occur. Soil temperature regime is thermic and soil moisture regime is xeric. Elevation ranges between 300 and 3400 feet above sea level. Precipitation ranges from 14 to 42 inches annually. Most precipitation falls between the months of November and March in the form of rain. Dominant vegetation includes annual grasslands, blue oak (Quercus douglasii), interior live oak (Quercus wislizeni), chamise (Adenostoma fasciculatum), buckbrush (Ceanothus cuneatus), and foothill pine (Pinus sabiniana).
Classification relationships
CLASSIFICATION RELATIONSHIPS
This site is located within M261F, the Sierra Nevada Foothills Section, (McNab et al., 2007) of the National Hierarchical Framework of Ecological Units (Cleland et al., 1997), M261Fb, the Lower Foothills Metamorphic Belt Subsection.
Level III and Level IV ecoregions systems (Omernik, 1987, and EPA, 2011) are: Level III, Central California Foothills and Coastal Mountains and Level IV, Ecoregion 6b, Northern Sierran Foothills, Ecoregion 6c, Comanche Terraces.Ecological site concept
This site is found on strongly sloping to moderately steep hills and nearly level plateaus. It occurs on colluvium-dominated backslopes and footslopes, skirting volcanic ridge formations, and in deep bedrock fractures on top of the plateaus. Slope class ranges from 3 to 45%. Mean annual precipitation typically ranges from 25 to 29 inches.
Deeper soils on side slopes or in fractures allow for establishment of woody vegetation and overstory canopy trees in contrast to the surrounding shallow soils with indurated volcanic bedrock. The main soil components associated with this ecological site are Angelscreek and Miltonhills. Angelscreek soils are very deep, loamy-skeletal, isotic, thermic Pachic Ultic Haploxerolls. Miltonhills soils are moderately deep, coarse-loamy, mixed, superactive, thermic Typic Humixerepts
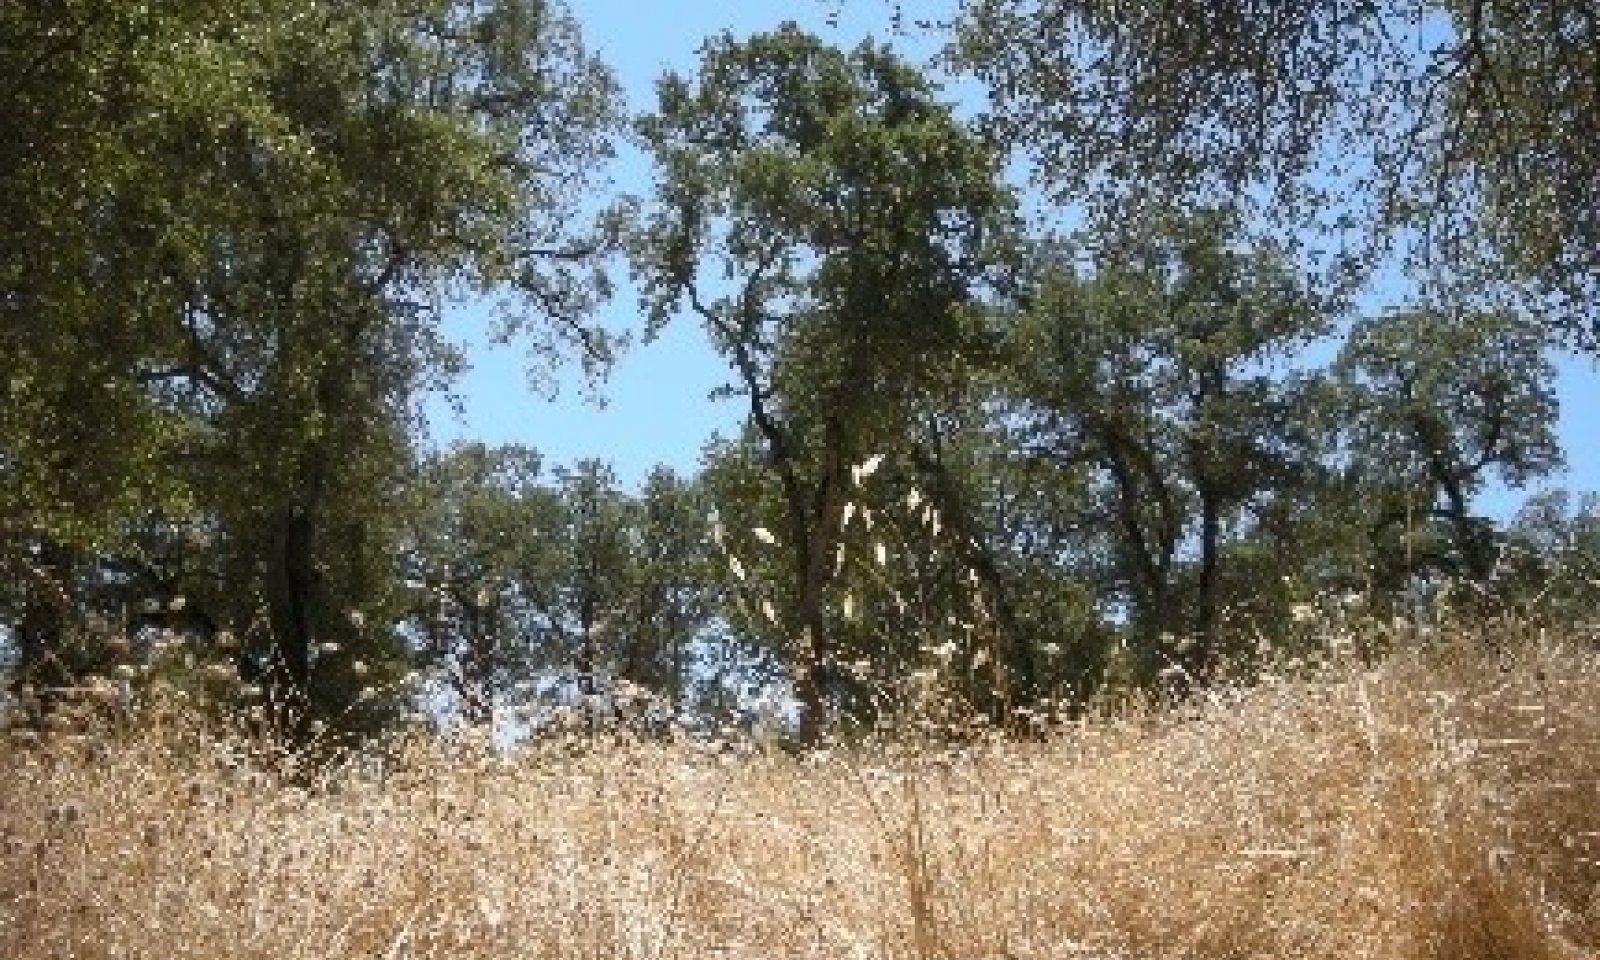
Vegetation includes open oak woodland with annual herbaceous plants in the understory. Blue oak (Quercus douglasii) tends to be dominant in the overstory component. Scattered interior live oak (Quercus wislizeni) and California foothill pine (Pinus sabiniana) can also occur. Forbs and annual grasses generally exceed 50% canopy cover.Associated sites
R018XI007CA Loamy Foothills
This site commonly occurs nearby.
Similar sites
F018XI206CA Clayey Thermic Marble Hills
Site relationships being developed.
Table 1. Dominant plant species
Tree (1) Quercus douglasii
(2) Quercus wislizeniShrub Not specified
Herbaceous (1) Bromus diandrus
(2) Bromus hordeaceusPhysiographic features
This site occurs on nearly level plateaus to moderately steep hills with slopes generally ranging from 3-45% and elevations from 350 to 2000 ft.
Table 2. Representative physiographic features
Landforms (1) Foothills > Lava plateau
(2) Foothills > Lahar
(3) Foothills > Ridge
(4) Foothills > Hill
Runoff class Medium Flooding frequency None Ponding frequency None Elevation 350 – 2000 ft Slope 3 – 45 % Aspect Aspect is not a significant factor Table 3. Representative physiographic features (actual ranges)
Runoff class Medium Flooding frequency None Ponding frequency None Elevation 120 – 2600 ft Slope 2 – 60 % Climatic features
This ecological site is characterized by hot, dry summers and cool, wet winters, a typical Mediterranean climate. Mean annual precipitation ranges from 25 to 29 inches and usually falls from October to May. Mean annual temperature is 59 to 64 degrees F with 234 to 332 frost free days.
Table 4 Representative climatic features
Frost-free period (characteristic range) 230-330 days Freeze-free period (characteristic range) 370 days Precipitation total (characteristic range) 30-30 in Frost-free period (actual range) 210-360 days Freeze-free period (actual range) 370 days Precipitation total (actual range) 20-30 in Frost-free period (average) 280 days Freeze-free period (average) 370 days Precipitation total (average) 30 in Characteristic rangeActual rangeBarLineFigure 1. Monthly precipitation range
Characteristic rangeActual rangeBarLineFigure 2. Monthly minimum temperature range
Characteristic rangeActual rangeBarLineFigure 3. Monthly maximum temperature range
BarLineFigure 4. Monthly average minimum and maximum temperature
Figure 5. Annual precipitation pattern
Figure 6 Annual average temperature pattern
Climate stations used
-
(1) NEW MELONES DAM HQ [USC00046174], Angels Camp, CA
-
(2) CAMP PARDEE [USC00041428], Valley Springs, CA
">Influencing water features
Due to the topographic position, this site does not have water features or wetlands.
Wetland description
N/A
Soil features
The soils in this ecological site are formed from the colluvium and residuum of volcanic rocks such as latite, agglomerate and/or tuff. Depth ranges vary from moderately to very deep, the particle size control sections are coarse-loamy to loamy-skeletal. Surface textures include loams, fine sandy loams, gravelly loams, gravelly sandy loams and very stony loams. The bedrock is a restrictive layer found between 24 and 50 inches of depth. Gravels (< 3 inch diameter) range between 0 to 7% cover, while larger fragments (= 3 inch diameter) are 0 to 15% cover. Subsurface gravels range between 4 to 32% and larger fragments occupy 0 to 32% by volume. The soils in this ecological site are well drained and the permeability class ranges from moderately slow to moderately rapid. The Available Water Capacity (AWC) ranges from 3.3 to 6.1 inches. The pH of the top 10 inches of the soil is between 5.8 and 6.4, while the pH of the subsurface ranges from 5.4 to 6.3.
The main soil components associated with this ecological site are Angelscreek and Miltonhills. Angelscreek soils are very deep, loamy-skeletal, isotic, thermic Pachic Ultic Haploxerolls. Miltonhills soils are moderately deep, coarse-loamy, mixed, superactive, thermic Typic Humixerepts.Table 5. Representative soil features
Parent material (1) Colluvium – tuff breccia
(2) Residuum – tuff breccia
(3) Colluvium – latite
(4) Colluvium – volcanic rock
Surface texture (1) Loam
(2) Fine sandy loam
(3) Gravelly loam
(4) Gravelly sandy loam
Family particle size (1) Coarse-loamy
(2) Loamy-skeletal
Drainage class Well drained Permeability class Moderately slow to moderately rapid Depth to restrictive layer 24 – 50 in Soil depth 24 – 50 in Surface fragment cover <=3" 0 – 7 % Surface fragment cover >3" 0 – 15 % Available water capacity
(0-40in)3.3 – 6.1 in Soil reaction (1:1 water)
(0-10in)5.8 – 6.4 Subsurface fragment volume <=3"
(0-60in)4 – 32 % Subsurface fragment volume >3"
(0-60in)0 – 32 % Table 6. Representative soil features (actual values)
Drainage class Well drained Permeability class Moderately slow to moderately rapid Depth to restrictive layer 20 – 60 in Soil depth 20 – 60 in Surface fragment cover <=3" 0 – 25 % Surface fragment cover >3" 0 – 45 % Available water capacity
(0-40in)0.9 – 8.8 in Soil reaction (1:1 water)
(0-10in)4.6 – 7.3 Subsurface fragment volume <=3"
(0-60in)0 – 60 % Subsurface fragment volume >3"
(0-60in)0 – 69 % Ecological dynamics
State and transition model
Custom diagramStandard diagramMore interactive model formats are also available. View Interactive Models
Click on state and transition labels to scroll to the respective textEcosystem states
State 1 submodel, plant communities
State 2 submodel, plant communities
State 3 submodel, plant communities
State 1
Representative State (Blue oak/ live oak woodland)Community 1.1
Representative plant community
Open QUDO/ interior live oak/ PISA2 woodlands (~ 50% canopy cover). Shrubs such as CECU, AECA, TODI, HEAR5, or ARCTO3 may be present. Dense annual grasses and forbs in understory.
Community 1.2
Post-fire plant community
QUDO cover is ~ 25% with multiple age classes (yet very little regeneration). Low cover of QUWI2. Shrubs usually absent, but seed source generally nearby. Dense annual grasses and forbs in understory.
Community 1.3
QUDO recruitment community
Dominated by younger cohort of smaller QUDO (5-13 feet tall), Early phases will be dominated by seedlings. Shrub layer may play key role in this phase.
Pathway 1.1a
Community 1.1 to 1.2
Representative plant community
Post-fire plant communityThis community pathway occurs when a high severity fire removes most of the woody vegetation. Some oaks remain on or near the site. Alternatively, brushing or tree clearing may cause this community pathway.
Pathway 1.1b
Community 1.1 to 1.3
Representative plant community
QUDO recruitment communityThis uncommon community pathway occurs when favorable conditions such as abundant moisture and/or seeds (acorns) etc. cause oak regeneration. Low intensity fire or clearing can also result in a resprouting of oaks.
Pathway 1.2a
Community 1.2 to 1.3
Post-fire plant community
QUDO recruitment communityThis community pathway occurs shortly after CP 1.1a, resulting in profuse sprouting of oak trees, some of which escape herbivory and establish into sapling stage.
Pathway 1.3a
Community 1.3 to 1.1
QUDO recruitment community
Representative plant communityThis community pathway occurs with normal time and growth.
Pathway 1.3b
Community 1.3 to 1.2
QUDO recruitment community
Post-fire plant communityThis community pathway occurs with intense brushing/tree clearing which removes most of woody vegetation.
State 2
Annual Grassland StateCommunity 2.1
Grass-dominated system
This community phase is dominated by annuals. AVFA, BROMU, HORDE, and VULPI make up > 50 % cover.
Community 2.2
Forb-dominated system (Erodium)
This community phase is dominated by annuals. ERODI > 50 % cover
Pathway 2.1a
Community 2.1 to 2.2
Grass-dominated system
Forb-dominated system (Erodium)This community pathway occurs as forbs become more dominant, often following low winter precipitation and reduced litter layers.
Pathway 2.2a
Community 2.2 to 2.1
Forb-dominated system (Erodium)
Grass-dominated systemThis community pathway occurs as grasses become more dominant, often in response to higher litter levels.
State 3
Invasive Annuals StateCommunity 3.1
Invasive grass-dominated
Consists of very open communities with > 25% canopy cover of invasive grasses including TACA8 and AETR.
Community 3.2
Invasive forb-dominated (>25 % CC)
CESO3 or CEME2 dominate the understory.
Pathway 3.1a
Community 3.1 to 3.2
Invasive grass-dominated
Invasive forb-dominated (>25 % CC)This community pathway occurs as invasive forb species become dominant.
Pathway 3.2a
Community 3.2 to 3.1
Invasive forb-dominated (>25 % CC)
Invasive grass-dominatedThis community pathway occurs as invasive grass species become dominant.
Transition T1.a
State 1 to 2This transition occurs after mechanical clearing and/or grazing management that results in loss of oak and acorn (seed) source.
Transition T1.b
State 1 to 3This transition occurs when invasive grasses or forbs become established.
Restoration pathway R2.a
State 2 to 1This restoration pathway occurs with tree planting, often requires shade screens, and seedling protection from browsers to be successful.
Transition T2.a
State 2 to 3This transition occurs after undesirable invasive plants become established.
Restoration pathway R3.a
State 3 to 1This restoration pathway occurs with tree planting, often requires shade screens, and seedling protection from browsers to be successful. This also may require integrated weed management to reduce the seedling’s competition from annual invasive species.
Restoration pathway R3.b
State 3 to 2This restoration pathway occurs with integrated weed management and may require mowing, herbicides, and/or biological control.
Additional community tables
Table 7. Community 1.1 plant community composition
Group Common name Symbol Scientific name Annual production () Foliar cover (%) Table 8. Community 1.2 plant community composition
Group Common name Symbol Scientific name Annual production () Foliar cover (%) Table 9. Community 1.3 plant community composition
Group Common name Symbol Scientific name Annual production () Foliar cover (%) Table 10. Community 2.1 plant community composition
Group Common name Symbol Scientific name Annual production () Foliar cover (%) Table 11. Community 2.2 plant community composition
Group Common name Symbol Scientific name Annual production () Foliar cover (%) Table 12. Community 3.1 plant community composition
Group Common name Symbol Scientific name Annual production () Foliar cover (%) Table 13. Community 3.2 plant community composition
Group Common name Symbol Scientific name Annual production () Foliar cover (%) Interpretations
Supporting information
Inventory data references
Inventory data to be collected using future projects based on priorities.
References
-
Natural Resources Conservation Service. . National Ecological Site Handbook.
Contributors
Dallas Glass
Andy Paolucci
Nathan RoeApproval
Kendra Moseley, 4/24/2024
Rangeland health reference sheet
Interpreting Indicators of Rangeland Health is a qualitative assessment protocol used to determine ecosystem condition based on benchmark characteristics described in the Reference Sheet. A suite of 17 (or more) indicators are typically considered in an assessment. The ecological site(s) representative of an assessment location must be known prior to applying the protocol and must be verified based on soils and climate. Current plant community cannot be used to identify the ecological site.
Author(s)/participant(s) Contact for lead author Date 09/01/2026 Approved by Approval date Composition (Indicators 10 and 12) based on Annual Production Indicators
-
Number and extent of rills:
-
Presence of water flow patterns:
-
Number and height of erosional pedestals or terracettes:
-
Bare ground from Ecological Site Description or other studies (rock, litter, lichen, moss, plant canopy are not bare ground):
-
Number of gullies and erosion associated with gullies:
-
Extent of wind scoured, blowouts and/or depositional areas:
-
Amount of litter movement (describe size and distance expected to travel):
-
Soil surface (top few mm) resistance to erosion (stability values are averages - most sites will show a range of values):
-
Soil surface structure and SOM content (include type of structure and A-horizon color and thickness):
-
Effect of community phase composition (relative proportion of different functional groups) and spatial distribution on infiltration and runoff:
-
Presence and thickness of compaction layer (usually none; describe soil profile features which may be mistaken for compaction on this site):
-
Functional/Structural Groups (list in order of descending dominance by above-ground annual-production or live foliar cover using symbols: >>, >, = to indicate much greater than, greater than, and equal to):
Dominant:
Sub-dominant:
Other:
Additional:
-
Amount of plant mortality and decadence (include which functional groups are expected to show mortality or decadence):
-
Average percent litter cover (%) and depth ( in):
-
Expected annual annual-production (this is TOTAL above-ground annual-production, not just forage annual-production):
-
Potential invasive (including noxious) species (native and non-native). List species which BOTH characterize degraded states and have the potential to become a dominant or co-dominant species on the ecological site if their future establishment and growth is not actively controlled by management interventions. Species that become dominant for only one to several years (e.g., short-term response to drought or wildfire) are not invasive plants. Note that unlike other indicators, we are describing what is NOT expected in the reference state for the ecological site:
-
Perennial plant reproductive capability:
Print Options
Sections
Font
AAAAOther
PrintThe Ecosystem Dynamics Interpretive Tool is an information system framework developed by the USDA-ARS Jornada Experimental Range, USDA Natural Resources Conservation Service, and New Mexico State University.
Accessibility statement