
Natural Resources
Conservation Service
Ecological site F018XI204CA
North-facing Steep Draws and Hillslopes
Last updated: 4/24/2024
Accessed: 09/22/2026
-
Search


Major Land Resource Area or ecological site by name and/or ID.
PreviousSectionsNextGeneral information
Provisional. A provisional ecological site description has undergone quality control and quality assurance review. It contains a working state and transition model and enough information to identify the ecological site.
MLRA notes
Major Land Resource Area (MLRA): 018X–Sierra Nevada Foothills
Major Land Resource Area (MLRA) 18, Sierra Nevada Foothills is located entirely in California and runs north to south adjacent to and down-slope of the west side of the Sierra Nevada Mountains (MLRA 22A). MLRA 18 includes rolling to steep dissected hills and low mountains, with several very steep river valleys. Climate is distinctively Mediterranean (xeric soil moisture regime) with hot, dry summers, and relatively cool, wet winters. Most of the precipitation comes as rain; average annual precipitation ranges from 15 to 55 inches in most of the area (precipitation generally increases with elevation and from south to north). Soil temperature regime is thermic; mean annual air temperature generally ranges between 52 and 64 degrees F. Geology is rather complex in this region; there were several volcanic flow and ashfall events, as well as tectonic uplift, during the past 25 million years that contributed to the current landscape.
LRU notes
This LRU (designated XI) is located on moderate to steep hills in the Sierra Nevada Foothills east of Sacramento, Stockton and Modesto, CA. Various geologies occur in this region: metavolcanics, granodiorite, slate, marble, argillite, schist and quartzite, as well as ultramafic bands to a limited and localized extent. It includes mesa formations from volcanic flows, where vernal pool habitats occur. Soil temperature regime is thermic and soil moisture regime is xeric. Elevation ranges between 300 and 3400 feet above sea level. Precipitation ranges from 14 to 42 inches annually. Most precipitation falls between the months of November and March in the form of rain. Dominant vegetation includes annual grasslands, blue oak (Quercus douglasii), interior live oak (Quercus wislizeni), chamise (Adenostoma fasciculatum), buckbrush (Ceanothus cuneatus), and foothill pine (Pinus sabiniana).
Classification relationships
CLASSIFICATION RELATIONSHIPS
This site is located within M261F, the Sierra Nevada Foothills Section, (McNab et al., 2007) of the National Hierarchical Framework of Ecological Units (Cleland et al., 1997), M261Fb, the Lower Foothills Metamorphic Belt Subsection.
Level III and Level IV ecoregions systems (Omernik, 1987, and EPA, 2011) are: Level III, Central California Foothills and Coastal Mountains and Level IV, Ecoregion 6b, Northern Sierran Foothills, Ecoregion 6c, Comanche Terraces.Ecological site concept
This site is found on steep hills on north-facing aspects on backslopes and footslopes, often in cooler drainages where soil temperatures border mesic. Parent material is generally of metasedimentary or granitic origin. Slopes typically range from 25 to 60%. Mean annual precipitation typically ranges from 32 to 38 inches, and elevation ranges from 1250 to 2000 feet.
Slope aspect is the overriding abiotic factor defining this ecological site, and tends to result in vegetation patterns that mimic those found in higher elevation mesic soil temperature regimes, even in the adjoining MLRA 22A (Sierra Nevada Mountains). The most common soil map unit component by acreage is the Sierra component. This component is a very deep, fine-loamy mixed, active, thermic Ultic Haploxeralf derived from intrusive igneous parent material. This ecological site is not restricted to a specific geology, it also occurs on phyllite, schist, and other metasedimentary soils, especially Deerflat components, which are also very deep.
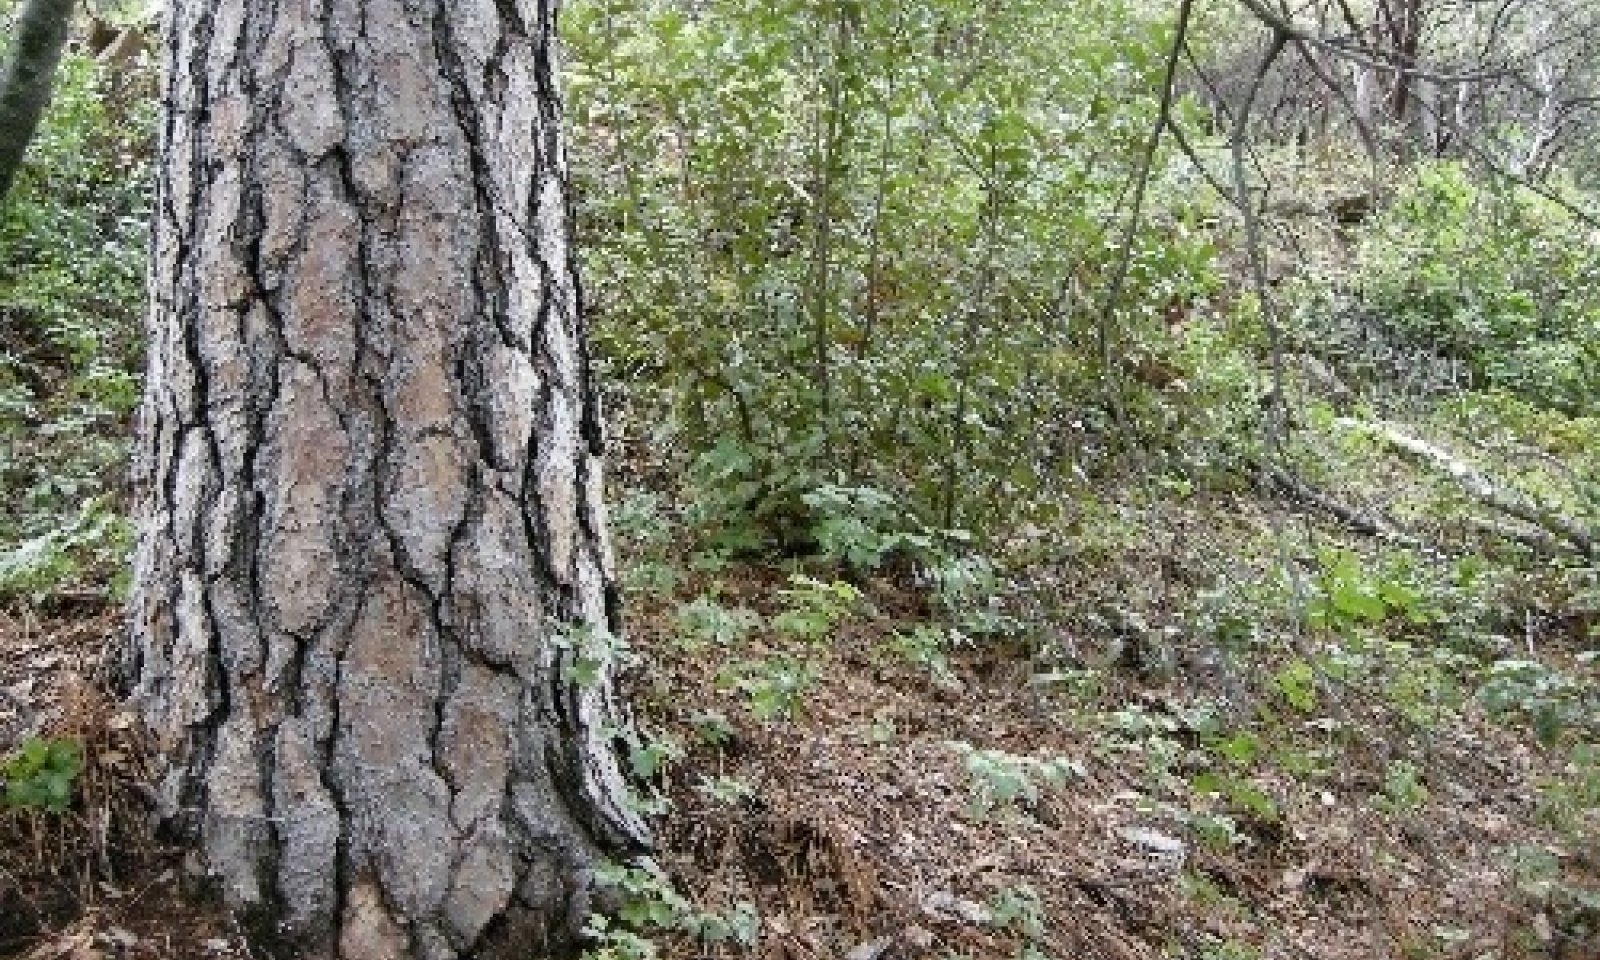
The dominant vegetation in this ecological site consists of dense forests (mean canopy cover ~ 51%) with species such as California black oak (Quercus kelloggii), interior live oak (Quercus wislizeni) and scattered ponderosa pine (Pinus ponderosa). Toyon (Heteromeles arbutifolia), manzanita (Arctostaphylos spp.), dense poison oak (Toxicodendron diversilobum), and sparse to moderately dense herbaceous annual forbs and grasses also occupy this site. This ecological site often hosts native perennial bunch grasses at 0 to 2 % cover. Herbaceous annual production generally makes up less than 2% of total production, and trees/and or shrubs exceed 90% of total annual production.Similar sites
F018XI205CA Thermic Granitic Foothills
Site relationships being developed.
Table 1. Dominant plant species
Tree (1) Quercus kelloggii
(2) Quercus wislizeniShrub (1) Toxicodendron diversilobum
(2) ArctostaphylosHerbaceous (1) Avena fatua
(2) Vicia americanaPhysiographic features
This site occurs on steep backslopes and footslopes on northerly aspects. The slope generally ranges from 25 to 60%. Elevation generally ranges from 1250 to 2000 feet.
Table 2. Representative physiographic features
Hillslope profile (1) Backslope
(2) Footslope
Landforms (1) Foothills > Hill
(2) Foothills > Canyon
Runoff class Medium Flooding frequency None Ponding frequency None Elevation 1250 – 2000 ft Slope 25 – 60 % Aspect NW, N, NE Table 3. Representative physiographic features (actual ranges)
Runoff class Medium Flooding frequency None Ponding frequency None Elevation 800 – 3000 ft Slope 15 – 90 % Climatic features
Mean annual precipitation generally ranges from 32 to 38 inches. The majority of precipitation occurs between December and April. Temperatures range from a normal monthly minimum of 30.5 in December to a normal monthly maximum of 61.5 in July. See MLRA notes and LRU notes for general climate patterns of the area.
Table 4 Representative climatic features
Frost-free period (characteristic range) 160-190 days Freeze-free period (characteristic range) 250-340 days Precipitation total (characteristic range) 30-40 in Frost-free period (actual range) 150-200 days Freeze-free period (actual range) 230-360 days Precipitation total (actual range) 30-40 in Frost-free period (average) 180 days Freeze-free period (average) 290 days Precipitation total (average) 40 in Characteristic rangeActual rangeBarLineFigure 1. Monthly precipitation range
Characteristic rangeActual rangeBarLineFigure 2. Monthly minimum temperature range
Characteristic rangeActual rangeBarLineFigure 3. Monthly maximum temperature range
BarLineFigure 4. Monthly average minimum and maximum temperature
Figure 5. Annual precipitation pattern
Figure 6 Annual average temperature pattern
Climate stations used
-
(1) NEW MELONES DAM HQ [USC00046174], Angels Camp, CA
-
(2) SONORA [USC00048353], Jamestown, CA
-
(3) GROVELAND 2 [USC00043669], Groveland, CA
">Influencing water features
Due to the topographic position, this site does not have water features or wetlands.
Wetland description
N/A
Soil features
The soils correlated to this ecological site are derived from colluvium and residuum weathered from metasedimentary and intrusive igneous rocks. These soils are deep to very deep and have fine-loamy particle size control sections with coarse sandy loam or gravelly loam surface textures. The bedrock is a restrictive layer that may be found in some pedons between 43 and 63 inches of depth. Rock fragments within the soil profile range from 3 to 23% gravels (< 3 inch diameter) and 0 to 1% larger fragments (=> 3 inch diameter). The soils in this ecological site are well drained and permeability is moderate. The Available Water Capacity (AWC) ranges from 5.2 to 6.2 inches and the pH range in the surface is from 5.5 to 6.1 and in the subsoil the pH ranges from 5.7 to 6.
Both Sierra and Deerflat components are fine-loamy mixed, active, thermic Ultic Haploxeralfs. Sierra is deep to very deep and Deerflat is a very deep soil.Table 5. Representative soil features
Parent material (1) Residuum – granitoid
(2) Colluvium – metasedimentary rock
(3) Residuum – metasedimentary rock
(4) Colluvium – granitoid
Surface texture (1) Coarse sandy loam
(2) Gravelly loam
Family particle size (1) Fine-loamy
Drainage class Well drained Permeability class Moderate Soil depth 43 – 63 in Surface fragment cover <=3" Not specified Surface fragment cover >3" Not specified Available water capacity
(0-40in)5.2 – 6.2 in Soil reaction (1:1 water)
(0-10in)5.5 – 6.1 Subsurface fragment volume <=3"
(0-60in)3 – 23 % Subsurface fragment volume >3"
(0-60in)0 – 1 % Table 6. Representative soil features (actual values)
Drainage class Well drained Permeability class Moderately slow to moderate Soil depth 30 – 79 in Surface fragment cover <=3" 0 % Surface fragment cover >3" 0 – 2 % Available water capacity
(0-40in)3.8 – 7.6 in Soil reaction (1:1 water)
(0-10in)5.1 – 7.3 Subsurface fragment volume <=3"
(0-60in)1 – 38 % Subsurface fragment volume >3"
(0-60in)0 – 33 % Ecological dynamics
Community pathways and Transitions
T1.a This transition occurs after decades of little to no disturbance (including management) which results in a build up of fuels. A high severity, stand replacing fire may then trigger an abrupt change to the vegetation composition and structure. Shrubs adapted to the new fire regime, sprout and seed at a much higher rate than the tree component, leading to a shrub chaparral state. Alternatively, drought driven losses of conifers (i.e. western pine beetle) can cause this transition to occur.
T1.b This transition occurs after active brush management and enough browsing/grazing pressure to eliminate the woody vegetation.
1.1a Lack of disturbance, over time shrubs gain greater dominance.
1.1b This community pathway occurs with low to moderately severe fire promoting a sprouting response from trees. Alternatively, mechanical and prescribed burning can lead to an open woodland/pine community.
1.2a This community pathway occurs over time with no management action.
1.3a This community pathway occurs with moderate intensity, often patchy, fire which creates openings where grasses and forbs can populate. Mid canopy layers and shrubs are also reduced. This community pathway also can result with firewood cutting, or shrub clearing.
T2.a This transition occurs after active brush management (and/or failed tree plantings) and enough browsing/grazing pressure to maintain an open shrub free system.
R2.a This restoration pathway occurs after active brush management, chemical treatment, followed up with tree planting.
2.1a This community pathway occurs following a high intensity wildfire.
2.2a This community pathway occurs over time with no management action.
R3.a This restoration pathway occurs with tree planting, often requiring shade screens and seedling protection from browsers to be successful.
3.1a This community pathway occurs as forbs become more dominant, often following low winter precipitation and reduced litter layers.
3.2a This community pathway occurs with ongoing brush management and/or active grazing management.State and transition model
Custom diagramStandard diagramMore interactive model formats are also available. View Interactive Models
Click on state and transition labels to scroll to the respective textEcosystem states
State 1 submodel, plant communities
State 2 submodel, plant communities
State 3 submodel, plant communities
State 1
Representative State (Tree Dominated)Community 1.1
Representative plant community
Dense QUWI2, QUKE and shrubs such as ARCTO3, HEAR5 and TODI. Scattered PISA2 and PIPO (several tall trees with DBH of > 20 inches). Openings between shrubs with annual herbaceous plants.
Community 1.2
Post-fire Regeneration Phase
Shrubs such as ARCTO3, HEAR5, as well as abundant oak sprouting start to fill area (< 4.5 ft tall). PIPO regeneration may be abundant. Forbs and grasses abound in intershrub and tree spaces.
Community 1.3
Tree Shrub/Chaparral Mix
Mid canopy layer of QUWI2 and QUKE. Taller shrubs (> 12 ft) such as HEAR5 and ARCTO3, becoming more prominent. Some larger diameter trees remain but relatively uncommon
Pathway 1.1b
Community 1.1 to 1.2
Representative plant community
Post-fire Regeneration PhaseThis community pathway occurs with low to moderately severe fire promoting a sprouting response from trees. Alternatively, mechanical and prescribed burning can lead to an open woodland/pine community.
Pathway 1.1a
Community 1.1 to 1.3
Representative plant community
Tree Shrub/Chaparral MixLack of disturbance, over time shrubs gain greater dominance.
Pathway 1.2a
Community 1.2 to 1.1
Post-fire Regeneration Phase
Representative plant communityThis community pathway occurs over time with no management action.
Pathway 1.3a
Community 1.3 to 1.1
Tree Shrub/Chaparral Mix
Representative plant communityThis community pathway occurs with moderate intensity, often patchy, fire which creates openings where grasses and forbs can populate. Mid canopy layers and shrubs are also reduced. This community pathway also can result with firewood cutting, or shrub clearing.
State 2
Shrub Chaparral StateCommunity 2.1
Mature shrub chaparral
This community phase is made of ARCTO3, HEAR5, TODI and some QUWI2/QUBE. These shrubs can often exceed hts of 15 ft. Annual herbaceous species relatively sparse.
Community 2.2
Post-fire Community
Community dominated by sprouting shrubs and new seedlings. Annual grasses and forbs abound.
Pathway 2.1a
Community 2.1 to 2.2
Mature shrub chaparral
Post-fire CommunityThis community pathway occurs following a high intensity wildfire.
Pathway 2.2a
Community 2.2 to 2.1
Post-fire Community
Mature shrub chaparralThis community pathway occurs over time with no management action.
State 3
Brushed and Cleared StateCommunity 3.1
Grass-dominated system
This community phase is dominated by annual grasses, such as AVFA, BROMU, HORDE, and VULPI.
Community 3.2
Forb-dominated system
This community phase is dominated by annuals forbs
Pathway 3.1a
Community 3.1 to 3.2
Grass-dominated system
Forb-dominated systemThis community pathway occurs as forbs become more dominant, often following low winter precipitation and reduced litter layers.
Pathway 3.2a
Community 3.2 to 3.1
Forb-dominated system
Grass-dominated systemThis community pathway occurs with ongoing brush management and/or active grazing management.
Transition T1.a
State 1 to 2This transition occurs after decades of little to no disturbance (including management) which results in a build up of fuels. A high severity, stand replacing fire may then trigger an abrupt change to the vegetation composition and structure. Shrubs adapted to the new fire regime, sprout and seed at a much higher rate than the tree component, leading to a shrub chaparral state. Alternatively, drought driven losses of conifers (i.e. western pine beetle) can cause this transition to occur.
Transition T1.b
State 1 to 3This transition occurs after active brush management and enough browsing/grazing pressure to eliminate the woody vegetation.
Restoration pathway R2.a
State 2 to 1This restoration pathway occurs after active brush management, chemical treatment, followed up with tree planting.
Transition T2.a
State 2 to 3This transition occurs after active brush management (and/or failed tree plantings) and enough browsing/grazing pressure to maintain an open shrub free system.
Restoration pathway R3.a
State 3 to 1This restoration pathway occurs with tree planting, often requiring shade screens and seedling protection from browsers to be successful.
Additional community tables
Table 7. Community 1.1 plant community composition
Group Common name Symbol Scientific name Annual production () Foliar cover (%) Table 8. Community 1.2 plant community composition
Group Common name Symbol Scientific name Annual production () Foliar cover (%) Table 9. Community 1.3 plant community composition
Group Common name Symbol Scientific name Annual production () Foliar cover (%) Table 10. Community 2.1 plant community composition
Group Common name Symbol Scientific name Annual production () Foliar cover (%) Table 11. Community 2.2 plant community composition
Group Common name Symbol Scientific name Annual production () Foliar cover (%) Table 12. Community 3.1 plant community composition
Group Common name Symbol Scientific name Annual production () Foliar cover (%) Table 13. Community 3.2 plant community composition
Group Common name Symbol Scientific name Annual production () Foliar cover (%) Interpretations
Supporting information
Inventory data references
Inventory data to be collected using future projects based on priorities.
References
-
Natural Resources Conservation Service. . National Ecological Site Handbook.
Other references
Other References
Abrams, M.D. 1990. Adaptations and responses to drought in Quercus species of North America. Tree Physiology 7(1-4): 227-238.
Bartolome, J. W. 1987. California annual grassland and oak savannah. Rangelands 9:122-125.
Callaway, R.M. 1992. Morphological and physiological responses of three California oak species to shade. International Journal of Plant Science. 153(3): 434-441.
Fites-Kaufman, J., Bradley, A.F. and A.G. Merrill. 2006. Fire and plant interactions. In: Sugihara, N.G., van Wagtendonk, J.W., Shaffer, K.E., Fites-Kaufman, J., Thode, A.E., eds. Fire in California's ecosystems. Berkeley, CA: University of California Press: 94-117.
Fryer, J.L. 2007. Quercus kelloggii. In: Fire Effects Information System (Online) USDA, Forest Service Rocky Mountain Research Station, Fire Sciences Lab (Producer). Accessed: http://www.fs.fed.us/database/feis/[March 22, 2018]
Fryer, J.L. 2012. Quercus wislizeni. In: Fire Effects Information System (Online) USDA, Forest Service Rocky Mountain Research Station, Fire Sciences Lab (Producer). Accessed: http://www.fs.fed.us/database/feis/[March 22, 2018]
Green, L.R. 1980. Prescribed Burning in California Oak Management. In: Plumb, T.R. tech. coordinator. Proceedings of the Symposium on the Ecology, Management, and Utilization of California Oaks; 1979 June 24-26; Claremont, CA. GTR PSW-44 Berkeley, CA: USDA, Forest Service Forest and Range Experiment Station: 136-142.
Habeck, R.J. 1992. Pinus ponderosa var. benthamiana, P. p. var. ponderosa.
In: Fire Effects Information System, [Online]. U.S. Department of Agriculture,
Forest Service, Rocky Mountain Research Station, Fire Sciences Laboratory (Producer).
Available: https://www.fs.fed.us/database/feis/plants/tree/pinponp.all.html
[2018, March 22].
Hickman, J.C., ed. 1993. The Jepson manual: Higher plants of California. Berkeley, CA: University of California Press. 1400 p.
Hickman, G.W., Perry, E.J. and R.M. Davis. 2011. Wood Decay Fungi in Landscape Trees. University of California. Integrated Pest Management Program. Agriculture and Natural Resources. Pest Notes 74109.
Howard, J.L. 1992. Pinus sabiniana. In: Fire Effects Information System. (Online) USDA, Forest Service Rocky Mountain Research Station, Fire Sciences Lab (Producer). Accessed: http://www.fs.fed.us/database/feis/[April 20, 2017]
Jackson, L. 1985. Ecological origins of California’s Mediterranean grasses. Journal of
Biogeography 12:349-361.
Keeley, J. E., Lubin, D. and Fotheringham, C. J. 2003. Fire and grazing impacts on plant diversity and alien plant invasions in the southern Sierra Nevada. Ecological Applications 13:1355-1374.
Perakis, S.S. and C.H. Kellogg. 2007. Imprint of oaks on nitrogen availability and delta N-15 in California grassland-savanna: a case of enhanced N inputs? Plant Ecology 191: 209-220.
Staniford, R., McDouglad, N., Frost, W., and R. Phillps. 1997. Factors influencing the probability of oak regeneration on southern Sierra Nevada woodlands in California. Madrono 44(2): 170-183.
Stewart, O. C., H. T. Lewis (ed.) and M. K. Anderson (ed.) 2002. Forgotten fires: Native Americans and the transient wilderness. University of Oklahoma Press: Norman, OK.
Tietje, W.D, Vreeland, J.K. and W.H. Weitkamp. 2001. Live oak saplings survive prescribed fire and sprout. California Agriculture 55(2): 18-22.
USDA, Forest Service, Missoula Fire Sciences Laboratory. 2012. Information from LANDFIRE on fire regimes of California oak woodlands. In: Fire Effects Information System, [Online]. U.S. Department of Agriculture, Forest Service, Rocky Mountain Research Station, Missoula Fire Sciences Laboratory (Producer). Available: https://www.fs.fed.us/database/feis/fire_regimes/CA_oak_woodlands/all.html [2018, March 21].Contributors
Dallas Glass
Theresa Kunch
Nathan RoeApproval
Kendra Moseley, 4/24/2024
Rangeland health reference sheet
Interpreting Indicators of Rangeland Health is a qualitative assessment protocol used to determine ecosystem condition based on benchmark characteristics described in the Reference Sheet. A suite of 17 (or more) indicators are typically considered in an assessment. The ecological site(s) representative of an assessment location must be known prior to applying the protocol and must be verified based on soils and climate. Current plant community cannot be used to identify the ecological site.
Author(s)/participant(s) Contact for lead author Date 09/22/2026 Approved by Approval date Composition (Indicators 10 and 12) based on Annual Production Indicators
-
Number and extent of rills:
-
Presence of water flow patterns:
-
Number and height of erosional pedestals or terracettes:
-
Bare ground from Ecological Site Description or other studies (rock, litter, lichen, moss, plant canopy are not bare ground):
-
Number of gullies and erosion associated with gullies:
-
Extent of wind scoured, blowouts and/or depositional areas:
-
Amount of litter movement (describe size and distance expected to travel):
-
Soil surface (top few mm) resistance to erosion (stability values are averages - most sites will show a range of values):
-
Soil surface structure and SOM content (include type of structure and A-horizon color and thickness):
-
Effect of community phase composition (relative proportion of different functional groups) and spatial distribution on infiltration and runoff:
-
Presence and thickness of compaction layer (usually none; describe soil profile features which may be mistaken for compaction on this site):
-
Functional/Structural Groups (list in order of descending dominance by above-ground annual-production or live foliar cover using symbols: >>, >, = to indicate much greater than, greater than, and equal to):
Dominant:
Sub-dominant:
Other:
Additional:
-
Amount of plant mortality and decadence (include which functional groups are expected to show mortality or decadence):
-
Average percent litter cover (%) and depth ( in):
-
Expected annual annual-production (this is TOTAL above-ground annual-production, not just forage annual-production):
-
Potential invasive (including noxious) species (native and non-native). List species which BOTH characterize degraded states and have the potential to become a dominant or co-dominant species on the ecological site if their future establishment and growth is not actively controlled by management interventions. Species that become dominant for only one to several years (e.g., short-term response to drought or wildfire) are not invasive plants. Note that unlike other indicators, we are describing what is NOT expected in the reference state for the ecological site:
-
Perennial plant reproductive capability:
Print Options
Sections
Font
AAAAOther
PrintThe Ecosystem Dynamics Interpretive Tool is an information system framework developed by the USDA-ARS Jornada Experimental Range, USDA Natural Resources Conservation Service, and New Mexico State University.
Accessibility statement


