
Natural Resources
Conservation Service
Ecological site R010XB081OR
Blue Mountain Foothills, Claypan North
12-16 PZ
Last updated: 5/16/2025
Accessed: 10/18/2026
-
Search


Major Land Resource Area or ecological site by name and/or ID.
PreviousSectionsNextGeneral information
Provisional. A provisional ecological site description has undergone quality control and quality assurance review. It contains a working state and transition model and enough information to identify the ecological site.
Click to explore map
Figure 1. Mapped extent
Areas shown in blue indicate the maximum mapped extent of this ecological site. Other ecological sites likely occur within the highlighted areas. It is also possible for this ecological site to occur outside of highlighted areas if detailed soil survey has not been completed or recently updated.
MLRA notes
Major Land Resource Area (MLRA): 010X–Central Rocky and Blue Mountain Foothills
This MLRA is characterized by gently rolling to steep hills, plateaus, and low mountains at the foothills of the Blue Mountains in Oregon and the Central Rocky Mountains in Idaho. The geology of this area is highly varied and ranges from Holocene volcanics to Cretaceous sedimentary rocks. Mollisols are the dominant soil order and the soil climate is typified by mesic or frigid soil temperature regimes, and xeric or aridic soil moisture regimes. Elevation ranges from 1,300 to 6,600 feet (395 to 2,010 meters), increasing from west to east. The climate is characterized by dry summers and snow dominated winters with precipitation averaging 8 to 16 inches (205 to 405 millimeters) and increasing from west to east. These factors support plant communities with shrub-grass associations with considerable acreage of sagebrush grassland. Big sagebrush, bluebunch wheatgrass, and Idaho fescue are the dominant species. Stiff sagebrush, low sagebrush, and Sandberg bluegrass are often dominant on sites with shallow restrictive layers. Western juniper is one of the few common tree species and since European settlement has greatly expanded its extent in Oregon. Nearly half of the MLRA is federally owned and managed by the Bureau of Land Management. Most of the area is used for livestock grazing with areas accessible by irrigation often used for irrigated agriculture.
LRU notes
This ecological site is found across all of the land resource units within the Blue Mountain Foothills (Western) portion of MLRA 10. Within this extent, much of its range is concentrated in the John Day Sediments and John Day Mountain Foothills LRUs due to the influence of the John Day and Clarno formations on subsurface clay content.
Classification relationships
International Vegetation Classification System:
Macrogroup: M170. Great Basin-Intermountain Dwarf Sagebrush Steppe & Shrubland
Group: G308. Intermountain Low & Black Sagebrush Steppe & Shrubland
Landfire Biophysical Setting:
11240 - Columbia Plateau Low Sagebrush Steppe
Bunchgrass Plant Communities of the Blue and Ochoco Mountains:
SD1911 - Low sagebrush/Idaho fescue-bluebunch wheatgrass plant associationEcological site concept
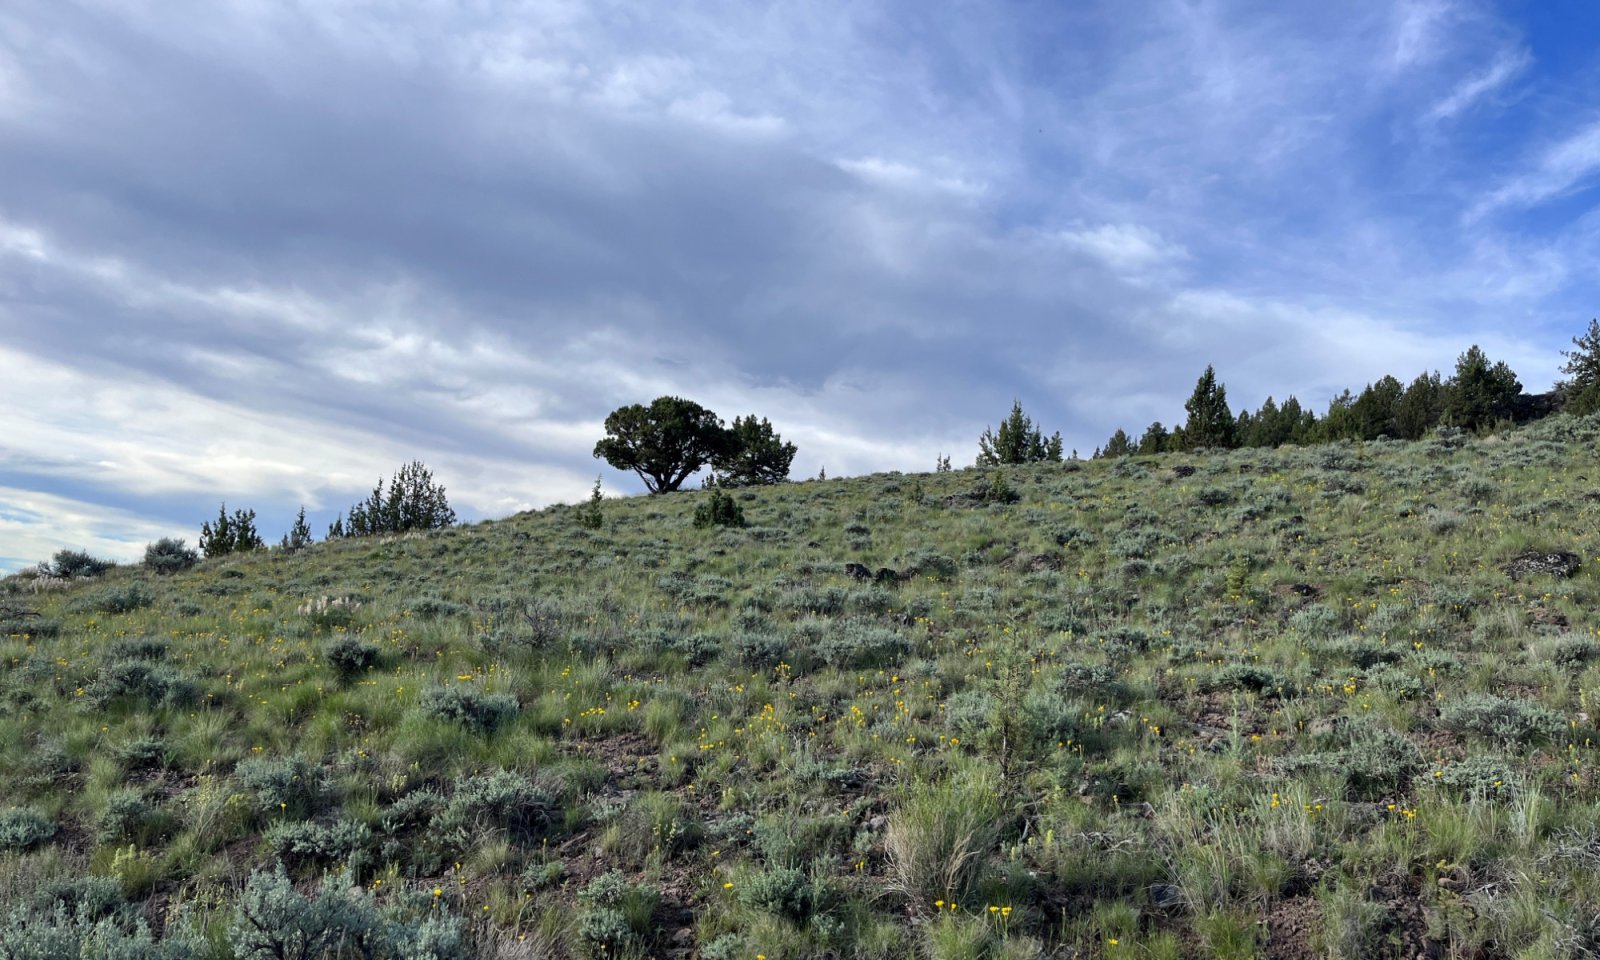
This site is typified by moderate north and east facing slopes (greater than 15 percent), with "claypan" soils marked by a strong clay increase within 4 to 8 inches of the surface, facilitating the presence of little sagebrush. In reference condition, this ecological site supports a plant community dominated by little sagebrush (Artemisia arbuscula) and Idaho fescue (Festuca idahoensis). The site receives 12 to 16 inches of annual precipitation, the soil climate is frigid/xeric and resistance/resilience to disturbance is moderately high.
Associated sites
R010XB070OR JD North 12-16 PZ
Adjacent north slopes over John Day sediments, in topographical positions where ashy soil surfaces are deeper than 8 inches
R010XB033OR JD Shallow North 12-16 PZ
Adjacent north slopes over John Day sediments, in topographical positions where soils are shallow and ashy surface soils are deeper than 8 inches
R010XB085OR JD Mountain North 12-16 PZ
Adjacent north slopes over John Day sediments, in topographical positions where ashy soil surfaces are deeper than 8 inches
R010XC066OR SR Mountain North 12-16 PZ
Adjacent north slopes in the Snake River Mountain Foothills, in topographical positions where ashy soil surfaces are deeper than 8 inches
Similar sites
R010XB080OR Blue Mountain Foothills, Claypan 12-16 PZ
Non-aspect, slopes less than 20 percent
R010XB082OR JD Shrubby Claypan 12-16 PZ
Non-aspect, slopes less than 20 percent, overlying fractured bedrock, facilitating greater composition of bitterbrush
R010XB070OR JD North 12-16 PZ
Ashy soil surfaces deeper than 8 inches, lacking little sagebrush
R010XC066OR SR Mountain North 12-16 PZ
Ashy soil surfaces deeper than 8 inches, lacking little sagebrush
Table 1. Dominant plant species
Tree Not specified
Shrub (1) Artemisia arbuscula
Herbaceous (1) Festuca idahoensis
Physiographic features
This site occurs on north facing aspects of hillslopes, landslides, canyon walls and mountain plateaus. Slopes are typically 15 percent to 30 percent. This site often occurs in run-on positions such as the lower third of backslopes and concave side slopes. Elevation typically varies from 3,700 feet to 4,700 feet.
Table 2. Representative physiographic features
Slope shape across (1) Concave
(2) Linear
Slope shape up-down (1) Concave
(2) Linear
Landforms (1) Mountains > Hillslope
(2) Mountains > Plateau
(3) Mountains > Canyon wall
(4) Mountains > Landslide
Flooding frequency None Ponding frequency None Elevation 3700 – 4700 ft Slope 15 – 30 % Water table depth 60 in Aspect NW, N, NE, E Table 3. Representative physiographic features (actual ranges)
Flooding frequency None Ponding frequency None Elevation 3000 – 5200 ft Slope 15 – 45 % Water table depth 60 in Climatic features
The annual precipitation ranges from 12 to 16 inches, most of which occurs in the form of snow during the months of November through March. Localized, occasionally severe, convectional storms occur during the summer. The mean annual air temperature is 45 degrees F and temperature extremes range from over 100 to negative 30 degrees F. The frost-free period ranges from 30 to 90 days. The optimum period for plant growth is from April through June.
Table 4 Representative climatic features
Frost-free period (characteristic range) 30-90 days Freeze-free period (characteristic range) 90-130 days Precipitation total (characteristic range) 10-20 in Frost-free period (actual range) 30-110 days Freeze-free period (actual range) 90-150 days Precipitation total (actual range) 10-20 in Frost-free period (average) 60 days Freeze-free period (average) 110 days Precipitation total (average) 10 in Characteristic rangeActual rangeBarLineFigure 2. Monthly precipitation range
Characteristic rangeActual rangeBarLineFigure 3. Monthly minimum temperature range
Characteristic rangeActual rangeBarLineFigure 4. Monthly maximum temperature range
BarLineFigure 5. Monthly average minimum and maximum temperature
Figure 6. Annual precipitation pattern
Figure 7 Annual average temperature pattern
Climate stations used
-
(1) BARNES STN [USC00350501], Prineville, OR
-
(2) MITCHELL 2 E [USC00355638], Mitchell, OR
-
(3) DREWSEY [USC00352415], Drewsey, OR
">Influencing water features
This site is not associated with riparian or wetland features.
Soil features
The soils of this site are typified by a shallow depth to claypan marked by a strong increase in clay within 4 to 8 inches of the surface. Soils may be deep overall but these heavy clay layers restrict some root penetration and cause soils to function as effectively shallow. Occasionally, a restrictive clay layer is absent and the soil is shallow to indurated bedrock. The surface is typically an ashy loam or cobbly loam to a sometimes abrupt subsurface marked by a heavy clay loam or clay. Soils are formed from colluvium, alluvium, residuum and volcanic ash over igneous volcanic rock. The soils are often skeletal with gravels and cobbles. Permeability is moderate to moderately slow in the surface and slow to very slow in the subsoil. The available water capacity (AWC) is typically 0.8 to 2.5 inches. The erosion potential is moderate to severe. The soil temperature regime is frigid and the moisture regime is xeric. See Camool or Fopiano for soil series that typify this site.

Figure 8.

Figure 9.
Table 5. Representative soil features
Parent material (1) Colluvium – volcanic rock
(2) Residuum – volcanic rock
(3) Volcanic ash
Surface texture (1) Ashy loam
(2) Cobbly loam
(3) Very stony loam
Family particle size (1) Clayey-skeletal
(2) Clayey
(3) Fine
Drainage class Well drained Permeability class Moderately slow to moderate Depth to restrictive layer 10 – 20 in Soil depth 20 – 25 in Surface fragment cover <=3" 2 – 10 % Surface fragment cover >3" 0 – 2 % Available water capacity
(0-40in)2 – 3.5 in Calcium carbonate equivalent
(0-40in)Not specified Clay content
(0-6in)10 – 25 % Electrical conductivity
(0-40in)Not specified Sodium adsorption ratio
(0-40in)Not specified Soil reaction (1:1 water)
(0-40in)6.6 – 7.3 Subsurface fragment volume <=3"
(4-40in)10 – 25 % Subsurface fragment volume >3"
(4-40in)15 – 35 % Table 6. Representative soil features (actual values)
Drainage class Well drained Permeability class Slow to moderate Depth to restrictive layer 5 – 60 in Soil depth 15 – 60 in Surface fragment cover <=3" 0 – 20 % Surface fragment cover >3" 0 – 10 % Available water capacity
(0-40in)1 – 5.5 in Calcium carbonate equivalent
(0-40in)0 – 1 % Clay content
(0-6in)6 – 30 % Electrical conductivity
(0-40in)0 – 2 mmhos/cm Sodium adsorption ratio
(0-40in)0 Soil reaction (1:1 water)
(0-40in)6.1 – 7.8 Subsurface fragment volume <=3"
(4-40in)0 – 45 % Subsurface fragment volume >3"
(4-40in)0 – 45 % Ecological dynamics
Indicators and Range in Characteristics:
Little sagebrush is a strong indicator of this ecological site; given its adaptation to the unique soil conditions that define the site. This site often exists within a matrix of stiff sagebrush (Artemisia rigida) ecological sites on very shallow soil and big sagebrush (Artemisia tridentata spp.) ecological sites on deeper surface horizons. Old growth juniper may occur sporadically on this site in low density (0 to 6 trees per acre, BLM ESI data). Given the relatively low fuel loads and consequently infrequent fire regime, this site represents one of the persistent juniper types (Miller 1999). Sandberg bluegrass increases on shallower soils or soils with thinner surface horizons. Total production is proportional to surface soil depth, increasing with deeper surface soil layers.
Ecological Dynamics and Disturbance Response:
Ecological dynamics of this site are primarily driven by interactions between climatic patterns and disturbance regimes. Infrequent fires were the primary historical disturbance that maintained the reference state and drove plant community shifts within the state. Mean fire return intervals for little sagebrush communities are estimated at 100 to 200 years across their range and 97 to 183 for communities within Oregon (Landfire 2009, Bukowski and Baker 2013). Intensity and frequency of these fires is driven by relatively low fuel loads and strongly influence by drought cycles and insect or disease attacks on the plant community.
Livestock grazing is a common land use of this ecological site. Under improper grazing management, especially repeated over utilization during the growing season, cover of deep-rooted perennial grasses, such as Idaho fescue and bluebunch wheatgrass, will decrease. If improper management continues, cover of shallow-rooted perennial grasses, such as Sandberg bluegrass, and shrubs such as little sagebrush, may increase. Ongoing deterioration due to improper management will increase bare ground and release soil resources, facilitating invasion by annual grasses and forbs.
Little sagebrush has extensive fibrous roots with a greater capacity to tolerate poor aeration and extract water from lower depths than big sagebrush (Steinberg 2002); an important adaptation allowing it to thrive on seasonally saturated, claypan soils. Little sagebrush is killed by fire and will not resprout (Young 1983). Establishment after fire is from seed, which typically does not persist in the seedbank and must be dispersed from offsite (Bradley et al. 1992). After fire, if regeneration conditions are favorable, little sagebrush may recover in as little as five years, however during drought periods or on sites with low potential, recovery may require more than ten years (Young 1983). One study in Oregon found no recruitment of little sagebrush eight years post-fire (Bates and Davies 2022).
The primary perennial bunchgrass species found on this ecological site differ somewhat in their response to fire. While both Idaho fescue and bluebunch wheatgrass can survive low severity fires, Idaho fescue is characterized by somewhat higher growing points than bluebunch wheatgrass, rendering it more susceptible to damage and mortality following high severity fire (Conrad and Poulton 1966). Sandberg bluegrass (Poa secunda) is generally unharmed by fire given its low litter production and early dormancy. While increases in Sandberg bluegrass have been documented in some sagebrush systems following fire (Howard 1997), one study in a little sagebrush community found no change after eight years post-fire (Bates and Davies 2022).
Perennial forbs are an important component of the species composition of this site. Mat forming forbs such as phlox (p. hoodii and longiloba), low pussytoes (Antenaria dimorpha) and desert yellow fleabane (Erigeron linearis), are common as are geophytes such as desert parsley (Lomatium spp.) and bitter root (Lewisia rediviva); and other forbs such as lupine (Lupinus spp.) and hawksbeard (Crepis spp.). Mat forming forbs may be particularly vulnerable to decreases in cover and density following fire (Bates and Davies 2022). Interannual variation is often a significant driver of forb expression in little sagebrush communities (Bates and Davies 2022).
Western juniper is intolerant of fire and historically was restricted to sites with lower fuel loads and infrequent fire regimes, such as characterizes this ecological site. Given these conditions, this site may act as refugia that allow some scattered old growth juniper to persist (Miller et al. 1999). With the increased suppression of wildfire and livestock grazing which reduces ground fuels and understory competition, western juniper has increased in range and density and expanded into suitable sites previously dominated by sagebrush (Miller and Tausch 2008, Burns and Honkala 1990). However, post settlement western juniper expansion is also likely due at least in part to changing climate and may be accelerated by increasing atmospheric CO2 levels (Miller 2019). On this site, high clay content in the soil subsurface slows the rate at which juniper infill and encroachment occur.
The introduced annual grass species most likely to invade these sites are cheatgrass (Bromus tectorum), medusahead (Taeniatherum caput-medusae) and North Africa grass (Ventenata dubia). All of these species compete with native herbaceous species for finite site resources and may increase fine fuel loads. Annual grass invasion, particularly cheatgrass, has been linked to increases in fire frequency in the intermountain west (Bradley et al. 2018). Medusahead invasion may promote thick, decomposition resistant thatch layers that suppress establishment of other species. Invasions by North Africa grass are increasing in recent years and research as to cause and effect of these invasions is ongoing.
Within the natural range of variability, this site is considered to have moderately high resistance and resilience to disturbance. These attributes are driven by the northerly aspects of this site, the cool annual temperatures and semi-arid Mediterranean precipitation patterns (Frigid/Xeric soil climate) (Chambers, et al. 2014). Resistance is further bolstered by the very shallow restrictive features and high clay content in the soil which slow establishment of western juniper. However, in an altered state where erosion of the surface horizon occurs, this site may lose resilience more rapidly than sites supporting deeper surface horizons.State and transition model
More interactive model formats are also available. View Interactive Models
Click on state and transition labels to scroll to the respective textStates 2 and 5 (additional transitions)
T1A - Introduction of non-native species; long-term overutilization by livestock. T2A - Inappropriate grazing management T2B - Time T2C - Fire, soil disruption, inappropriate grazing management T3B - Time T3A - Catastrophic fire, multiple fires, and/or soil disturbing treatments, Inappropriate grazing management R4A - Tree thinning; seeding R4B - Mechanical tree thinning; seeding (failed) T4A - Failed mechanical treatment, catastrophic fire R5A - Annual grass treatment; reseeding State 1 submodel, plant communities
1.1A - Time and lack of disturbance 1.2A - Fire State 2 submodel, plant communities
2.1A - Time, growing season grazing 2.1B - Inappropriate grazing management 2.2A - Fire, dormant season grazing, brush treatments, aroga moth outbreak 2.2B - Inappropriate grazing management, brush management 2.3B - Time, rest from grazing, reseeding 2.3A - Time and rest from grazing, reseeding State 3 submodel, plant communities
3.1A - Time 3.2A - Fire State 4 submodel, plant communities
4.1A - Time State 5 submodel, plant communities
5.1A - Fire, mechanical shrub removal State 1
Reference
The Reference state is representative of the natural range of variability under pristine condition. While occurrence is rare, this is not considered a "Historical" reference since for this ecological site, examples of these conditions may still occur on the landscape. No introduced species occur and repeated disturbance has not fundamentally altered soil quality or plant community composition. The reference state has two general plant communities; a grass-shrub dominant community, a shrub-grass dominant community and a shallow-rooted grass dominant community (considered the at-risk community). State dynamics are maintained by interactions between climatic patterns and disturbance regimes. Negative feedbacks enhance ecosystem resilience and contribute to the stability of the state. These include the presence of all structural and functional groups, low fine fuel loads, and retention of organic matter and nutrients. Plant community changes are primarily driven by fire, time and periodic drought.
Characteristics and indicators. • Lack of introduced plant species • Presence of all functional and structural groups • High plant vigor and reproductive capacity in most years • Lack of widespread soil erosion
Resilience management. Reference sites should be prioritized in landscape health strategies wherever possible. Management should focus on land conservation and protection of these rare conditions above other uses. Surrounding landscapes should be carefully managed to prevent species introductions and other impacts on reference sites. See the "Defend the Core" strategy for additional information (Maestas et al. 2021).
Dominant plant species
-
little sagebrush (Artemisia arbuscula), shrub
-
Idaho fescue (Festuca idahoensis), grass
Community 1.1
Deep-rooted Bunchgrass and Little Sagebrush
The reference plant community is dominated by Idaho fescue with bluebunch wheatgrass and little sagebrush sub-dominant. A diversity of forbs are often present. Sandberg bluegrass is the dominant shallow-rooted perennial grass. Following fire, little sagebrush cover will be very patchy or absent. In an analysis of 68 plots collected on this ecological site between 2005 and 2020, 11 plots (16 percent) were classified to this community.
Dominant plant species
-
little sagebrush (Artemisia arbuscula), shrub
-
Idaho fescue (Festuca idahoensis), grass
Figure 10. Annual production by plant type (representative values) or group (midpoint values)
Table 7. Annual production by plant type
Plant type Low
(lb/acre)Representative value
(lb/acre)High
(lb/acre)Grass/Grasslike 490 630 740 Forb 50 80 120 Shrub/Vine 60 80 120 Tree 0 10 20 Total 600 800 1000 Table 8. Ground cover
Tree foliar cover 0-10% Shrub/vine/liana foliar cover 0-20% Grass/grasslike foliar cover 30-50% Forb foliar cover 10-30% Non-vascular plants 0% Biological crusts 0-0% Litter 20-40% Surface fragments >0.25" and <=3" 0-10% Surface fragments >3" 0-10% Bedrock 0% Water 0% Bare ground 0-20% Table 9. Soil surface cover
Tree basal cover 0.0-0.1% Shrub/vine/liana basal cover 0.0-0.5% Grass/grasslike basal cover 10-20% Forb basal cover 0-0% Non-vascular plants 0% Biological crusts 0-20% Litter 0% Surface fragments >0.25" and <=3" 10-20% Surface fragments >3" 0-20% Bedrock 0% Water 0% Bare ground 20-70% Figure 11. Plant community growth curve (percent production by month). OR4300 , Claypan 12-16 PZ.
Jan Feb Mar Apr May Jun Jul Aug Sep Oct Nov Dec J F M A M J J A S O N D 0 0 5 15 30 35 5 0 5 5 0 0 Community 1.2
Little Sagebrush and Deep-rooted Bunchgrass
Little sagebrush is dominant and deep-rooted perennial bunchgrasses, particularly Idaho fescue, is sub-dominant. A diverse forb component is typically present. Young juniper may be increasing. In an analysis of 68 plots collected on this ecological site between 2005 and 2020, 9 plots (13 percent) were classified to this community.
Dominant plant species
-
little sagebrush (Artemisia arbuscula), shrub
-
Idaho fescue (Festuca idahoensis), grass
Figure 12. Annual production by plant type (representative values) or group (midpoint values)
Table 10. Annual production by plant type
Plant type Low
(lb/acre)Representative value
(lb/acre)High
(lb/acre)Grass/Grasslike 305 400 490 Shrub/Vine 140 200 260 Forb 55 75 120 Tree 0 15 30 Total 500 690 900 Table 11. Ground cover
Tree foliar cover 0-10% Shrub/vine/liana foliar cover 10-30% Grass/grasslike foliar cover 20-40% Forb foliar cover 10-20% Non-vascular plants 0% Biological crusts 0-0% Litter 20-40% Surface fragments >0.25" and <=3" 0-10% Surface fragments >3" 0-10% Bedrock 0% Water 0% Bare ground 0-20% Table 12. Soil surface cover
Tree basal cover 0.0-0.1% Shrub/vine/liana basal cover 0.5-2.0% Grass/grasslike basal cover 0-10% Forb basal cover 0-0% Non-vascular plants 0% Biological crusts 0-20% Litter 0% Surface fragments >0.25" and <=3" 10-20% Surface fragments >3" 0-20% Bedrock 0-0% Water 0% Bare ground 20-70% Figure 13. Plant community growth curve (percent production by month). OR4300 , Claypan 12-16 PZ.
Jan Feb Mar Apr May Jun Jul Aug Sep Oct Nov Dec J F M A M J J A S O N D 0 0 5 15 30 35 5 0 5 5 0 0 Pathway 1.1A
Community 1.1 to 1.2
Deep-rooted Bunchgrass and Little Sagebrush
Little Sagebrush and Deep-rooted BunchgrassTime and lack of disturbance allows for shrub regeneration and growth.
Context dependence.Ungulate grazing of perennial grasses may favor increases in shrub cover
Pathway 1.2A
Community 1.2 to 1.1
Little Sagebrush and Deep-rooted Bunchgrass
Deep-rooted Bunchgrass and Little SagebrushLow severity fire creates a grass and sagebrush mosaic; higher severity fire significantly reduces sagebrush cover and leads to a community dominated by grasses and forbs.
Context dependence.Fire may be more likely following wet years that increase herbaceous production
State 2
Current Potential
This state is similar to the reference state yet some amount of introduced species occur and species composition or soil quality has been altered by long-term overutilization by livestock. Ecological function is largely intact, however the resiliency of the state has been reduced. This state has two general communities; a grass-shrub dominant community, a shrub-grass dominant community and a shallow-rooted grass dominant community (considered an at risk-community). Introduced species may increase in abundance but will not become dominant within this state. Negative feedbacks enhance ecosystem resilience and contribute to the stability of the state. These feedbacks include the presence of all structural and functional groups, low fine fuel loads, and retention of organic matter and nutrients.
Characteristics and indicators. • Low cover of introduced plant species (less than twice as much as deep rooted perennial bunchgrass cover) • Deep rooted perennial grasses typically greater than 10 percent cover • Presence of most or all functional and structural groups • High plant vigor and reproductive capacity in most years • Lack of widespread soil erosion
Resilience management. Current potential sites in high condition should be prioritized in landscape health strategies wherever possible. Management should focus on protection, minimization of disturbance, and early detection and treatment of plant invasions. Plant community management should focus on preserving deep-rooted perennial bunchgrasses in particular. Surrounding landscapes should be carefully managed to prevent impacts to these sites. See the "Defend the Core" strategy for additional information (Maestas et al. 2021).
Dominant plant species
-
little sagebrush (Artemisia arbuscula), shrub
-
Idaho fescue (Festuca idahoensis), grass
Community 2.1
Deep-rooted Bunchgrass and Little Sagebrush
Deep-rooted perennial bunchgrasses, particularly Idaho fescue, are dominant and little sagebrush is sub-dominant. Following fire, little sagebrush may be very patchily distributed or nearly absent. A diverse forb component is typically present and may be increasing. Annual non-native species are present but not dominant. In an analysis of 68 plots collected on this ecological site between 2005 and 2020, 18 plots (26 percent) were classified to this community.
Dominant plant species
-
little sagebrush (Artemisia arbuscula), shrub
-
Idaho fescue (Festuca idahoensis), grass
Figure 14. Annual production by plant type (representative values) or group (midpoint values)
Table 13. Annual production by plant type
Plant type Low
(lb/acre)Representative value
(lb/acre)High
(lb/acre)Grass/Grasslike 440 550 745 Shrub/Vine 50 100 145 Forb 55 75 110 Tree 5 25 50 Total 550 750 1050 Table 14. Ground cover
Tree foliar cover 0-10% Shrub/vine/liana foliar cover 10-20% Grass/grasslike foliar cover 30-50% Forb foliar cover 10-30% Non-vascular plants 0% Biological crusts 0-10% Litter 10-40% Surface fragments >0.25" and <=3" 0-10% Surface fragments >3" 0-10% Bedrock 0% Water 0% Bare ground 0-20% Table 15. Soil surface cover
Tree basal cover 0.0-0.1% Shrub/vine/liana basal cover 0.0-0.5% Grass/grasslike basal cover 10-20% Forb basal cover 0-0% Non-vascular plants 0% Biological crusts 0-10% Litter 0.0-0.1% Surface fragments >0.25" and <=3" 10-30% Surface fragments >3" 0-20% Bedrock 0-0% Water 0% Bare ground 20-60% Figure 15. Plant community growth curve (percent production by month). OR4300 , Claypan 12-16 PZ.
Jan Feb Mar Apr May Jun Jul Aug Sep Oct Nov Dec J F M A M J J A S O N D 0 0 5 15 30 35 5 0 5 5 0 0 Community 2.2
Little Sagebrush and Deep-rooted Bunchgrass
Little sagebrush is dominant and deep-rooted perennial bunchgrasses, particularly Idaho fescue, are sub-dominant. A diverse forb component is typically present. Young juniper may be increasing. Annual non-native species are present but not dominant. In an analysis of 68 plots collected on this ecological site between 2005 and 2020, 16 plots (24 percent) were classified to this community.
Dominant plant species
-
little sagebrush (Artemisia arbuscula), shrub
-
Idaho fescue (Festuca idahoensis), grass
Figure 16. Annual production by plant type (representative values) or group (midpoint values)
Table 16. Annual production by plant type
Plant type Low
(lb/acre)Representative value
(lb/acre)High
(lb/acre)Grass/Grasslike 290 325 520 Shrub/Vine 120 175 260 Forb 35 75 110 Tree 5 25 60 Total 450 600 950 Table 17. Ground cover
Tree foliar cover 0-10% Shrub/vine/liana foliar cover 20-30% Grass/grasslike foliar cover 20-40% Forb foliar cover 10-20% Non-vascular plants 0% Biological crusts 0-10% Litter 10-40% Surface fragments >0.25" and <=3" 0-10% Surface fragments >3" 0-10% Bedrock 0% Water 0% Bare ground 10-20% Table 18. Soil surface cover
Tree basal cover 0.0-0.1% Shrub/vine/liana basal cover 0.5-2.0% Grass/grasslike basal cover 10-10% Forb basal cover 0-0% Non-vascular plants 0% Biological crusts 0-10% Litter 0.0-0.1% Surface fragments >0.25" and <=3" 10-30% Surface fragments >3" 0-20% Bedrock 0-0% Water 0% Bare ground 20-70% Figure 17. Plant community growth curve (percent production by month). OR4300 , Claypan 12-16 PZ.
Jan Feb Mar Apr May Jun Jul Aug Sep Oct Nov Dec J F M A M J J A S O N D 0 0 5 15 30 35 5 0 5 5 0 0 Community 2.3
Shallow-rooted Bunchgrass and Little Sagebrush
Shallow-rooted perennial bunchgrass, particularly Sandberg bluegrass, is dominant and deep-rooted perennial bunchgrass are sub-dominant but still typically occupy at least 10 percent cover. Some of the soil surface may have been degraded due to compaction or minor erosion. Young juniper may be increasing. Introduced annual species present to increasing. This is considered an at-risk phase due to the loss of some of the deep-rooted bunchgrass component and typically an increase in introduced annual species, bare ground, and gap cover. In an analysis of 68 plots collected on this ecological site between 2005 and 2020, three plots (4 percent) were classified to this community.
Dominant plant species
-
little sagebrush (Artemisia arbuscula), shrub
-
Sandberg bluegrass (Poa secunda), grass
Figure 18. Annual production by plant type (representative values) or group (midpoint values)
Table 19. Annual production by plant type
Plant type Low
(lb/acre)Representative value
(lb/acre)High
(lb/acre)Grass/Grasslike 230 300 455 Shrub/Vine 40 100 175 Forb 75 100 160 Tree 5 25 60 Total 350 525 850 Table 20. Ground cover
Tree foliar cover 0-10% Shrub/vine/liana foliar cover 10-20% Grass/grasslike foliar cover 30-50% Forb foliar cover 10-30% Non-vascular plants 0% Biological crusts 0-10% Litter 10-20% Surface fragments >0.25" and <=3" 0-10% Surface fragments >3" 0-10% Bedrock 0% Water 0% Bare ground 10-20% Table 21. Soil surface cover
Tree basal cover 0.0-0.1% Shrub/vine/liana basal cover 0.1-1.0% Grass/grasslike basal cover 10-20% Forb basal cover 0-0% Non-vascular plants 0% Biological crusts 0-10% Litter 0.0-0.1% Surface fragments >0.25" and <=3" 10-30% Surface fragments >3" 0-30% Bedrock 0-0% Water 0% Bare ground 20-60% Figure 19. Plant community growth curve (percent production by month). OR4301 , Claypan 12-16 PZ, poor condition.
Jan Feb Mar Apr May Jun Jul Aug Sep Oct Nov Dec J F M A M J J A S O N D 0 0 5 20 30 25 5 0 5 10 0 0 Pathway 2.1A
Community 2.1 to 2.2
Deep-rooted Bunchgrass and Little Sagebrush
Little Sagebrush and Deep-rooted BunchgrassTime and lack of disturbance allows for shrub growth and regeneration.
Context dependence.Ungulate grazing during the growing season may also reduce deep-rooted perennial bunchgrass composition relative to little sagebrush.
Pathway 2.1B
Community 2.1 to 2.3
Deep-rooted Bunchgrass and Little Sagebrush
Shallow-rooted Bunchgrass and Little SagebrushInappropriate grazing management, especially during the growing season, may reduce deep-rooted perennial bunchgrasses cover. Soil compaction as a result of inappropriate grazing management may also favor shallow-rooted bunchgrass dominance.
Context dependence.Drought may accelerate or exacerbate change; soils are particularly susceptible to compaction when moist.
Pathway 2.2A
Community 2.2 to 2.1
Little Sagebrush and Deep-rooted Bunchgrass
Deep-rooted Bunchgrass and Little SagebrushLow severity fire creates a grass and shrub mosaic; higher severity fire significantly reduces sagebrush cover and leads to community dominated by grasses and forbs. Agora moth outbreaks may decrease little sagebrush. Brush treatments with minimal soil disturbance may reduce the shrub overstory. Dormant season grazing by ungulates, particularly sheep, may also decrease little sagebrush composition.
Context dependence.Soil disturbance will be influenced by season of treatment or grazing
Pathway 2.2B
Community 2.2 to 2.3
Little Sagebrush and Deep-rooted Bunchgrass
Shallow-rooted Bunchgrass and Little SagebrushInappropriate year-round grazing may reduce deep-rooted bunchgrasses and little sagebrush relative to Sandberg bluegrass. Brush treatments that lead to soil compaction may reduce shrubs and deep-rooted bunchgrasses. Soil compaction as a result of inappropriate grazing management may also favor shallow-rooted bunchgrass dominance.
Context dependence.Drought may accelerate or exacerbate change; soils are particularly susceptible to compaction when moist.
Pathway 2.3B
Community 2.3 to 2.1
Shallow-rooted Bunchgrass and Little Sagebrush
Deep-rooted Bunchgrass and Little SagebrushTime and rest from growing season grazing may promote an increase in deep-rooted perennial bunchgrasses. Brush treatments with minimal soil disturbance may reduce the shrub overstory. Dormant season grazing by ungulates, particularly sheep, may also decrease little sagebrush composition.
Context dependence.Above average growing season precipitation may increase establishment success; if deep-rooted bunchgrass establishment is limited by reproductive vigor, reseeding may be required
Pathway 2.3A
Community 2.3 to 2.2
Shallow-rooted Bunchgrass and Little Sagebrush
Little Sagebrush and Deep-rooted BunchgrassTime and rest from excessive grazing allows the shrub overstory to mature. Deep-rooted bunchgrasses may increase in the absence of disturbance if conditions are favorable.
Context dependence.If deep-rooted bunchgrass establishment is limited by reproductive vigor, reseeding may be required
State 3
Degraded
This state is a product of many years of heavy grazing during growth periods of cool season, perennial bunchgrasses. Much of the deep-rooted perennial bunchgrass component has been lost and cover rarely exceeds 5 to 7 percent. Erosion of part of the surface soil horizon may have occurred and may be ongoing. Sandberg bluegrass will increase with a reduction in deep-rooted perennial bunchgrass competition and become the dominant grass. This state consists of two plant communities, a shallow-rooted bunchgrass dominant community and a little sagebrush, shallow-rooted bunchgrass community. Introduced species cover is typically higher than in the current potential state. The shrub overstory and bluegrass understory dominate site resources such that soil water, nutrient capture, nutrient cycling and soil organic matter are temporally and spatially redistributed.
Characteristics and indicators. • Low cover and production of deep-rooted perennial bunchgrasses (typically less than 7 percent cover) • Moderate to high cover of shallow-rooted perennial bunchgrasses • Variable cover of little sagebrush • Evidence of soil erosion
Resilience management. Management should focus on preserving and reintroducing deep-rooted perennial bunchgrasses and treating introduced annual species to prevent a transition to an annual state.
Dominant plant species
-
little sagebrush (Artemisia arbuscula), shrub
-
Sandberg bluegrass (Poa secunda), grass
Community 3.1
Shallow-rooted Bunchgrass and AnnualsSandberg bluegrass is dominant and little sagebrush decreased. Deep-rooted perennial grasses are a minor component or missing. Non-native annual species present to increasing. Western juniper present to increasing. In an analysis of 68 plots collected on this ecological site between 2005 and 2020, no plots were classified to this community, therefore, annual production values were extrapolated from the 3.2 community and other ecological sites.
Dominant plant species
-
Sandberg bluegrass (Poa secunda), grass
Figure 20. Annual production by plant type (representative values) or group (midpoint values)
Table 22. Annual production by plant type
Plant type Low
(lb/acre)Representative value
(lb/acre)High
(lb/acre)Grass/Grasslike 125 250 350 Forb 50 75 100 Shrub/Vine 15 25 75 Tree 10 25 50 Total 200 375 575 Figure 21. Plant community growth curve (percent production by month). OR4301 , Claypan 12-16 PZ, poor condition.
Jan Feb Mar Apr May Jun Jul Aug Sep Oct Nov Dec J F M A M J J A S O N D 0 0 5 20 30 25 5 0 5 10 0 0 Community 3.2
Little Sagebrush, Shallow-rooted Bunchgrass and Annuals
Little sagebrush is dominant. Sandberg bluegrass increases. Deep-rooted perennial grasses are a minor component or missing. Non-native annual species present to increasing. Western juniper present to increasing. In an analysis of 68 plots collected on this ecological site between 2005 and 2020, two plots (3 percent) were classified to this community.
Dominant plant species
-
little sagebrush (Artemisia arbuscula), shrub
-
Sandberg bluegrass (Poa secunda), grass
Figure 22. Annual production by plant type (representative values) or group (midpoint values)
Table 23. Annual production by plant type
Plant type Low
(lb/acre)Representative value
(lb/acre)High
(lb/acre)Grass/Grasslike 125 150 300 Shrub/Vine 100 175 300 Tree 10 25 50 Forb 15 25 50 Total 250 375 700 Table 24. Ground cover
Tree foliar cover 0-10% Shrub/vine/liana foliar cover 20-20% Grass/grasslike foliar cover 20-40% Forb foliar cover 0-20% Non-vascular plants 0% Biological crusts 0-10% Litter 10-20% Surface fragments >0.25" and <=3" 0-10% Surface fragments >3" 0-10% Bedrock 0% Water 0% Bare ground 10-30% Table 25. Soil surface cover
Tree basal cover 0.0-0.1% Shrub/vine/liana basal cover 0.1-1.0% Grass/grasslike basal cover 0-10% Forb basal cover 0-0% Non-vascular plants 0% Biological crusts 10-20% Litter 0.0-0.1% Surface fragments >0.25" and <=3" 10-20% Surface fragments >3" 0-40% Bedrock 0-0% Water 0% Bare ground 20-60% Figure 23. Plant community growth curve (percent production by month). OR4301 , Claypan 12-16 PZ, poor condition.
Jan Feb Mar Apr May Jun Jul Aug Sep Oct Nov Dec J F M A M J J A S O N D 0 0 5 20 30 25 5 0 5 10 0 0 Pathway 3.1A
Community 3.1 to 3.2Time without disturbance
Context dependence.Shrub regeneration and growth may depend on nearby availability of seed source and/or shrub reproductive vigor
Pathway 3.2A
Community 3.2 to 3.1Fire reduces shrub component
Context dependence.Years of above average precipitation may increase herbaceous fuels and increase the probability of fire
State 4
Encroached
In this state the site has crossed a threshold and is dominated by western juniper. Low sagebrush and perennial bunchgrasses may still be present, but they are no longer controlling site resources. As juniper cover increases, shrub cover typically decreases, therefore this site is characterized by two communities, a western juniper/shrub community and a western juniper dominated community. Soil moisture, soil nutrients and soil organic matter distribution and cycling have been spatially and temporally altered. Soil erosion may accelerate as perennial herbaceous cover decreases.
Characteristics and indicators. • Western juniper canopy cover 10 to 25 percent (or greater) (see Miller et al. 2007 for additional context) • Deep-rooted perennial bunchgrasses and little sagebrush decreased • Evidence of soil erosion common
Resilience management. Management should focus on preserving and reintroducing deep-rooted perennial bunchgrasses and treating western juniper to prevent further loss of other plant functional groups. Communities at earlier stages of invasion will have the highest likelihood of restoration success (See Miller et al. 2007). Special care should be taken to avoid removal of old growth western juniper.
Dominant plant species
-
western juniper (Juniperus occidentalis), tree
-
little sagebrush (Artemisia arbuscula), shrub
-
Sandberg bluegrass (Poa secunda), grass
Community 4.1
Western Juniper and Little Sagebrush
Western juniper is co-dominant relative to sagebrush and deep-rooted perennial grasses. Sandberg bluegrass may be increasing in the understory. Non-native annual species are often common. The site will be expressing stage 1 or early stage 2 juniper invasion (see Miller et al. USGS, 2007). In an analysis of 68 plots collected on this ecological site between 2005 and 2020, six plots (9 percent) were classified to this community.
Dominant plant species
-
western juniper (Juniperus occidentalis), tree
-
little sagebrush (Artemisia arbuscula), shrub
-
Sandberg bluegrass (Poa secunda), grass
-
Idaho fescue (Festuca idahoensis), grass
Figure 24. Annual production by plant type (representative values) or group (midpoint values)
Table 26. Annual production by plant type
Plant type Low
(lb/acre)Representative value
(lb/acre)High
(lb/acre)Grass/Grasslike 140 255 370 Shrub/Vine 150 220 290 Tree 180 200 220 Forb 30 50 70 Total 500 725 950 Table 27. Ground cover
Tree foliar cover 10-20% Shrub/vine/liana foliar cover 10-30% Grass/grasslike foliar cover 10-30% Forb foliar cover 0-20% Non-vascular plants 0% Biological crusts 0-0% Litter 20-30% Surface fragments >0.25" and <=3" 0-10% Surface fragments >3" 0-10% Bedrock 0% Water 0% Bare ground 0-20% Table 28. Soil surface cover
Tree basal cover 0-0% Shrub/vine/liana basal cover 0.1-1.0% Grass/grasslike basal cover 0-10% Forb basal cover 0-0% Non-vascular plants 0% Biological crusts 0-10% Litter 0.0-0.1% Surface fragments >0.25" and <=3" 10-20% Surface fragments >3" 10-30% Bedrock 0-0% Water 0% Bare ground 30-50% Figure 25. Plant community growth curve (percent production by month). OR4301 , Claypan 12-16 PZ, poor condition.
Jan Feb Mar Apr May Jun Jul Aug Sep Oct Nov Dec J F M A M J J A S O N D 0 0 5 20 30 25 5 0 5 10 0 0 Community 4.2
Western JuniperWestern juniper dominates and shrub cover is diminished. For this site this transition typically occurs at a 20 percent or greater canopy cover of juniper where the site will be expressing late stage 2 or stage 3 juniper invasion (see Miller et al. USGS, 2007). Sandberg bluegrass may be dominant in the understory and non-native annual species may be abundant. As juniper cover increases, shrubs are eliminated, infiltration decreases, soil moisture is reduced and erosion accelerates. Idaho fescue typically persists longer than other deep-rooted bunchgrasses due to its shade tolerance. It may be very challenging to restore ecological function once the site has reached this community. In an analysis of 68 plots collected on this ecological site between 2005 and 2020, one plot (1 percent) was classified to this community, these data were insufficient to characterize species or group annual production.
Dominant plant species
-
western juniper (Juniperus occidentalis), tree
-
Sandberg bluegrass (Poa secunda), grass
Figure 26. Annual production by plant type (representative values) or group (midpoint values)
Table 29. Annual production by plant type
Plant type Low
(lb/acre)Representative value
(lb/acre)High
(lb/acre)Tree 250 300 400 Grass/Grasslike 125 250 300 Forb 25 50 75 Shrub/Vine 0 50 75 Total 400 650 850 Table 30. Ground cover
Tree foliar cover 20-30% Shrub/vine/liana foliar cover 0-10% Grass/grasslike foliar cover 10-30% Forb foliar cover 0-10% Non-vascular plants 0% Biological crusts 0-0% Litter 20-30% Surface fragments >0.25" and <=3" 0-10% Surface fragments >3" 0-10% Bedrock 0% Water 0% Bare ground 10-20% Table 31. Soil surface cover
Tree basal cover 0-0% Shrub/vine/liana basal cover 0.0-0.1% Grass/grasslike basal cover 0-10% Forb basal cover 0-0% Non-vascular plants 0% Biological crusts 0-10% Litter 0.0-0.1% Surface fragments >0.25" and <=3" 10-30% Surface fragments >3" 10-40% Bedrock 0-0% Water 0% Bare ground 20-60% Figure 27. Plant community growth curve (percent production by month). OR4301 , Claypan 12-16 PZ, poor condition.
Jan Feb Mar Apr May Jun Jul Aug Sep Oct Nov Dec J F M A M J J A S O N D 0 0 5 20 30 25 5 0 5 10 0 0 Pathway 4.1A
Community 4.1 to 4.2Time without fire allows cover to increase.
Context dependence.Above average precipitation may facilitate wester juniper regeneration and growth (Miller 2019).
State 5
Annual
In this state, the site has crossed a threshold into a state dominated by introduced annual species, especially invasive annual grasses. Invasive annual grasses become increasingly dominant though time by altering nutrient cycling, litter creation, and soil moisture capture thereby promoting positive feedbacks. An increase in fire frequency may also occur due to higher fine fuel loads that become flammable earlier in the season. Shrub and tree cover is variable. Shallow-rooted perennial grasses are common but are no longer controlling site resources.
Characteristics and indicators. • Annual grass cover typically greater than 25 percent • Deep-rooted perennial grass cover typically less than 5 percent • Annual grass cover greater than twice as much as deep-rooted perennial grass cover • Little sagebrush cover may be very low • Herbaceous litter cover may be abnormally high, especially in summer
Resilience management. Focus management actions on reducing invasive annual grass cover and spread to adjacent sites.
Dominant plant species
-
little sagebrush (Artemisia arbuscula), shrub
-
cheatgrass (Bromus tectorum), grass
-
medusahead (Taeniatherum caput-medusae), grass
-
North Africa grass (Ventenata dubia), grass
Community 5.1
Annual Grass and ShrubsIntroduced annual grasses are dominant and shrubs are sub-dominant. Annual native and introduced forbs may also be common. The little sagebrush component of the site is typically still intact but may be replaced by resprouting rabbitbrush species if fire occurs. In an analysis of 68 plots collected on this ecological site between 2005 and 2020, no plots were classified to this community, therefore, annual production values were extrapolated from 5.2 and other similar ecological sites.
Dominant plant species
-
little sagebrush (Artemisia arbuscula), shrub
-
medusahead (Taeniatherum caput-medusae), grass
-
North Africa grass (Ventenata dubia), grass
-
cheatgrass (Bromus tectorum), grass
Figure 28. Annual production by plant type (representative values) or group (midpoint values)
Table 32. Annual production by plant type
Plant type Low
(lb/acre)Representative value
(lb/acre)High
(lb/acre)Grass/Grasslike 175 250 370 Shrub/Vine 100 150 200 Tree 0 50 80 Forb 25 50 70 Total 300 500 720 Figure 29. Plant community growth curve (percent production by month). OR4302 , Claypan 12-16 PZ, annual invaded.
Jan Feb Mar Apr May Jun Jul Aug Sep Oct Nov Dec J F M A M J J A S O N D 0 0 10 25 35 15 0 0 5 10 0 0 Community 5.2
Annual Grass
Introduced annual grasses are dominant. Annual native and introduced forbs may also be common. Dominant annual grasses include medusahead, cheatgrass and North Africa grass. Cover of little sagebrush and western juniper is variable but will decrease, and likely remain suppressed, if fire occurs. In an analysis of 68 plots collected on this ecological site between 2005 and 2020, two plots (3 percent) were classified to this community. These data were insufficient to characterize species level annual production.
Dominant plant species
-
cheatgrass (Bromus tectorum), grass
-
North Africa grass (Ventenata dubia), grass
-
medusahead (Taeniatherum caput-medusae), grass
Figure 30. Annual production by plant type (representative values) or group (midpoint values)
Table 33. Annual production by plant type
Plant type Low
(lb/acre)Representative value
(lb/acre)High
(lb/acre)Grass/Grasslike 200 290 530 Forb 25 50 100 Tree 0 5 50 Shrub/Vine 0 5 20 Total 225 350 700 Table 34. Ground cover
Tree foliar cover 0-10% Shrub/vine/liana foliar cover 0-0% Grass/grasslike foliar cover 40-80% Forb foliar cover 10-10% Non-vascular plants 0% Biological crusts 0-0% Litter 10-40% Surface fragments >0.25" and <=3" 0-10% Surface fragments >3" 0-10% Bedrock 0% Water 0% Bare ground 0-10% Table 35. Soil surface cover
Tree basal cover 0.0-0.1% Shrub/vine/liana basal cover 0.0-0.5% Grass/grasslike basal cover 0-10% Forb basal cover 0-0% Non-vascular plants 0% Biological crusts 0-10% Litter 0% Surface fragments >0.25" and <=3" 0-30% Surface fragments >3" 0-20% Bedrock 0% Water 0% Bare ground 30-80% Figure 31. Plant community growth curve (percent production by month). OR4302 , Claypan 12-16 PZ, annual invaded.
Jan Feb Mar Apr May Jun Jul Aug Sep Oct Nov Dec J F M A M J J A S O N D 0 0 10 25 35 15 0 0 5 10 0 0 Pathway 5.1A
Community 5.1 to 5.2Fire occurs and eliminates shrubs. May also be caused by a mechanical shrub removal treatment.
Context dependence.Probability of fire may increase following successive years with increased spring precipitation and high annual grass production
Transition T1A
State 1 to 2
Reference
Current PotentialIntroduction of non-native species; long-term overutilization by livestock.
Context dependence.Ecological drought may increase the likelihood of this transition
Transition T2A
State 2 to 3
Current Potential
DegradedInappropriate grazing management, especially repeated growing season over utilization, will reduce deep-rooted perennial grasses and lead to soil compaction and eventually erosion
Context dependence.Soil is particularly vulnerable to compaction during late winter and spring when it is moist or saturated but unfrozen; this transition is most likely to occur from the 2.3 at-risk phase.
Transition T2B
State 2 to 4
Current Potential
EncroachedTime and lack of fire allows for maturation of the tree community
Context dependence.Years with above average precipitation may accelerate establishment and growth of western juniper (Miller et al. 2019); adjacent seed sources will also increase juniper establishment rates.
Transition T2C
State 2 to 5
Current Potential
AnnualCatastrophic fire, multiple fires, soil disturbing treatments, inappropriate grazing management
Context dependence.Transition rate and probability will depend on existing cover, reproductive vigor and seedbank density of invasive annual species; higher than normal spring precipitation may interact with these disturbances to further favor increases in annual plant composition; this transition may be more likely to occur from the 2.3 at-risk phase.
Transition T3B
State 3 to 4
Degraded
EncroachedTime and lack of fire allows for maturation of the tree community
Context dependence.Years with above average precipitation may accelerate establishment and growth of western juniper (Miller et al. 2019); adjacent seed sources will also increase juniper establishment rates.
Transition T3A
State 3 to 5
Degraded
AnnualCatastrophic fire, multiple fires, soil disturbing treatments, inappropriate grazing management
Context dependence.Transition rate and probability will depend on existing cover, reproductive vigor and seedbank density of invasive annual species; higher than normal spring precipitation may interact with these disturbances to further favor increases in annual plant composition
Restoration pathway R4A
State 4 to 2
Encroached
Current PotentialThinning of trees, potentially coupled with seeding of desired species if required. Use of fire should be restricted to sites without little sagebrush and very low cover of annual species.
Context dependence.If most functional groups are still present, community 4.1 may be potentially restored to State 2; if most functional groups have been diminished or soil loss has occurred, 4.2 is likely to restore to State 3. Hand thinning may help decrease soil disruption while mechanical thinning may increase compaction; seeding success is low on this site and will depend in part on existing exotic grass pressure.
Restoration pathway R4B
State 4 to 3
Encroached
DegradedGround disturbing mechanical tree thinning treatment; potentially coupled with a failed seeding. Use of fire should be restricted to sites without little sagebrush and very low cover of annual species.
Context dependence.If most functional groups are still present, community 4.1 may be potentially restored to State 2; if most functional groups have been diminished or soil loss has occurred, 4.2 is likely to restore to State 3. Hand thinning may help decrease soil disruption while mechanical thinning may compact soils and increase the likelihood of a transition to State 3; seeding success is low on this site and will depend in part on existing exotic grass pressure.
Transition T4A
State 4 to 5
Encroached
AnnualGround disturbing mechanical tree thinning treatment, catastrophic fire
Context dependence.Transition rate and probability will depend on existing cover, reproductive vigor and seedbank density of invasive annual species
Restoration pathway R5A
State 5 to 3
Annual
DegradedTreatment of annual grasses, likely requiring herbicide application; coupled with seeding of desired native species
Context dependence.Above average growing season precipitation may increase establishment success; restoration success will be much more likely from community 5.1 than 5.2 given a greater composition of functional groups
Additional community tables
Table 36. Community 1.1 plant community composition
Group Common name Symbol Scientific name Annual production () Foliar cover (%) Grass/Grasslike1 Perennial, deep-rooted, dominant 460–650 Idaho fescue FEID Festuca idahoensis 320–530 – bluebunch wheatgrass PSSP6 Pseudoroegneria spicata 40–120 – 2 Perennial, deep-rooted 10–30 prairie Junegrass KOMA Koeleria macrantha 10–20 – 3 Perennial, shallow-rooted, sub-dominant 20–50 Sandberg bluegrass POSE Poa secunda 20–50 – Forb4 Perennial forbs 50–110 common yarrow ACMI2 Achillea millefolium 0–16 – pussytoes ANTEN Antennaria 0–16 – serrate balsamroot BASE2 Balsamorhiza serrata 0–16 – Indian paintbrush CASTI2 Castilleja 0–16 – fleabane ERIGE2 Erigeron 0–16 – buckwheat ERIOG Eriogonum 0–16 – desertparsley LOMAT Lomatium 0–16 – largehead clover TRMA3 Trifolium macrocephalum 0–16 – spiny phlox PHHO Phlox hoodii 0–16 – longleaf phlox PHLO2 Phlox longifolia 0–16 – lupine LUPIN Lupinus 0–16 – 6 Annual forbs, native 0–10 maiden blue eyed Mary COPA3 Collinsia parviflora 0–10 – slender phlox MIGR Microsteris gracilis 0–10 – rough eyelashweed BLSC Blepharipappus scaber 0–10 – Shrub/Vine10 Shrubs, dominant 60–100 little sagebrush ARAR8 Artemisia arbuscula 60–100 – 11 Other shrubs 0–20 antelope bitterbrush PUTR2 Purshia tridentata 0–20 – Tree12 Tree, evergreen 0–20 western juniper JUOC Juniperus occidentalis 0–20 – Table 37. Community 1.2 plant community composition
Group Common name Symbol Scientific name Annual production () Foliar cover (%) Grass/Grasslike1 Perennial, deep-rooted, dominant 250–400 Idaho fescue FEID Festuca idahoensis 160–280 – bluebunch wheatgrass PSSP6 Pseudoroegneria spicata 60–140 – 2 Perennial, deep-rooted 25–40 Thurber's needlegrass ACTH7 Achnatherum thurberianum 0–20 – prairie Junegrass KOMA Koeleria macrantha 0–20 – squirreltail ELEL5 Elymus elymoides 0–15 – 3 Perennial, shallow-rooted, sub-dominant 30–50 Sandberg bluegrass POSE Poa secunda 30–50 – Forb4 Perennial forbs 50–110 common yarrow ACMI2 Achillea millefolium 0–16 – pussytoes ANTEN Antennaria 0–16 – serrate balsamroot BASE2 Balsamorhiza serrata 0–16 – Indian paintbrush CASTI2 Castilleja 0–16 – fleabane ERIGE2 Erigeron 0–16 – buckwheat ERIOG Eriogonum 0–16 – desertparsley LOMAT Lomatium 0–16 – largehead clover TRMA3 Trifolium macrocephalum 0–16 – spiny phlox PHHO Phlox hoodii 0–16 – longleaf phlox PHLO2 Phlox longifolia 0–16 – lupine LUPIN Lupinus 0–16 – 6 Annual forbs, native 5–10 maiden blue eyed Mary COPA3 Collinsia parviflora 0–10 – slender phlox MIGR Microsteris gracilis 0–10 – rough eyelashweed BLSC Blepharipappus scaber 0–10 – Shrub/Vine10 Shrubs, dominant 120–200 little sagebrush ARAR8 Artemisia arbuscula 120–200 – 11 Other shrubs 20–60 antelope bitterbrush PUTR2 Purshia tridentata 0–40 – rubber rabbitbrush ERNA10 Ericameria nauseosa 0–30 – Truckee rabbitbrush CHHU2 Chrysothamnus humilis 0–10 – spineless horsebrush TECA2 Tetradymia canescens 0–10 – big sagebrush ARTR2 Artemisia tridentata 0–10 – Tree12 Tree, evergreen 0–30 western juniper JUOC Juniperus occidentalis 0–30 – Table 38. Community 2.1 plant community composition
Group Common name Symbol Scientific name Annual production () Foliar cover (%) Grass/Grasslike1 Perennial, deep-rooted, dominant 390–555 Idaho fescue FEID Festuca idahoensis 250–400 12–30 bluebunch wheatgrass PSSP6 Pseudoroegneria spicata 90–200 8–26 2 Perennial, deep-rooted 20–50 Thurber's needlegrass ACTH7 Achnatherum thurberianum 0–25 0–3 prairie Junegrass KOMA Koeleria macrantha 10–20 1–2 squirreltail ELEL5 Elymus elymoides 0–15 0–2 3 Perennial, shallow-rooted, sub-dominant 20–60 Sandberg bluegrass POSE Poa secunda 20–60 3–16 9 Annual grass, introduced 10–80 cheatgrass BRTE Bromus tectorum 10–80 1–20 North Africa grass VEDU Ventenata dubia 0–20 0–4 Forb4 Perennial forbs, common 40–75 spiny phlox PHHO Phlox hoodii 10–20 1–5 lupine LUPIN Lupinus 0–20 0–5 tapertip hawksbeard CRAC2 Crepis acuminata 0–20 0–1 arrowleaf balsamroot BASA3 Balsamorhiza sagittata 0–10 0–2 parsnipflower buckwheat ERHE2 Eriogonum heracleoides 0–10 0–2 common yarrow ACMI2 Achillea millefolium 0–10 0–2 Blue Mountain buckwheat ERST4 Eriogonum strictum 0–10 0–1 longleaf fleabane ERCO5 Erigeron corymbosus 0–5 0–3 5 Perrenial forbs, other 10–25 pussytoes ANTEN Antennaria 0–10 0–3 desertparsley LOMAT Lomatium 0–10 0–2 longleaf phlox PHLO2 Phlox longifolia 0–5 0–1 fleabane ERIGE2 Erigeron 0–5 0–1 sagebrush mariposa lily CAMA5 Calochortus macrocarpus 0–5 0–1 6 Annual forbs, native 5–10 maiden blue eyed Mary COPA3 Collinsia parviflora 0–10 1–2 largeflower hawksbeard CROC Crepis occidentalis 0–5 0–1 slender phlox MIGR Microsteris gracilis 0–5 0–1 grand collomia COGR4 Collomia grandiflora 0–5 0–1 Shrub/Vine10 Shrubs, dominant 40–120 little sagebrush ARAR8 Artemisia arbuscula 40–120 3–12 11 Other shrubs 10–25 big sagebrush ARTR2 Artemisia tridentata 0–20 0–3 rubber rabbitbrush ERNA10 Ericameria nauseosa 0–10 0–2 yellow rabbitbrush CHVI8 Chrysothamnus viscidiflorus 0–10 0–2 antelope bitterbrush PUTR2 Purshia tridentata 0–10 0–1 spineless horsebrush TECA2 Tetradymia canescens 0–5 0–1 Tree12 Tree, evergreen 5–50 western juniper JUOC Juniperus occidentalis 5–50 0–6 Table 39. Community 2.2 plant community composition
Group Common name Symbol Scientific name Annual production () Foliar cover (%) Grass/Grasslike1 Perennial, deep-rooted, dominant 240–350 Idaho fescue FEID Festuca idahoensis 100–260 8–22 bluebunch wheatgrass PSSP6 Pseudoroegneria spicata 40–180 2–18 2 Perennial, deep-rooted 10–30 prairie Junegrass KOMA Koeleria macrantha 0–20 0–4 Thurber's needlegrass ACTH7 Achnatherum thurberianum 0–15 0–3 squirreltail ELEL5 Elymus elymoides 0–15 0–2 3 Perennial, shallow-rooted, sub-dominant 40–80 Sandberg bluegrass POSE Poa secunda 40–80 5–20 9 Annual grass, introduced 0–60 cheatgrass BRTE Bromus tectorum 0–60 2–12 North Africa grass VEDU Ventenata dubia 0–20 0–5 Forb4 Perennial forbs, common 20–50 spiny phlox PHHO Phlox hoodii 5–20 1–3 longleaf phlox PHLO2 Phlox longifolia 5–20 1–2 pussytoes ANTEN Antennaria 0–20 0–2 common yarrow ACMI2 Achillea millefolium 5–20 1–2 5 Perrenial forbs, other 10–40 lupine LUPIN Lupinus 0–20 0–4 slender buckwheat ERMI4 Eriogonum microthecum 0–10 0–4 tapertip hawksbeard CRAC2 Crepis acuminata 0–10 0–4 parsnipflower buckwheat ERHE2 Eriogonum heracleoides 0–5 0–3 milkvetch ASTRA Astragalus 0–5 0–3 fleabane ERIGE2 Erigeron 0–5 0–2 sagebrush mariposa lily CAMA5 Calochortus macrocarpus 0–5 0–1 6 Annual forbs, native 5–20 slender phlox MIGR Microsteris gracilis 0–10 0–3 rough eyelashweed BLSC Blepharipappus scaber 0–10 0–2 maiden blue eyed Mary COPA3 Collinsia parviflora 0–5 0–1 7 Annual forbs, introduced 0 Shrub/Vine10 Shrubs, dominant 120–200 little sagebrush ARAR8 Artemisia arbuscula 120–200 12–22 11 Other shrubs 0–60 antelope bitterbrush PUTR2 Purshia tridentata 0–40 0–7 rubber rabbitbrush ERNA10 Ericameria nauseosa 0–30 0–4 big sagebrush ARTR2 Artemisia tridentata 0–10 0–3 Truckee rabbitbrush CHHU2 Chrysothamnus humilis 0–10 0–2 spineless horsebrush TECA2 Tetradymia canescens 0–10 0–1 Tree12 Tree, evergreen 5–60 western juniper JUOC Juniperus occidentalis 5–60 2–8 Table 40. Community 2.3 plant community composition
Group Common name Symbol Scientific name Annual production () Foliar cover (%) Grass/Grasslike1 Perennial, deep-rooted, dominant 100–200 Idaho fescue FEID Festuca idahoensis 40–140 2–12 bluebunch wheatgrass PSSP6 Pseudoroegneria spicata 0–120 0–8 2 Perennial, deep-rooted 0–20 squirreltail ELEL5 Elymus elymoides 0–20 1–2 3 Perennial, shallow-rooted, sub-dominant 60–120 Sandberg bluegrass POSE Poa secunda 60–120 24–34 bulbous bluegrass POBU Poa bulbosa 0–20 0–5 9 Annual grass, introduced 70–115 cheatgrass BRTE Bromus tectorum 60–100 14–20 North Africa grass VEDU Ventenata dubia 0–80 0–15 medusahead TACA8 Taeniatherum caput-medusae 0–40 0–5 Forb4 Perennial forbs, common 40–80 Blue Mountain buckwheat ERST4 Eriogonum strictum 5–30 1–6 common yarrow ACMI2 Achillea millefolium 5–20 2–3 Indian paintbrush CASTI2 Castilleja 0–15 0–2 Idaho milkvetch ASCO11 Astragalus conjunctus 0–10 0–1 arrowleaf balsamroot BASA3 Balsamorhiza sagittata 0–10 0–1 5 Perrenial forbs, other 20–35 threadleaf fleabane ERFI2 Erigeron filifolius 0–10 0–3 desertparsley LOMAT Lomatium 0–10 0–2 parsnipflower buckwheat ERHE2 Eriogonum heracleoides 0–10 0–2 mariposa lily CALOC Calochortus 0–10 0–2 phlox PHLOX Phlox 0–10 0–1 6 Annual forbs, native 5–15 chaparral willowherb EPMI Epilobium minutum 0–10 0–3 grand collomia COGR4 Collomia grandiflora 0–10 0–2 maiden blue eyed Mary COPA3 Collinsia parviflora 0–10 0–2 largeflower hawksbeard CROC Crepis occidentalis 0–10 0–2 7 Annual forbs, introduced 10–30 jagged chickweed HOUM Holosteum umbellatum 0–20 0–7 spring draba DRVE2 Draba verna 0–10 0–4 prickly lettuce LASE Lactuca serriola 0–10 0–1 tall tumblemustard SIAL2 Sisymbrium altissimum 0–5 0–1 Shrub/Vine10 Shrubs, dominant 40–150 little sagebrush ARAR8 Artemisia arbuscula 40–150 4–18 11 Other shrubs 0–25 rubber rabbitbrush ERNA10 Ericameria nauseosa 0–20 0–4 spineless horsebrush TECA2 Tetradymia canescens 0–5 0–2 big sagebrush ARTR2 Artemisia tridentata 0–5 0–1 yellow rabbitbrush CHVI8 Chrysothamnus viscidiflorus 0–5 0–1 Tree12 Tree, evergreen 5–60 western juniper JUOC Juniperus occidentalis 5–60 1–8 Table 41. Community 3.1 plant community composition
Group Common name Symbol Scientific name Annual production () Foliar cover (%) Table 42. Community 3.2 plant community composition
Group Common name Symbol Scientific name Annual production () Foliar cover (%) Grass/Grasslike1 Perennial, deep-rooted – Idaho fescue FEID Festuca idahoensis 0 2–7 bluebunch wheatgrass PSSP6 Pseudoroegneria spicata 0 2–5 prairie Junegrass KOMA Koeleria macrantha 0 0–1 Thurber's needlegrass ACTH7 Achnatherum thurberianum 0 0–1 3 Perennial, shallow-rooted – Sandberg bluegrass POSE Poa secunda 0 15–30 bulbous bluegrass POBU Poa bulbosa – 0–5 9 Annual grass, introduced – cheatgrass BRTE Bromus tectorum 0 5–20 North Africa grass VEDU Ventenata dubia 0 10–15 medusahead TACA8 Taeniatherum caput-medusae 0 0–10 rattlesnake brome BRBR5 Bromus briziformis 0 0–2 Forb4 Perennial forbs – largehead clover TRMA3 Trifolium macrocephalum 0 0–3 rock buckwheat ERSP7 Eriogonum sphaerocephalum 0 0–3 phlox PHLOX Phlox 0 0–2 sagebrush false dandelion NOTR2 Nothocalais troximoides 0 0–1 pale agoseris AGGL Agoseris glauca 0 0–1 common yarrow ACMI2 Achillea millefolium 0 0–1 fleabane ERIGE2 Erigeron 0 0–1 pussytoes ANTEN Antennaria 0 0–1 6 Annual forbs, native – tall annual willowherb EPBR3 Epilobium brachycarpum 0 0–2 rough eyelashweed BLSC Blepharipappus scaber 0 0–1 7 Annual forbs, introduced – desert madwort ALDE Alyssum desertorum 0 0–1 bull thistle CIVU Cirsium vulgare 0 0–1 spring draba DRVE2 Draba verna – 0–1 Shrub/Vine10 Shrubs, dominant – little sagebrush ARAR8 Artemisia arbuscula 0 15–20 11 Other shrubs – rubber rabbitbrush ERNA10 Ericameria nauseosa 0 0–2 big sagebrush ARTR2 Artemisia tridentata 0 0–1 yellow rabbitbrush CHVI8 Chrysothamnus viscidiflorus 0 0–1 Tree12 Tree, evergreen – western juniper JUOC Juniperus occidentalis 0 1–6 Table 43. Community 4.1 plant community composition
Group Common name Symbol Scientific name Annual production () Foliar cover (%) Grass/Grasslike1 Perennial, deep-rooted, dominant 85–200 Idaho fescue FEID Festuca idahoensis 40–160 5–20 bluebunch wheatgrass PSSP6 Pseudoroegneria spicata 30–80 3–6 2 Perennial, deep-rooted 0–20 Thurber's needlegrass ACTH7 Achnatherum thurberianum 0–20 0–3 prairie Junegrass KOMA Koeleria macrantha 0–10 0–2 squirreltail ELEL5 Elymus elymoides 0–10 0–1 3 Perennial, shallow-rooted, sub-dominant 15–60 Sandberg bluegrass POSE Poa secunda 15–60 2–15 9 Annual grass, introduced 40–90 North Africa grass VEDU Ventenata dubia 30–80 5–15 cheatgrass BRTE Bromus tectorum 5–60 1–10 Forb4 Perennial forbs, common 30–70 spiny phlox PHHO Phlox hoodii 0–15 0–5 parsnipflower buckwheat ERHE2 Eriogonum heracleoides 0–10 0–3 fleabane ERIGE2 Erigeron 0–10 0–3 agoseris AGOSE Agoseris 0–10 0–3 common yarrow ACMI2 Achillea millefolium 0–10 0–3 pussytoes ANTEN Antennaria 5–10 1–2 onion ALLIU Allium 0–5 0–2 milkvetch ASTRA Astragalus 0–5 0–1 desertparsley LOMAT Lomatium 0–5 0–1 longleaf phlox PHLO2 Phlox longifolia 0–5 0–1 arrowleaf balsamroot BASA3 Balsamorhiza sagittata 0–2 0–1 sagebrush mariposa lily CAMA5 Calochortus macrocarpus 0–2 0–1 ragwort SENEC Senecio 0–2 0–1 Shrub/Vine10 Shrubs, dominant 150–250 little sagebrush ARAR8 Artemisia arbuscula 150–250 10–20 11 Other shrubs 0–40 big sagebrush ARTR2 Artemisia tridentata 0–30 0–3 rubber rabbitbrush ERNA10 Ericameria nauseosa 0–30 0–2 antelope bitterbrush PUTR2 Purshia tridentata 0–20 0–2 Truckee rabbitbrush CHHU2 Chrysothamnus humilis 0–10 0–3 yellow rabbitbrush CHVI8 Chrysothamnus viscidiflorus 0–10 0–1 Tree12 Tree, evergreen 180–220 western juniper JUOC Juniperus occidentalis 180–220 9–14 Table 44. Community 4.2 plant community composition
Group Common name Symbol Scientific name Annual production () Foliar cover (%) Grass/Grasslike1 Perennial, deep-rooted – Idaho fescue FEID Festuca idahoensis – 5–15 bluebunch wheatgrass PSSP6 Pseudoroegneria spicata – 2–8 squirreltail ELEL5 Elymus elymoides – 0–2 prairie Junegrass KOMA Koeleria macrantha – 0–2 3 Perennial, shallow-rooted – Sandberg bluegrass POSE Poa secunda – 10–25 9 Annual grass, introduced – Forb4 Perennial forbs – lupine LUPIN Lupinus – 0–4 fleabane ERIGE2 Erigeron – 0–1 common yarrow ACMI2 Achillea millefolium – 0–1 parsnipflower buckwheat ERHE2 Eriogonum heracleoides – 0–1 pussytoes ANTEN Antennaria – 0–1 sandwort ARENA Arenaria – 0–1 tapertip hawksbeard CRAC2 Crepis acuminata – 0–1 rock buckwheat ERSP7 Eriogonum sphaerocephalum – 0–1 western stoneseed LIRU4 Lithospermum ruderale – 0–1 nineleaf biscuitroot LOTR2 Lomatium triternatum – 0–1 owl's-clover ORTHO Orthocarpus – 0–1 spiny phlox PHHO Phlox hoodii – 0–1 yellow salsify TRDU Tragopogon dubius – 0–1 Shrub/Vine10 Shrubs, dominant – little sagebrush ARAR8 Artemisia arbuscula – 0–5 11 Other shrubs – big sagebrush ARTR2 Artemisia tridentata – 0–1 yellow rabbitbrush CHVI8 Chrysothamnus viscidiflorus – 0–1 antelope bitterbrush PUTR2 Purshia tridentata – 0–1 Tree12 Tree, evergreen – western juniper JUOC Juniperus occidentalis – 12–25 Table 45. Community 5.1 plant community composition
Group Common name Symbol Scientific name Annual production () Foliar cover (%) Table 46. Community 5.2 plant community composition
Group Common name Symbol Scientific name Annual production () Foliar cover (%) Grass/Grasslike2 Perennial, deep-rooted 25–80 bluebunch wheatgrass PSSP6 Pseudoroegneria spicata – 0–7 Idaho fescue FEID Festuca idahoensis – 0–7 squirreltail ELEL5 Elymus elymoides – 0–3 3 Perennial, shallow-rooted 25–50 Sandberg bluegrass POSE Poa secunda – 2–8 9 Annual grass, introduced 150–350 medusahead TACA8 Taeniatherum caput-medusae – 20–60 cheatgrass BRTE Bromus tectorum – 15–40 North Africa grass VEDU Ventenata dubia – 0–20 rattlesnake brome BRBR5 Bromus briziformis – 0–5 Forb5 Perennial forbs 10–50 buckwheat ERIOG Eriogonum – 0–4 tapertip onion ALAC4 Allium acuminatum – 0–3 common yarrow ACMI2 Achillea millefolium – 0–2 yellow salsify TRDU Tragopogon dubius – 0–2 lupine LUPIN Lupinus – 0–2 desertparsley LOMAT Lomatium – 0–2 6 Annual forbs, native 5–10 willowherb EPILO Epilobium – 0–15 trumpet COLLO Collomia – 0–3 maiden blue eyed Mary COPA3 Collinsia parviflora – 0–2 cryptantha CRYPT Cryptantha – 0–2 largeflower hawksbeard CROC Crepis occidentalis – 0–1 7 Annual forbs, introduced 10–20 prickly lettuce LASE Lactuca serriola – 0–3 desert madwort ALDE Alyssum desertorum – 0–2 herb sophia DESO2 Descurainia sophia – 0–2 jagged chickweed HOUM Holosteum umbellatum – 0–2 tall tumblemustard SIAL2 Sisymbrium altissimum – 0–2 field pennycress THAR5 Thlaspi arvense – 0–2 spring draba DRVE2 Draba verna – 0–2 Shrub/Vine11 Shrubs 0–40 little sagebrush ARAR8 Artemisia arbuscula – 0–1 rubber rabbitbrush ERNA10 Ericameria nauseosa – 0–1 antelope bitterbrush PUTR2 Purshia tridentata – 0–1 yellow rabbitbrush CHVI8 Chrysothamnus viscidiflorus – 0–1 Tree12 Tree, evergreen 0–10 western juniper JUOC Juniperus occidentalis – 0–5 Interpretations
Supporting information
Inventory data references
This site was verified using vegetation and soils data summarized across 68 plots collected on this ecological site across MLRA10 in Oregon from 2005 to 2022. Of these plots, 17 included vegetative production estimates, all included cover estimates. Data sources: NRCS ecological site plots, n = 4; BLM ecological site inventory (ESI), n = 50; BLM assessment inventory and monitoring (AIM), n = 14. A list of plots with names, locations (for publicly available plots), data collection intensity and associated state and plant community is available to users with EDIT developer privileges. For these plots, coordinate locations listed are in WGS84. Site_IDs included that are not in NASIS for data duplication or legal reasons are preceded by "Pville_ESI", 'Oregon_AIM', or 'NRI'.
References
-
Chambers, J.C., D.A. Pyke, J.D. Maestas, M. Pellant, C.S. Boyd, S.B. Campbell, S. Esipinosa, D.W. Havlina, K.E. Mayer, and A. Wuenschel. 2014. Using resistance and resilience concepts to reduce impacts of invasive annual grasses and altered fire regimes on the sagebrush ecosystem and greater sage-grouse: A strategic multi-scale approach.. Gen. Tech. Rep. RMRS-GTR-326.. U.S. Department of Agriculture, Forest Service, Rocky Mountain Research Station., Fort Collins, CO. 73.
-
Conrad, C.E. and C.E. Poulton. 1966. Effect of a Wildfire on Idaho Fescue and Bluebunch Wheatgrass. Journal of Range Management 19:138–141.
-
Miller, R.F., T.J. Svejcar, and J.A. Rose. 2000. Impacts of western juniper on plant community composition and structure. Journal of Range Management 53:574–585.
-
Stringham, T.K., D. Snyder, P. Novak-Echenique, A. Wartgow, A. Badertscher, and K. O'Neill. 2019. Great Basin Ecological Site Development Project: State and Transition Models for Major Land Resource Area 23, Nevada and portions of California. Nevada Agricultural Experiment Station Research Report 2019-01. University of Nevada Reno, Reno, Nevada.
-
Stringham, T.k., D. Snyder, and A. Wartgow. 2016. State-and-Transition Models for USFS Crooked River National Grassland Major Land Resource Area B10 Oregon. DRAFT Report.. University of Nevada Reno, Reno, NV.
-
Burns, R.M., B.H. Honkala, and others. 1990. Silvics of North America. Volume 1: Conifers. Agriculture Handbook 654. U.S. Department of Agriculture, Forest Service.
Other references
Bates, Jonathan D. and Davies, Kirk W. "Early Succession Following Prescribed Fire in Low Sagebrush (Artemisia arbuscula var. Arbuscula) Steppe," Western North American Naturalist 82 (1), 50-66, (8 April 2022). https://doi.org/10.3398/064.082.0105
Bradley, B. A., Curtis, C. A., Fusco, E. J., Abatzoglou, J. T., Balch, J. K., Dadashi, S., & Tuanmu, M.-N. (2018). Cheatgrass (Bromus tectorum) distribution in the intermountain Western United States and its relationship to fire frequency, seasonality, and ignitions. Biological Invasions, 20, 1493–1506. https://doi.org/10.1007/s10530-017-1641-8
Bradley, A.F., N.V. Noste, and W.C. Fischer. 1992. Fire ecology of forests and woodlands in Utah. Gen. Tech. Rep. INT-287. Ogden, UT. U.S. Department of Agriculture, Forest Service, Intermountain Research Station. 128 p.
Howard, Janet L. 1997. Poa secunda. In: Fire Effects Information System, [Online].
U.S. Department of Agriculture, Forest Service, Rocky Mountain Research Station,
Fire Sciences Laboratory (Producer). Available:
https://www.fs.usda.gov/database/feis/plants/graminoid/poasec/all.html [2024, December 30].
LANDFIRE, 2020, BpS Model 11240 - Columbia Plateau Low Sagebrush Steppe, LANDFIRE 2.0.0, U.S. Department of the Interior, Geological Survey, and U.S. Department of Agriculture. Accessed 11, November 2024 at https://www.fs.usda.gov/database/feis/pdfs/BpS/LF2020/11240_1_7_8_9.pdf
Miller, H.C., D. Clausnitzer, and M.M Borman. 1999a. Medusahead. In: Sheley, R.L. and J.K. Petroff (eds.). Biology and Management of Noxious Rangeland Weeds. Oregon State University Press, Corvallis, OR.
Miller, Richard F.; Bates, Jonathan D.; Svejcar, Tony J.; Pierson, Frederick B.; Eddleman, L.E. 2007. Western juniper field guide: asking the right questions to select appropriate management actions. U.S. Geological Survey Circular 1321. Reston, VA: U.S. Geological Survey. 61 p.
Miller, Richard F.; Chambers, Jeanne C.; Evers, Louisa; Williams, C. Jason; Snyder, Keirith A.; Roundy, Bruce A.; Pierson, Fred B. 2019. The ecology, history, ecohydrology, and management of pinyon and juniper woodlands in the Great Basin and Northern Colorado Plateau of the western United States. Gen. Tech. Rep. RMRS-GTR-403. Fort Collins, CO: U.S. Department of Agriculture, Forest Service, Rocky Mountain Research Station. 284 p.
Miller, R.F.; Tausch, R.J.; McArthur, E. D.; [et al.]. 2008. Age structure and expansion
of piñon-juniper woodlands: A regional perspective in the Intermountain West. Res.
Pap. RMRS-RP-69. Fort Collins, CO: U.S. Department of Agriculture, Forest Service,
Rocky Mountain Research Station. 15 p.
Miller, Richard F.; Tausch, R.J.; Waichler, W.S. 1999. Old-growth juniper and pinyon
woodlands. In: Monsen, S.B.; Richards, S. Tausch, R.J. [et al.], comps. Proceedings of
the ecology and management of pinyon-juniper communities within the Interior West;
1997 September 15-18; Provo, UT. Proc. RMRS-P-9. Ogden, UT: U.S. Department of
Agriculture, Forest Service, Rocky Mountain Research Station: 375-384.
Steinberg, Peter D. 2002. Artemisia arbuscula. In: Fire Effects Information System, [Online]. U.S. Department of Agriculture, Forest Service, Rocky Mountain Research Station, Fire Sciences Laboratory (Producer). Available: https://www.fs.usda.gov/database/feis/plants/shrub/artarb/all.html [accessed 2024, February 1].
Stringham, T.K., D. Snyder, and A. Wartgow. 2016. State-and-Transition Models for USFS Crooked River National Grassland Major Land Resource Area B10 Oregon. DRAFT Report. University of Nevada Reno.
Tausch, R. J. 1999. Historic pinyon and juniper woodland development. Proceedings: ecology and management of pinyon–juniper communities within the Interior West. Ogden, UT, USA: US Department of Agriculture, Forest Service, Rocky Mountain Research Station, RMRS-P-9:12-19
Young, R.P. 1983. Fire as a vegetation management tool in rangelands of the Intermountain region. In: Monsen, S.B. and N. Shaw (Eds). Managing Intermountain rangelands—improvement of range and wildlife habitats: Proceedings of symposia; 1981 September 15-17; Twin Falls, ID; 1982 June 22-24; Elko, NV. Gen. Tech. Rep. INT-157. Ogden, UT. U.S. Department of Agriculture, Forest Service, Intermountain Forest and Range Experiment Station. Pp. 18-31.
Zamora, B.; Tueller, Paul T. 1973. Artemisia arbuscula, A. longiloba, and A. nova habitat types in northern Nevada. The Great Basin Naturalist. 33(4): 225-242.Contributors
Bob Gillaspy
Cici Brooks
Ed Petersen, Alan Bahn
Andrew Neary - verification project 2024Approval
Kirt Walstad, 5/16/2025
Rangeland health reference sheet
Interpreting Indicators of Rangeland Health is a qualitative assessment protocol used to determine ecosystem condition based on benchmark characteristics described in the Reference Sheet. A suite of 17 (or more) indicators are typically considered in an assessment. The ecological site(s) representative of an assessment location must be known prior to applying the protocol and must be verified based on soils and climate. Current plant community cannot be used to identify the ecological site.
Author(s)/participant(s) Jeff Repp and Bruce Frannsen Contact for lead author State Rangeland Management Specialist for NRCS – Oregon Date 08/07/2012 Approved by Approval date Composition (Indicators 10 and 12) based on Annual Production Indicators
-
Number and extent of rills:
None, moderate sheet & rill erosion hazard -
Presence of water flow patterns:
None -
Number and height of erosional pedestals or terracettes:
None -
Bare ground from Ecological Site Description or other studies (rock, litter, lichen, moss, plant canopy are not bare ground):
5 to 15 percent -
Number of gullies and erosion associated with gullies:
None -
Extent of wind scoured, blowouts and/or depositional areas:
None, moderate wind erosion hazard -
Amount of litter movement (describe size and distance expected to travel):
Fine - limited movement -
Soil surface (top few mm) resistance to erosion (stability values are averages - most sites will show a range of values):
Significantly resistant to erosion: aggregate stability = 4 to 6 -
Soil surface structure and SOM content (include type of structure and A-horizon color and thickness):
Shallow with a strongly developed claypan with silt loams, or silty clay loams 5 to 10 inches thick: moderate OM (2 to 4 percent) -
Effect of community phase composition (relative proportion of different functional groups) and spatial distribution on infiltration and runoff:
Significant ground cover (80 to 90 percent) and gentle to moderate slopes (15 to 45 percent) effectively limit rainfall impact and overland flow -
Presence and thickness of compaction layer (usually none; describe soil profile features which may be mistaken for compaction on this site):
None -
Functional/Structural Groups (list in order of descending dominance by above-ground annual-production or live foliar cover using symbols: >>, >, = to indicate much greater than, greater than, and equal to):
Dominant:
Idaho fescue > Bluebunch wheatgrass > Scabland sagebrush > other grasses > forbs > Western JuniperSub-dominant:
Other:
Additional:
-
Amount of plant mortality and decadence (include which functional groups are expected to show mortality or decadence):
Normal decadence and mortality expected -
Average percent litter cover (%) and depth ( in):
-
Expected annual annual-production (this is TOTAL above-ground annual-production, not just forage annual-production):
Favorable: 1000, Normal: 800, Unfavorable: 600 lbs/acre/year at high RSI (HCPC) -
Potential invasive (including noxious) species (native and non-native). List species which BOTH characterize degraded states and have the potential to become a dominant or co-dominant species on the ecological site if their future establishment and growth is not actively controlled by management interventions. Species that become dominant for only one to several years (e.g., short-term response to drought or wildfire) are not invasive plants. Note that unlike other indicators, we are describing what is NOT expected in the reference state for the ecological site:
Western Juniper readily invades the site. Cheatgrass and Medusahead invade sites that have lost deep rooted perennial grass functional groups. -
Perennial plant reproductive capability:
All species should be capable of reproducing annually
Print Options
Sections
Font
AAAAOther
PrintThe Ecosystem Dynamics Interpretive Tool is an information system framework developed by the USDA-ARS Jornada Experimental Range, USDA Natural Resources Conservation Service, and New Mexico State University.
Accessibility statement


