Natural Resources
Conservation Service
Ecological site R010XB064OR
JD North
9-12 PZ
Last updated: 5/13/2025
Accessed: 06/30/2026
-
Search


Major Land Resource Area or ecological site by name and/or ID.
PreviousSectionsNextGeneral information
Provisional. A provisional ecological site description has undergone quality control and quality assurance review. It contains a working state and transition model and enough information to identify the ecological site.
Associated sites
R010XB022OR JD Clayey 9-12 PZ
Site is on Moderately deep to deep soils with a predominance of Bluebunch wheatgrass.
R010XB044OR JD Droughty South 9-12 PZ
Soils on this site are very deep with a predominance of Thurber needlegrass.
Similar sites
R010XB065OR JD Droughty Clayey North 9-12 PZ
Soils are typically very shallow with a predominance of Bluebunch wheatgrass.
Table 1. Dominant plant species
Tree Not specified
Shrub Not specified
Herbaceous Not specified
Physiographic features
This site occurs on northerly exposures of low elevation terraces and canyon slopes composed of early Cenezoic tuffaceous sediments. Slopes range from 5 to 70% with slopes of 12 to 60% being most typical. Elevation varies from 1300 to 3000 feet.
Table 2. Representative physiographic features
Landforms (1) Hill
(2) Hillside
(3) Terrace
Flooding frequency None Ponding frequency None Elevation 1300 – 3000 ft Slope 5 – 70 % Ponding depth 0 in Water table depth 72 in Aspect N, NE, E Climatic features
Elevation and aspect affect precipitation and the relative effectiveness of the precipitation and temperatures. Temperature changes can occur rapidly. In addition, the topography also results in localized cold air drainages, along with occasional cold air entrapment and inversions in the valleys. Annual snowfall is 13 inches to 17 inches, with most coming in the winter and spring. Snow cover is of short duration and melts quickly at low elevations.
Table 3 Representative climatic features
Frost-free period (average) 150 days Freeze-free period (average) 210 days Precipitation total (average) 10 in BarLineFigure 1. Monthly precipitation range
BarLineFigure 2. Monthly average minimum and maximum temperature
">Influencing water features
Soil features
Soils on this site are Mollisols with predominantly gravelly loam over clay textures. The soils are shallow to very deep with fine textures and well drained. These soils are formed from Cenezoic Tuffaceous Sediments that are weathered from John Day (mid-Oligocene) or Clarno (late Eocene) geological formations. Cobbles are present. The soils are generally aridic. The major taxonomic units correlated to this site include fine, smectitic, mesic Vertic Palexerolls.
Table 4. Representative soil features
Surface texture (1) Ashy loam
(2) Gravelly loam
(3) Very stony clay loam
Family particle size (1) Clayey
Drainage class Well drained Permeability class Very slow to slow Soil depth 18 – 60 in Surface fragment cover <=3" 10 – 0 % Surface fragment cover >3" 10 – 0 % Available water capacity
(0-40in)6 – 7 in Calcium carbonate equivalent
(0-40in)0 – 5 % Electrical conductivity
(0-40in)Not specified Sodium adsorption ratio
(0-40in)Not specified Soil reaction (1:1 water)
(0-40in)6.6 – 8.4 Subsurface fragment volume <=3"
(Depth not specified)15 – 0 % Subsurface fragment volume >3"
(Depth not specified)7 – 0 % Ecological dynamics
The interpretative plant community for this site is the Historic Climax Plant Community (HCPC). Grasses with few forbs and shrubs dominate this plant community. Fluctuations in species composition and relative production may change from year to year dependent upon abnormal precipitation or other climatic factors. The historic climax plant community has been determined by study of rangeland relic areas, or areas protected from excess disturbance. Trends in plant communities going from heavily grazed areas to lightly grazed areas, seasonal pastures, and historical accounts have also been used. State and transition model: 1) Over grazing without frequent fire. 2) Proper grazing or rest. 3) Continued mis-management. 4) Proper grazing or rest with brush control. 5) Continued mis-management with fire.
State and transition model
Custom diagramStandard diagram
More interactive model formats are also available. View Interactive Models
More interactive model formats are also available. View Interactive Models
Click on state and transition labels to scroll to the respective textEcosystem states
State 1 submodel, plant communities
State 2 submodel, plant communities
State 1
HCPC: PSSP6-FEIDCommunity 1.1
HCPC: PSSP6-FEID
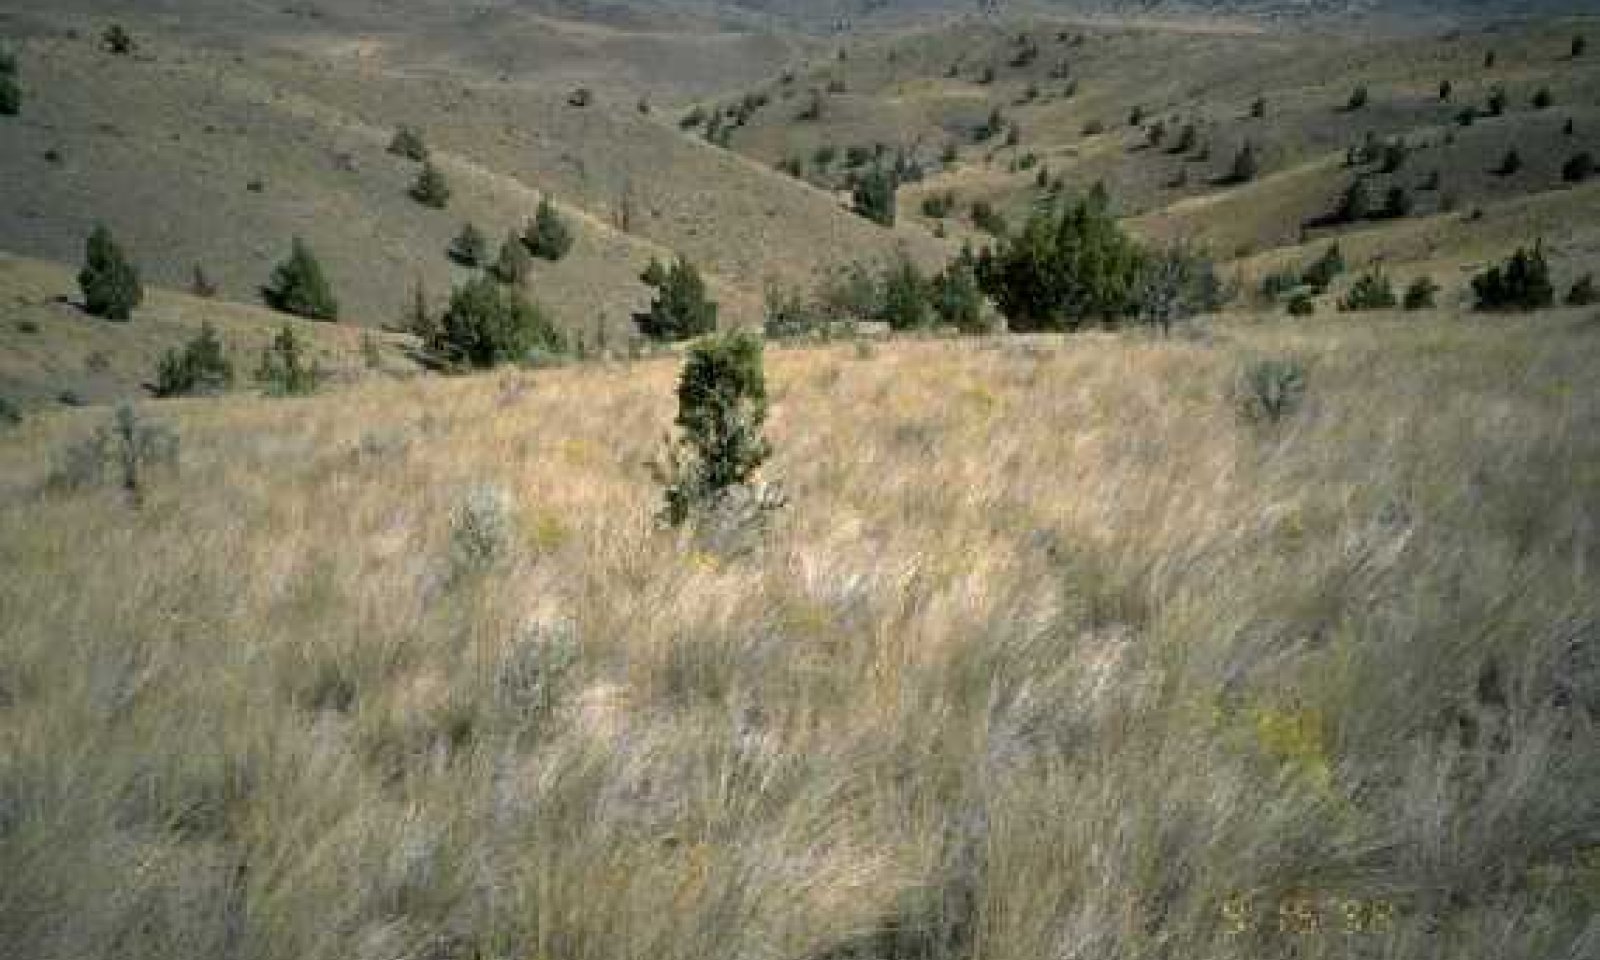
Figure 3. JD Droughty North 9-12" PZ State A
HCPC - Dominated by Bluebunch wheatgrass and Idaho fescue. This plant community evolved with limited grazing by large herbivores and with fire frequency of every 5 to 10 years. About 5% of the plant composition is made up of forbs and 8% of shrubs. Bluebunch wheatgrass increases with clay surface. Idaho fescue increases on due north steep slopes with silty surface.
Figure 4. Annual production by plant type (representative values) or group (midpoint values)
Table 5. Annual production by plant type
Plant type Low
(lb/acre)Representative value
(lb/acre)High
(lb/acre)Grass/Grasslike 850 1020 1360 Shrub/Vine 100 120 160 Forb 50 60 80 Total 1000 1200 1600 Figure 5. Plant community growth curve (percent production by month). OR4271 , B10 JD Droughty North 9-12 A. JD Droughty North 9-12 A RPC Growth Curve.
Jan Feb Mar Apr May Jun Jul Aug Sep Oct Nov Dec J F M A M J J A S O N D 0 0 10 25 35 20 5 0 0 5 0 0 State 2
Juniper - Basin Big Sagebrush / Bluebunch wheatgrass - CheatgrassCommunity 2.1
Juniper - Basin Big Sagebrush / Bluebunch wheatgrass - Cheatgrass
Figure 6. JD Droughty North 9-12" PZ State B
A community dominated by Western Juniper, Basin big sagebrush and cheatgrass. Continued mis-management of this site associated with fire disturbance has caused the deterioration. The site has passed a threshold. Proper grazing with brush control will, over time, eventually bring the site back towards the historic climax plant community.
Figure 7. Annual production by plant type (representative values) or group (midpoint values)
Table 6. Annual production by plant type
Plant type Low
(lb/acre)Representative value
(lb/acre)High
(lb/acre)Grass/Grasslike 450 650 750 Shrub/Vine 90 100 160 Forb 40 50 70 Total 580 800 980 Figure 8. Plant community growth curve (percent production by month). OR4272 , B10 JD Droughty North 9-12 B. State B: JUOC-ARTRT/PSSPS-BRTE.
Jan Feb Mar Apr May Jun Jul Aug Sep Oct Nov Dec J F M A M J J A S O N D 0 0 15 25 40 10 5 0 0 5 0 0 Additional community tables
Table 7. Community 1.1 plant community composition
Group Common name Symbol Scientific name Annual production () Foliar cover (%) Grass/Grasslike1 840–1320 bluebunch wheatgrass PSSPS Pseudoroegneria spicata ssp. spicata 720–960 – Idaho fescue FEID Festuca idahoensis 60–240 – Thurber's needlegrass ACTH7 Achnatherum thurberianum 60–120 – 2 20–40 Sandberg bluegrass POSE Poa secunda 20–40 – Forb3 20–60 common yarrow ACMI2 Achillea millefolium 1–3 – onion ALLIU Allium 1–3 – pussytoes ANTEN Antennaria 1–3 – milkvetch ASTRA Astragalus 1–3 – blepharipappus BLEPH2 Blepharipappus 1–3 – mariposa lily CALOC Calochortus 1–3 – Indian paintbrush CASTI2 Castilleja 1–3 – prairie clover DALEA Dalea 1–3 – fleabane ERIGE2 Erigeron 1–3 – buckwheat ERIOG Eriogonum 1–3 – desertparsley LOMAT Lomatium 1–3 – locoweed OXYTR Oxytropis 1–3 – phlox PHLOX Phlox 1–3 – Shrub/Vine4 35–121 basin big sagebrush ARTRT Artemisia tridentata ssp. tridentata 24–96 – rabbitbrush CHRYS9 Chrysothamnus 5–10 – broom snakeweed GUSA2 Gutierrezia sarothrae 5–10 – shadscale saltbush ATCO Atriplex confertifolia 1–5 – Table 8. Community 2.1 plant community composition
Group Common name Symbol Scientific name Annual production () Foliar cover (%) Forb1 18–40 common yarrow ACMI2 Achillea millefolium 8–20 – salsify TRPO Tragopogon porrifolius 8–20 – milkvetch ASTRA Astragalus 1–8 – desertparsley LOMAT Lomatium 1–8 – Grass/Grasslike2 60–120 bluebunch wheatgrass PSSPS Pseudoroegneria spicata ssp. spicata 30–60 – Idaho fescue FEID Festuca idahoensis 15–30 – squirreltail ELEL5 Elymus elymoides 10–20 – 3 150–300 cheatgrass BRTE Bromus tectorum 70–120 – Sandberg bluegrass POSE Poa secunda 40–80 – rattlesnake brome BRBR5 Bromus briziformis 40–80 – Shrub/Vine4 270–400 basin big sagebrush ARTRT Artemisia tridentata ssp. tridentata 150–200 – western juniper JUOC Juniperus occidentalis 80–120 – broom snakeweed GUSA2 Gutierrezia sarothrae 40–80 – Interpretations
Animal community
GRAZING -
Livestock grazing is suitable for this site as long as management objectives include the improvement or maintenance of this site. It is easy to overuse this site and cause a shift in vegetation that is difficult to change. This site has the potential to produce a large amount of high quality forage. Management should be aimed at harvesting the forage as quickly as possible, letting the site recover from the grazing event prior to fall dormancy. Plant vigor, density and production can be maintained by utilizing livestock through proper grazing management.
Initial stocking rates will be determined with the landowner or decisionmaker. They will be based on past use histories and type and condition of the vegetation. Calculations used to determine an initial starting stocking rate will be based on forage preference ratings.
WILDLIFE -
The main wildlife species of concern on this site are large herbivores. These are mule deer and elk. These wildlife species can possibly overuse this site before the time cattle or sheep are planned to be grazed. Being an open grassland, this site is home to a variety of small herbivores, birds, and their associated predators. This site is mainly a foraging area for the larger wildlife. No threatened or endangered wildlife species rely on this site for any of their habitat requirements.Hydrological functions
The site has a high potential in low seral condition to produce significant run-off to receiving waters. The hydrology of this site is characterized by high intensity thunderstorms during the summer months and by low intensity frontal storms during the winter.
Recreational uses
None
Wood products
No wood products are associated with this site.
Other products
None
Other information
Increase in western juniper and the subsequent competition for moisture will lead to a reduction of available forage. Overgrazing can easily reduce ground cover and accelerate soil loss. Improving infiltration and permeability, and reducing runoff should be the immediate goal of juniper control.
Supporting information
Type locality
Location 1: Wheeler County, OR Township/Range/Section T7S R19E S33 General legal description NE 1/4 Sec 33, T7S, R19E WM National Monument, Clarno Unit (90% SI) Location 2: Wheeler County, OR Township/Range/Section T11S R20E S12 General legal description SE 1/4 NW 1/4 Sec 12, T11S, R20E Immediately south of Painted Hills Unit (90% SI) Other references
Soil Conservation Service, Relative Forage Preference of Plants for Grazing Use by Season, Range Technical Note No. 16, 1982.
Western Regional Climate Center, NOAA, National Weather Service, Portland, OR. Web site - http://nimbo.wrh.noaa.gov/Portland/climate.html. Natural Vegetation of Oregon and Washington, Jerry F. Franklin and C. T. Dyrness. The Ecological Provinces of Oregon, E. William Anderson, Michael M. Borman, and William C. Krueger.Contributors
Bob Gillaspy
Ed Petersen, Rangeland Management Specialist, John Day Field Office.Alan Bahn, Rangeland Management Specialist, Baker City Field OfficeApproval
Kirt Walstad, 5/13/2025
Rangeland health reference sheet
Interpreting Indicators of Rangeland Health is a qualitative assessment protocol used to determine ecosystem condition based on benchmark characteristics described in the Reference Sheet. A suite of 17 (or more) indicators are typically considered in an assessment. The ecological site(s) representative of an assessment location must be known prior to applying the protocol and must be verified based on soils and climate. Current plant community cannot be used to identify the ecological site.
Author(s)/participant(s) Jeff Repp and Bruce Frannsen Contact for lead author State Rangeland Management Specialist for NRCS – Oregon Date 08/06/2012 Approved by Approval date Composition (Indicators 10 and 12) based on Annual Production Indicators
-
Number and extent of rills:
None to some on steeper slopes, moderate sheet & rill erosion hazard -
Presence of water flow patterns:
None to some on steeper slopes -
Number and height of erosional pedestals or terracettes:
None to some on steeper slopes (terracettes) -
Bare ground from Ecological Site Description or other studies (rock, litter, lichen, moss, plant canopy are not bare ground):
5-10% -
Number of gullies and erosion associated with gullies:
None -
Extent of wind scoured, blowouts and/or depositional areas:
None, moderate wind erosion hazard -
Amount of litter movement (describe size and distance expected to travel):
Fine - limited movement -
Soil surface (top few mm) resistance to erosion (stability values are averages - most sites will show a range of values):
Moderately resistant to erosion: aggregate stability = 3-5 -
Soil surface structure and SOM content (include type of structure and A-horizon color and thickness):
Deep, well drained clays, clay loams, ashy, cobbly, or stony loams, or loams: moderate OM (2-4%) -
Effect of community phase composition (relative proportion of different functional groups) and spatial distribution on infiltration and runoff:
Moderate ground cover (50-60%) and gentle to steep slopes (12-60%) moderately limit rainfall impact and overland flow -
Presence and thickness of compaction layer (usually none; describe soil profile features which may be mistaken for compaction on this site):
None -
Functional/Structural Groups (list in order of descending dominance by above-ground annual-production or live foliar cover using symbols: >>, >, = to indicate much greater than, greater than, and equal to):
Dominant:
Bluebunch wheatgrass > Idaho fescue > other grasses > shrubs > forbsSub-dominant:
Other:
Additional:
-
Amount of plant mortality and decadence (include which functional groups are expected to show mortality or decadence):
Normal decadence and mortality expected -
Average percent litter cover (%) and depth ( in):
-
Expected annual annual-production (this is TOTAL above-ground annual-production, not just forage annual-production):
Favorable: 1600, Normal: 1200, Unfavorable: 800 lbs/acre/year at high RSI (HCPC) -
Potential invasive (including noxious) species (native and non-native). List species which BOTH characterize degraded states and have the potential to become a dominant or co-dominant species on the ecological site if their future establishment and growth is not actively controlled by management interventions. Species that become dominant for only one to several years (e.g., short-term response to drought or wildfire) are not invasive plants. Note that unlike other indicators, we are describing what is NOT expected in the reference state for the ecological site:
Cheatgrass and Medusahead invade sites that have lost deep rooted perennial grass functional groups. -
Perennial plant reproductive capability:
All species should be capable of reproducing annually
Print Options
Sections
Font
AAAAOther
PrintThe Ecosystem Dynamics Interpretive Tool is an information system framework developed by the USDA-ARS Jornada Experimental Range, USDA Natural Resources Conservation Service, and New Mexico State University.
Accessibility statement