
Natural Resources
Conservation Service
Ecological site R002XN723WA
Salt Water Bluff
Last updated: 1/24/2025
Accessed: 09/20/2026
-
Search


Major Land Resource Area or ecological site by name and/or ID.
PreviousSectionsNextGeneral information
Provisional. A provisional ecological site description has undergone quality control and quality assurance review. It contains a working state and transition model and enough information to identify the ecological site.
Click to explore map
Figure 1. Mapped extent
Areas shown in blue indicate the maximum mapped extent of this ecological site. Other ecological sites likely occur within the highlighted areas. It is also possible for this ecological site to occur outside of highlighted areas if detailed soil survey has not been completed or recently updated.
MLRA notes
Major Land Resource Area (MLRA): 002X–Willamette and Puget Sound Valleys
Major Land Resource Area-[MLRA][LRU]: 002X N Willamette and Puget Sound Valleys, North Puget. The Land Resource Unit (LRU) is described in detail in the reference Washington NRCS Pasture TN-101 Forage Zones available on the eFOTG. For more information on MLRA’s, refer to the following web site: http://www.essc.psu.edu/soil_info/soil_lrr/. Additional information on Common Resource Areas is available on the eFOTG for NRCS Washington: http://efotg.nrcs.usda.gov/efotg_locator.aspx?map=WA and the following website: http://soils.usda.gov/survey/geography/cra.html. This ecological site occurs in the following Common Resource Areas: 2.10 - Fraser Lowland; 2.11 - Eastern Puget Riverine Lowlands; 2.11 - Eastern Puget Mountain River Valleys; 2.12 - San Juan Islands; 2.13 - Olympic Rainshadow; 2.5 - Eastern Puget Uplands; and 2.6 - Central Puget Lowland
Table 1. Dominant plant species
Tree Not specified
Shrub Not specified
Herbaceous Not specified
Physiographic features
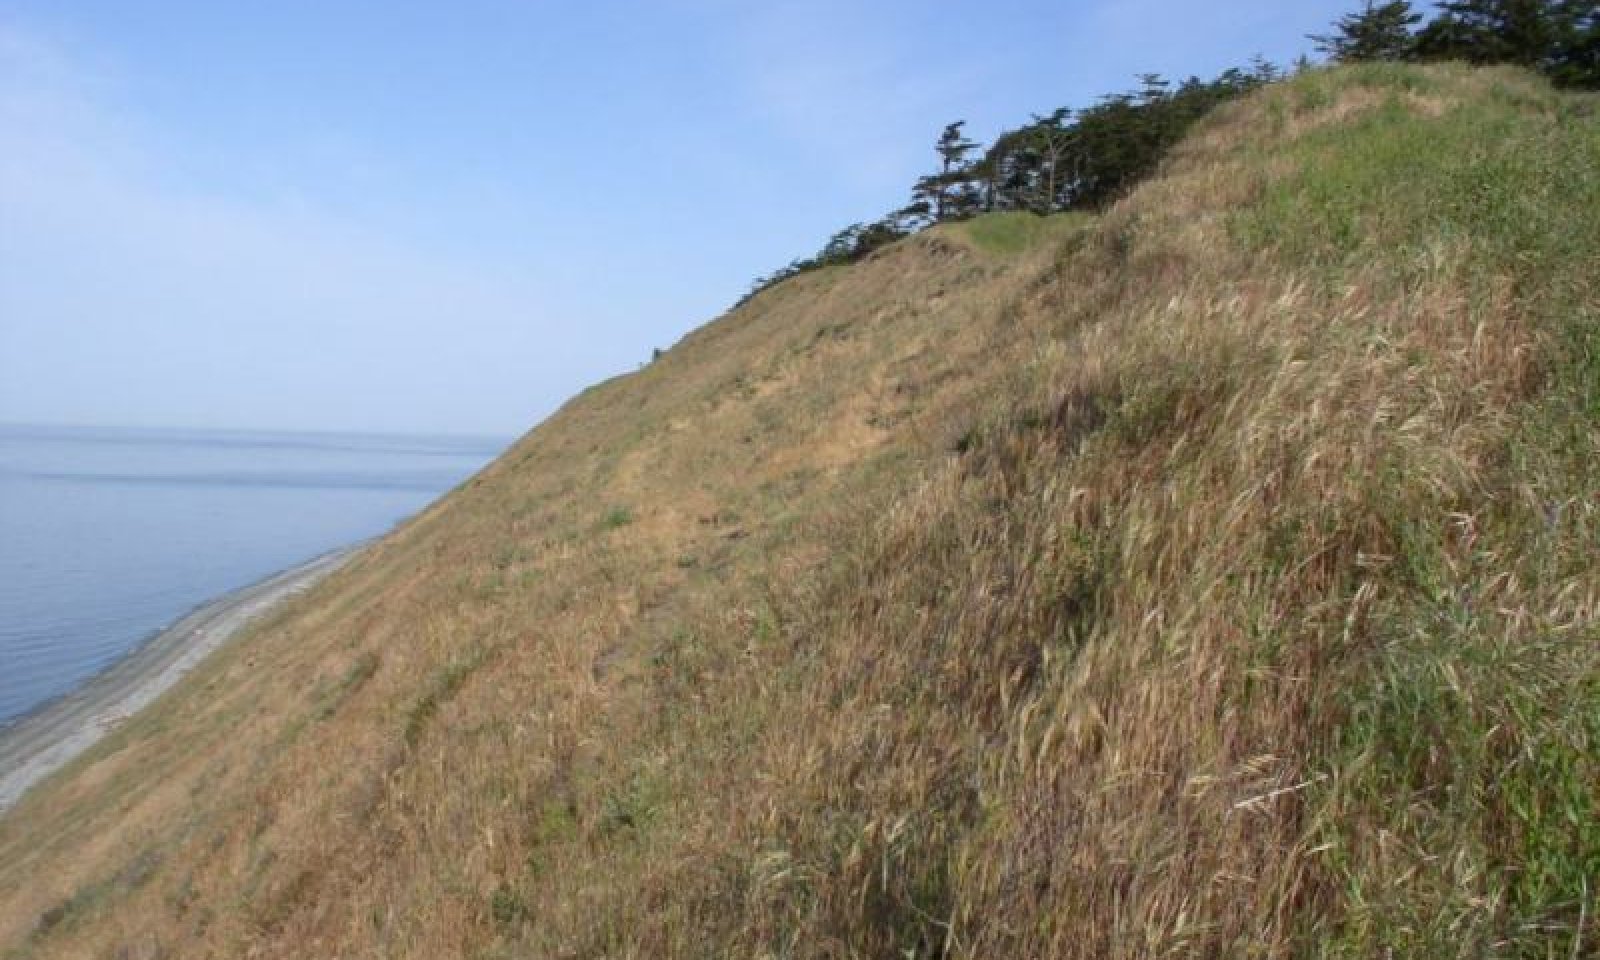
Salt water bluffs can consist of rocky headlands with shallow soils over bedrock or escarpments composed of glacial sediments. Herbaceous salt water bluffs are influenced by wind and salt spray and coarse-textured soils (very sandy or gravelly), which creates a harsh, droughty environment supporting small grasslands in a mosaic with stunted trees and shrublands. In the case of bluffs consisting of glacial sediments, herbaceous vegetation usually occurs only on those portions of steep slopes that have recently eroded, or on sunny aspects (southern to western).
Table 2. Representative physiographic features
Landforms (1) Beach terrace
(2) Shoreline
(3) Sea cliff
Flooding frequency None Ponding frequency None Elevation 0 – 250 ft Slope 0 – 100 % Aspect S, W Climatic features
The average annual precipitation ranges from 18 to 60 inches, although most areas range from 30 to 50 inches. Annual precipitation less than 30 inches occurs in the rainshadow of the Olympic Mountains along the western border of this area and in the San Juan Islands. Higher average annual precipitation, 50 to 60 inches, occurs next to the foothills of the surrounding mountains. Most of the precipitation occurs as low intensity, Pacific frontal storms. The distribution is 75% in the fall and winter, 15% in the spring and 10% in the summer. Rain turns to snow at the higher elevations, although accumulations are usually small and of short duration. The number of days with snow on the ground varies from 0 to 9, with an averge of 3 days. Summers are cool and dry. Recorded temperature extremes range from -1 degrees to 90 degrees fahrenheit. See the climate tables in this document for information on temperatures and frost-free periods.
Table 3 Representative climatic features
Frost-free period (average) 240 days Freeze-free period (average) 300 days Precipitation total (average) 60 in BarLineFigure 2. Monthly precipitation range
BarLineFigure 3. Monthly average minimum and maximum temperature
">Influencing water features
Soil features
Salt water bluffs can consist of rocky headlands with shallow soils over bedrock or escarpments with deep soils composed of glacial sediments. In the case of bluffs consisting of glacial sediments, herbaceous vegetation usually occurs only on soils mapped as Xerorthents on those portions of steep slopes that have recently eroded.
The soils which support this native plant community typically occur on steep bluffs directly above unprotected marine waters. This ecosite may also occur on flatter slopes adjacent to or at the toe-slopes of the bluffs. These soils are influenced by the various “Cold Phase” abiotic factors such as prevailing winds (especially across marine waters) and proximity to unprotected marine waters, which will cause these locales to be cooler than the climate generally associated with these soil series. The effect on the plant community is generally the absence of Oregon White Oak (Quercus garryana) from the community. The soils are generally sandy and droughty, with very dark A horizons in the soil profile. Typical soil series are Xerorthents and Umbric Dystrochrepts.Table 4. Representative soil features
Surface texture (1) Very gravelly sand
Drainage class Excessively drained Permeability class Very rapid Surface fragment cover <=3" 50 % Surface fragment cover >3" 9 % Available water capacity
(0-40in)0.4 – 1.6 in Soil reaction (1:1 water)
(0-40in)5.6 – 6 Subsurface fragment volume <=3"
(Depth not specified)50 % Subsurface fragment volume >3"
(Depth not specified)9 % Ecological dynamics
In comparison to other native prairie plant communities, these communities generally show an increase in Red Fescue (Festuca rubra) with a related reduction in the amount of Roemer’s fescue (Festuca roemeri). Other common native plants are Oregon gumweed (Grindelia stricta), Field Chickweed (Cerastium arvense), Yarrow (Achillea millefolium), Hooker’s onion (Allium acuminatum), Woodrush (Luzula comosa), Bare-stem lomatium (Lomatium nudicaule) and Great Camas (Camassia leichtlinii).
Some disturbance is natural in these plant communities, including: fire, both natural and human caused; soil perturbation resulting from causes such as small mammals, earthworms, root activity; freeze-thaw cycles; and harvest of bulbs and rhizomes; and wildlife grazing. . Disturbances can be reduced or eliminated through actions such as fire control, or cessation of activities such as mowing, soil disturbance, livestock grazing or vehicle access. If no disturbance occurs, this plant community will be invaded by shrub and tree species. Typical shrub and tree species include snowberry, rose, Douglas fir and lodgepole pine. Disturbance will affect the different plant classes in varying ways. Timing of disturbance will also affect shifts in plant communities. The Disturbance Effects on Plant Classes table summarizes some of these effects.
If nonnative species are present in the area, these will invade the site whether or not disturbance is maintained, increased, or eliminated. Their dominance in the community will be affected by the type and intensity of disturbance, as will the dominance of the different plant classes. If disturbance such as tillage, herbicide use, or intensive vehicle traffic eliminates the plant community, then a nonnative plant community will be established, either through planting, or invasion of introduced seral species.
Restoration – It’s possible to reestablish plant communities on suitable soils. Native species can be replanted and the site managed to maintain or increase the percentage cover of these species. The Disturbance Effects table lists appropriate types of disturbance to help establish the desired plant community. If nonnatives are present on the site, there will always be a presence in the community as these species are adapted to a wide range of soils, climates and disturbance regimes. However, the management of disturbance types can affect the balance of species on a site.State and transition model
Custom diagramStandard diagram
More interactive model formats are also available. View Interactive Models
More interactive model formats are also available. View Interactive Models
Click on state and transition labels to scroll to the respective textEcosystem states
State 1 submodel, plant communities
State 2 submodel, plant communities
State 3 submodel, plant communities
State 1
ReferenceThe soils that support this native plant community typically occur on steep bluffs directly above unprotected marine waters. This ecological site description may also occur on flatter slopes adjacent to or at the toe-slopes of the bluffs. The soils are generally sandy and droughty, with very dark A horizons in the soil profile. Typical soil components are Xerorthents and Umbric Dystrochrepts.
In comparison to other native prairie plant communities, these communities generally show an increase in Red Fescue (Festuca rubra) with a related reduction in the amount of Roemer’s fescue (Festuca roemeri). Other common native plants are Oregon gumweed (Grindelia stricta), field chickweed (Cerastium arvense), yarrow (Achillea millefolium), Hooker’s onion (Allium acuminatum), woodrush (Luzula comosa), bare-stem lomatium (Lomatium nudicaule) and great camas (Camassia leichtlinii). These soils are influenced by the various ‘Cold Phase’ abiotic factors such as prevailing winds (especially across marine waters) and proximity to unprotected marine waters, that will cause these locales to be cooler than the climate generally associated with these soil component. The effect on the plant community is generally the absence of Oregon white oak (Quercus garryana) from the community.Community 1.1
Herbaceous Bluff
Figure 4. Annual production by plant type (representative values) or group (midpoint values)
Table 5. Annual production by plant type
Plant type Low
(lb/acre)Representative value
(lb/acre)High
(lb/acre)Forb 158 225 337 Grass/Grasslike 140 200 300 Shrub/Vine 49 70 105 Tree 3 5 8 Total 350 500 750 Figure 5. Plant community growth curve (percent production by month). WA0222 , Droughty. Droughty or limited depth soils (available water-holding capacity generally < 4.5"/40" soil depth).
Jan Feb Mar Apr May Jun Jul Aug Sep Oct Nov Dec J F M A M J J A S O N D 2 8 15 23 19 17 5 1 1 5 3 1 Community 1.2
Native Shrub and Herbaceous BluffPathway 1.1A
Community 1.1 to 1.2No fire or other disturbance
Pathway 1.2A
Community 1.2 to 1.1Fire or brush control or other disturbances such as erosion, sloughing or landslides
State 2
Introduced InvadedCommunity 2.1
Introduced and Native Herbaceous BluffCommunity 2.2
Introduced, Native Shrub, and Herbaceous BluffPathway 2.1A
Community 2.1 to 2.2No fire or other disturbance.
Pathway 2.2A
Community 2.2 to 2.1Fire or brush control or other disturbances such as erosion, sloughing or landslides in the presence of exotic species.
State 3
Conifer InvadedCommunity 3.1
F002XN901WATransition T1A
State 1 to 2Fire or brush control or other disturbances such as erosion, sloughing or landslides in the presence of exotic species.
Transition T1B
State 1 to 3No fire or other disturbance.
Restoration pathway R2A
State 2 to 1Restoration through removal of exotic species.
Transition T2A
State 2 to 3No fire or other disturbance.
Restoration pathway R3A
State 3 to 1Tree removal and restoration by existing plant release or planting of native species.
Restoration pathway R3B
State 3 to 2Tree Removal
Additional community tables
Table 6. Community 1.1 plant community composition
Group Common name Symbol Scientific name Annual production () Foliar cover (%) Grass/Grasslike1 0 California oatgrass DACA3 Danthonia californica 0 – red fescue FERU2 Festuca rubra 0 – prairie Junegrass KOMA Koeleria macrantha 0 – Sandberg bluegrass POSE Poa secunda 0 – 2 Perennial Grasslike 0 long-stolon sedge CAIN9 Carex inops 0 – Pacific woodrush LUCO6 Luzula comosa 0 – 3 Annual Grasses 0 Howell's bluegrass POHO6 Poa howellii 0 – Forb6 Bulbs 0 tapertip onion ALAC4 Allium acuminatum 0 – crown brodiaea BRCO3 Brodiaea coronaria 0 – large camas CALE5 Camassia leichtlinii 0 – small camas CAQU2 Camassia quamash 0 – meadow deathcamas ZIVE Zigadenus venenosus 0 – 7 0 darkthroat shootingstar DOPU Dodecatheon pulchellum 0 – hookedspur violet VIAD Viola adunca 0 – 8 biscuitroots 0 barestem biscuitroot LONU2 Lomatium nudicaule 0 – common lomatium LOUT Lomatium utriculatum 0 – 9 Balsamroot 0 deltoid balsamroot BADE2 Balsamorhiza deltoidea 0 – 10 Perennial Forbs 0 common yarrow ACMI2 Achillea millefolium 0 – field chickweed CEAR4 Cerastium arvense 0 – common woolly sunflower ERLA6 Eriophyllum lanatum 0 – Virginia strawberry FRVI Fragaria virginiana 0 – Oregon gumweed GRST3 Grindelia stricta 0 – western buttercup RAOC Ranunculus occidentalis 0 – 12 Perennial Legume 0 American vetch VIAM Vicia americana 0 – 13 Annual 0 giant blue eyed Mary COGR2 Collinsia grandiflora 0 – 14 Annual Legume 0 desert deervetch LOMI Lotus micranthus 0 – smallflower lupine LUPO3 Lupinus polycarpus 0 – Shrub/Vine20 Shrubs 0 Nootka rose RONU Rosa nutkana 0 – common snowberry SYAL Symphoricarpos albus 0 – Tree25 0 Pacific madrone ARME Arbutus menziesii 0 – lodgepole pine PICO Pinus contorta 0 – Douglas-fir PSME Pseudotsuga menziesii 0 – Table 7. Community 1.2 plant community composition
Group Common name Symbol Scientific name Annual production () Foliar cover (%) Table 8. Community 2.1 plant community composition
Group Common name Symbol Scientific name Annual production () Foliar cover (%) Table 9. Community 2.2 plant community composition
Group Common name Symbol Scientific name Annual production () Foliar cover (%) Table 10. Community 3.1 plant community composition
Group Common name Symbol Scientific name Annual production () Foliar cover (%) Interpretations
Supporting information
Contributors
Martha Chaney
Approval
Kirt Walstad, 1/24/2025
Rangeland health reference sheet
Interpreting Indicators of Rangeland Health is a qualitative assessment protocol used to determine ecosystem condition based on benchmark characteristics described in the Reference Sheet. A suite of 17 (or more) indicators are typically considered in an assessment. The ecological site(s) representative of an assessment location must be known prior to applying the protocol and must be verified based on soils and climate. Current plant community cannot be used to identify the ecological site.
Author(s)/participant(s) Contact for lead author Date 11/27/2024 Approved by Approval date Composition (Indicators 10 and 12) based on Annual Production Indicators
-
Number and extent of rills:
-
Presence of water flow patterns:
-
Number and height of erosional pedestals or terracettes:
-
Bare ground from Ecological Site Description or other studies (rock, litter, lichen, moss, plant canopy are not bare ground):
-
Number of gullies and erosion associated with gullies:
-
Extent of wind scoured, blowouts and/or depositional areas:
-
Amount of litter movement (describe size and distance expected to travel):
-
Soil surface (top few mm) resistance to erosion (stability values are averages - most sites will show a range of values):
-
Soil surface structure and SOM content (include type of structure and A-horizon color and thickness):
-
Effect of community phase composition (relative proportion of different functional groups) and spatial distribution on infiltration and runoff:
-
Presence and thickness of compaction layer (usually none; describe soil profile features which may be mistaken for compaction on this site):
-
Functional/Structural Groups (list in order of descending dominance by above-ground annual-production or live foliar cover using symbols: >>, >, = to indicate much greater than, greater than, and equal to):
Dominant:
Sub-dominant:
Other:
Additional:
-
Amount of plant mortality and decadence (include which functional groups are expected to show mortality or decadence):
-
Average percent litter cover (%) and depth ( in):
-
Expected annual annual-production (this is TOTAL above-ground annual-production, not just forage annual-production):
-
Potential invasive (including noxious) species (native and non-native). List species which BOTH characterize degraded states and have the potential to become a dominant or co-dominant species on the ecological site if their future establishment and growth is not actively controlled by management interventions. Species that become dominant for only one to several years (e.g., short-term response to drought or wildfire) are not invasive plants. Note that unlike other indicators, we are describing what is NOT expected in the reference state for the ecological site:
-
Perennial plant reproductive capability:
Print Options
Sections
Font
AAAAOther
PrintThe Ecosystem Dynamics Interpretive Tool is an information system framework developed by the USDA-ARS Jornada Experimental Range, USDA Natural Resources Conservation Service, and New Mexico State University.
Accessibility statement


